Macrobond Overview

To make working in the application as easy as possible we have created activities. You’ll find the activity tabs on the left side of the application. Consider each activity tab to be the ideal space to complete specific types of tasks. When selecting one of these activity tabs you’re activating the tools you need for the tasks you’d like to do. We like the activities because they simplify things and reduce the amount of space required to work in the application. So what is the purpose of the various activities?

Start

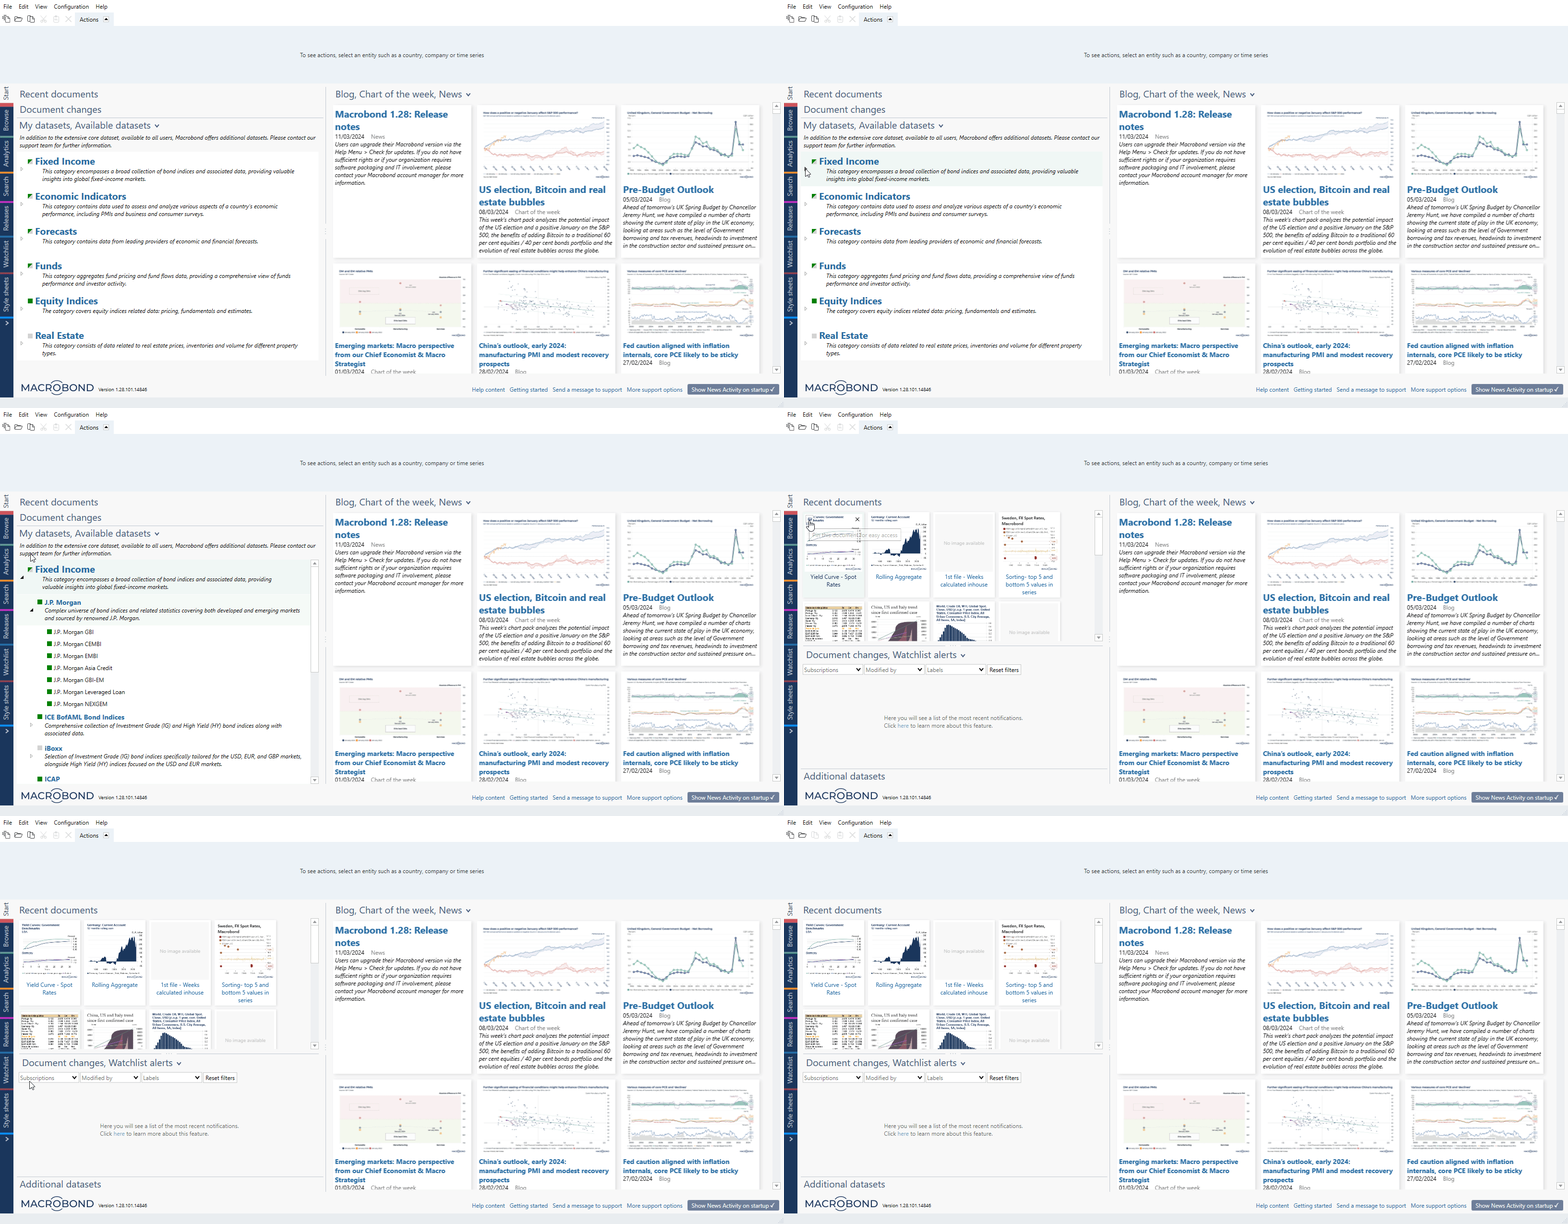
The Start activity page is divided into three sections, 'Recent documents', 'Document changes, Watchlist alerts', 'Additional datasets' and 'Blog, Chart of the week, News' areas. After clicking on 'Blog, Chart of the week, News' you can select which topics you want to see in this section. In the right bottom corner you may find links to user guides and support. For more see Start – overview .

Browse

Selecting the Browse activity allows you to easily find, compare and visualize time series from the database. Browse is particularly effective in making quick and easy comparisons of the same indicators between countries. For more see Browse – overview and Finding data – overview.

Analytics

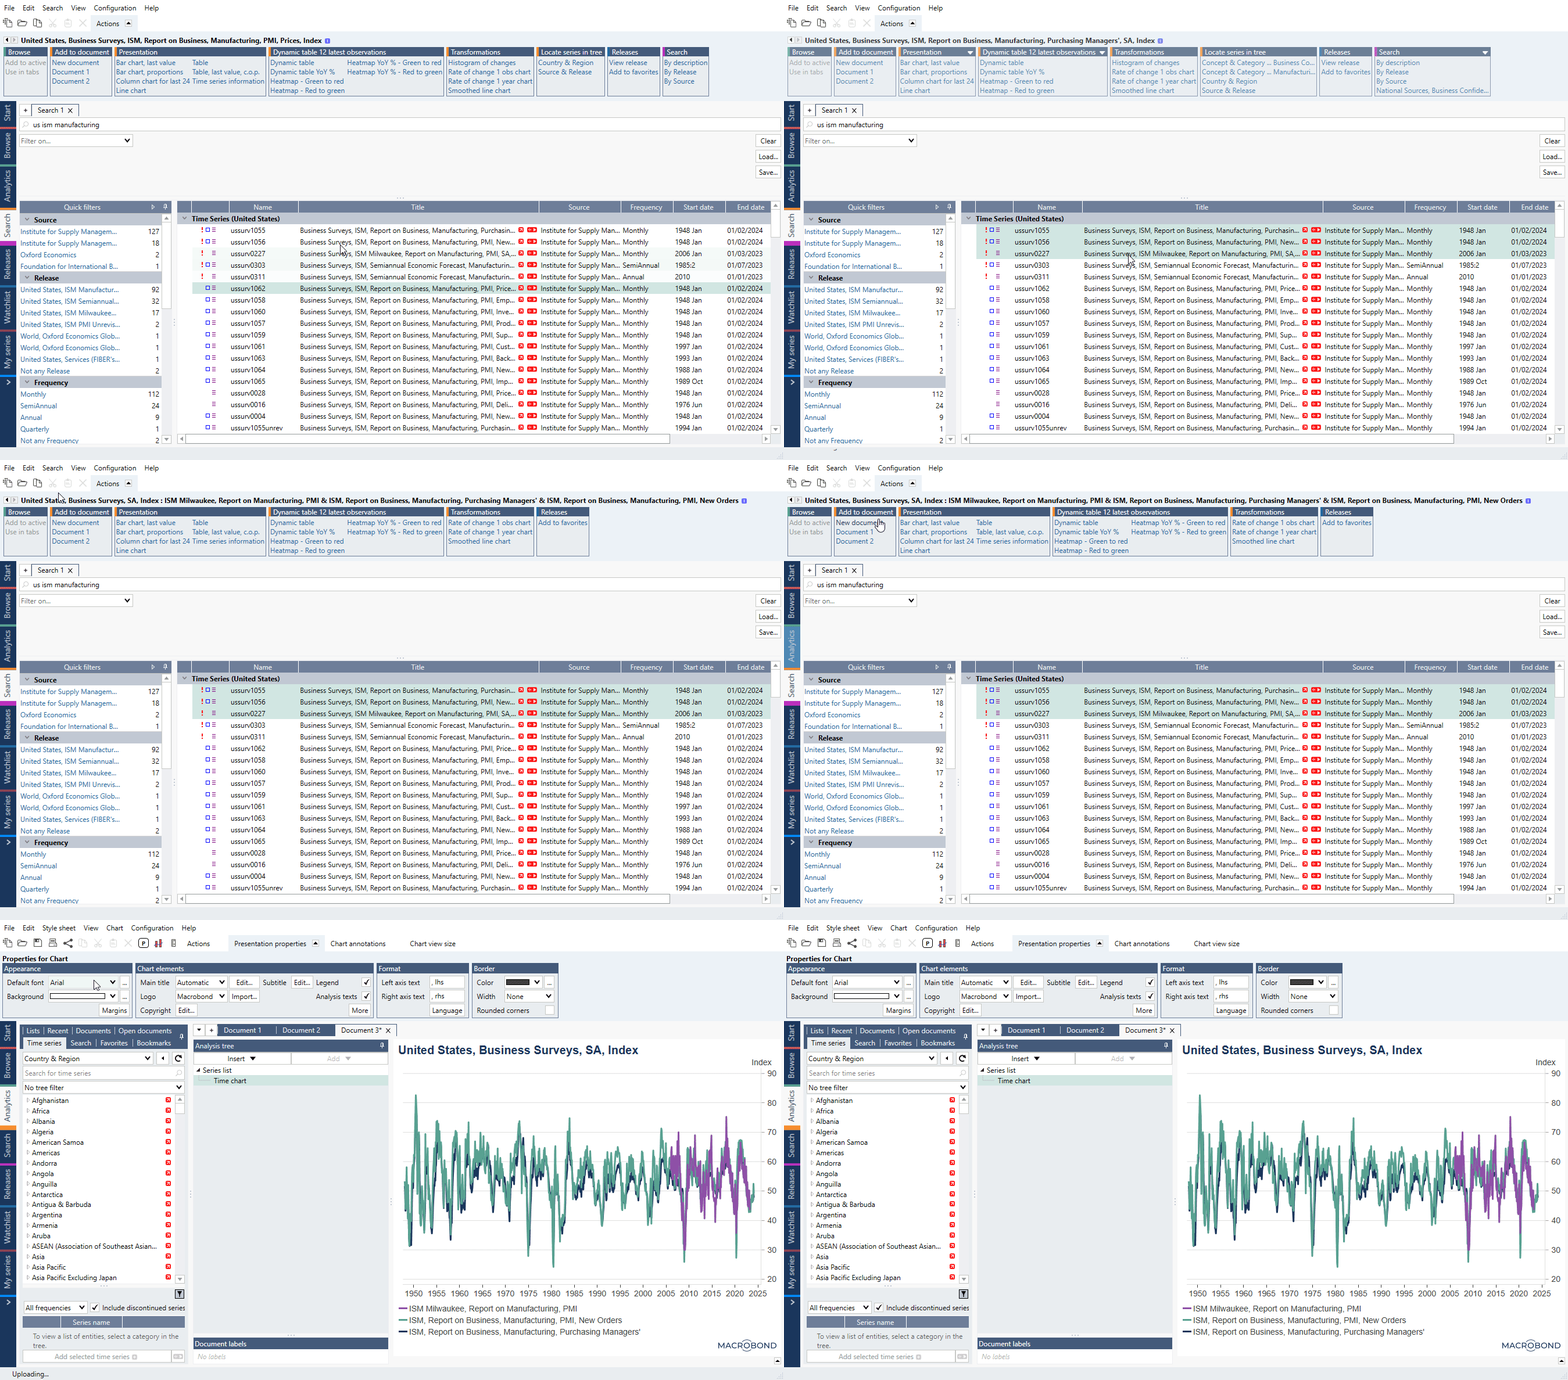
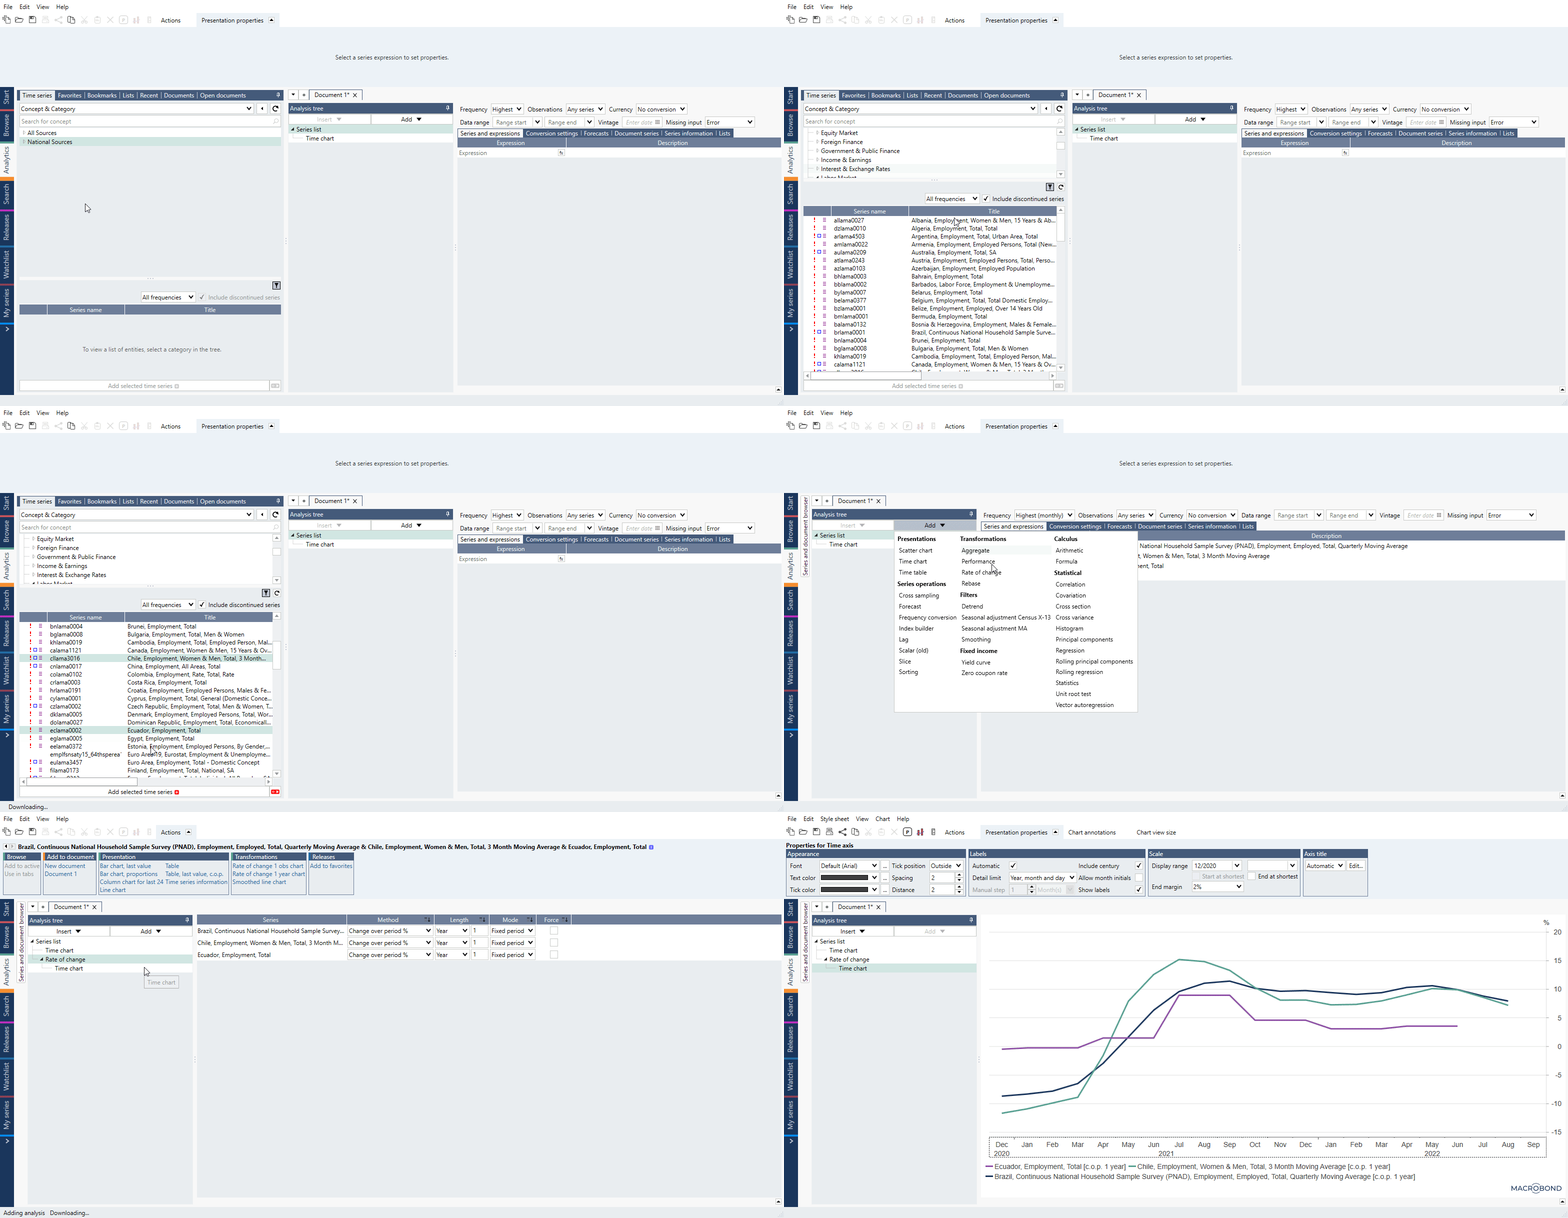
The Analytics activity is the powerhouse of the application. In Analytics, you can find and add time series to a document, create and apply calculations and analyses, and generate different charts and tables. We call these presentations. You can also use the editing tools here - to customize the layout and formatting of your presentations. For more see Analytics – overview and Analyzing data.

Search

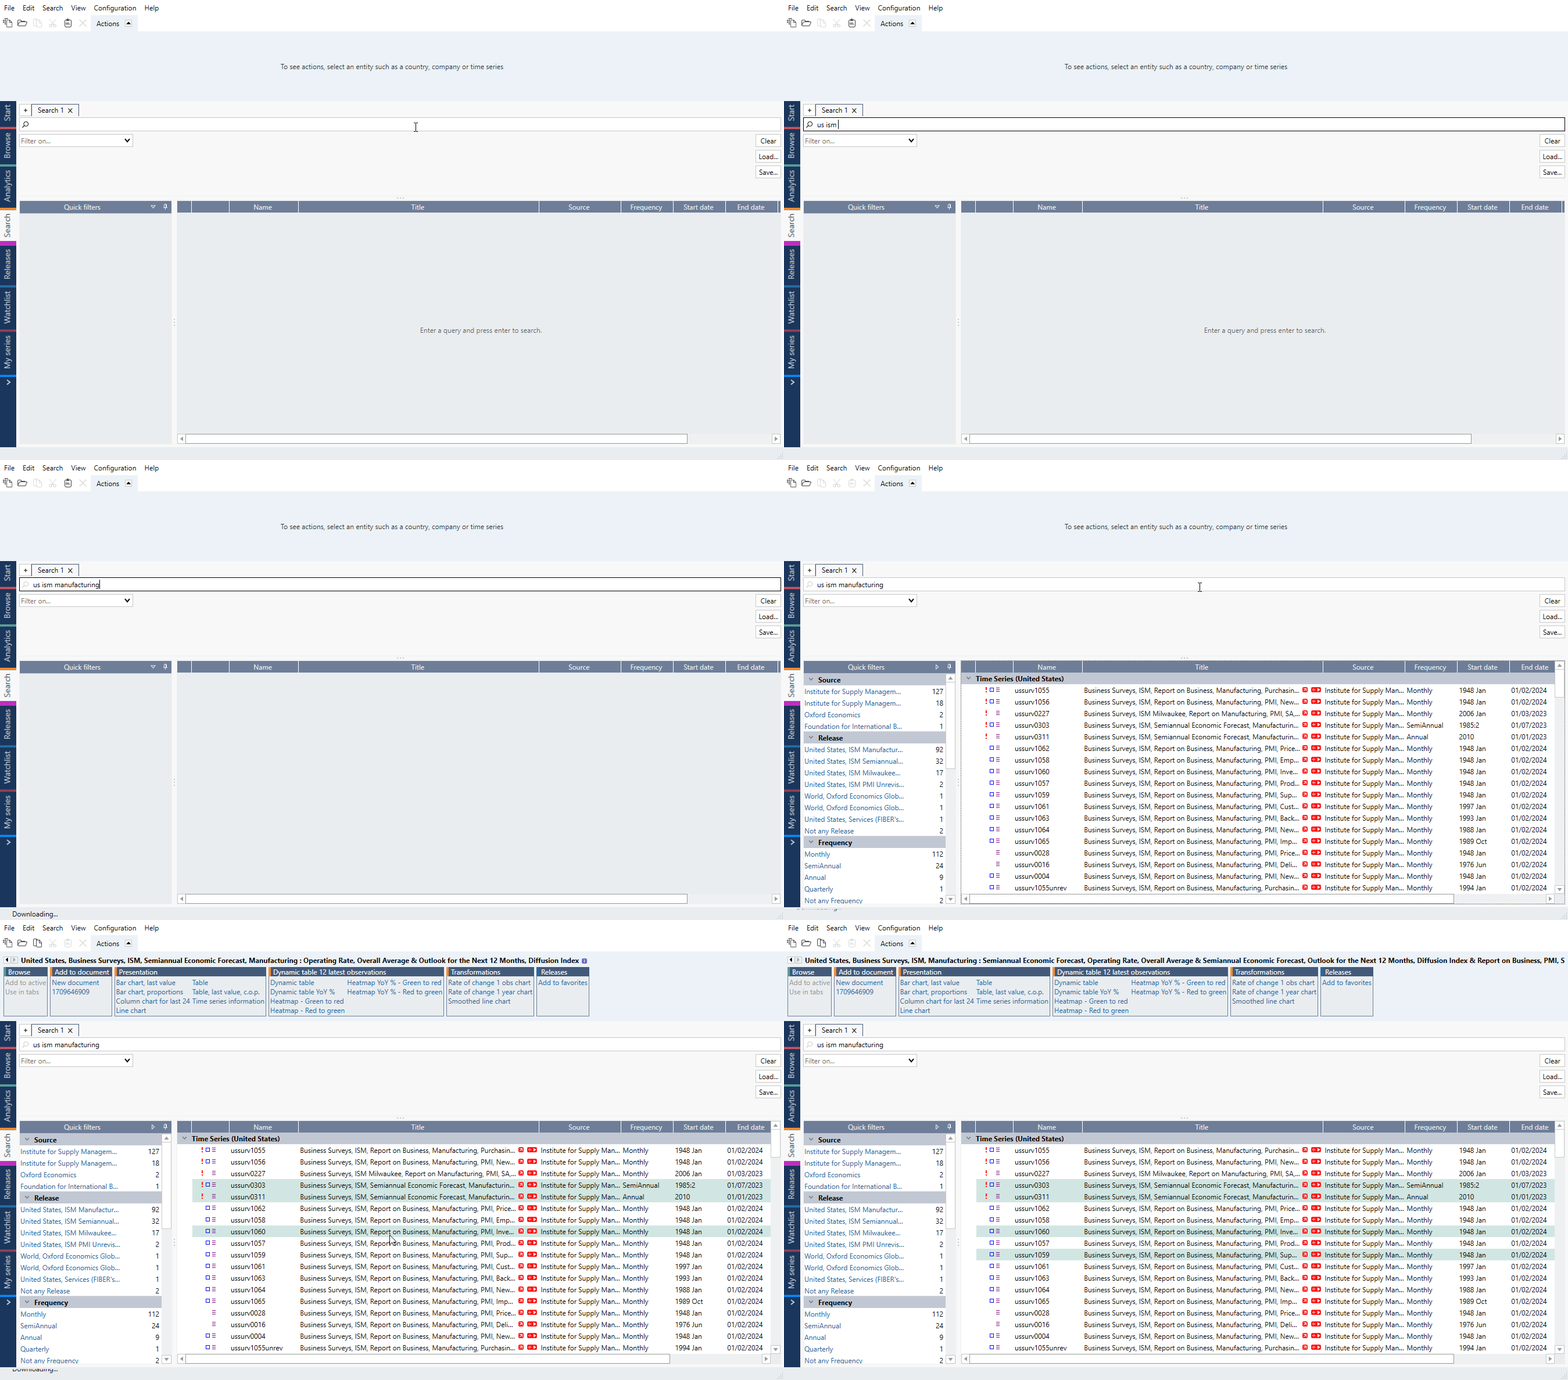
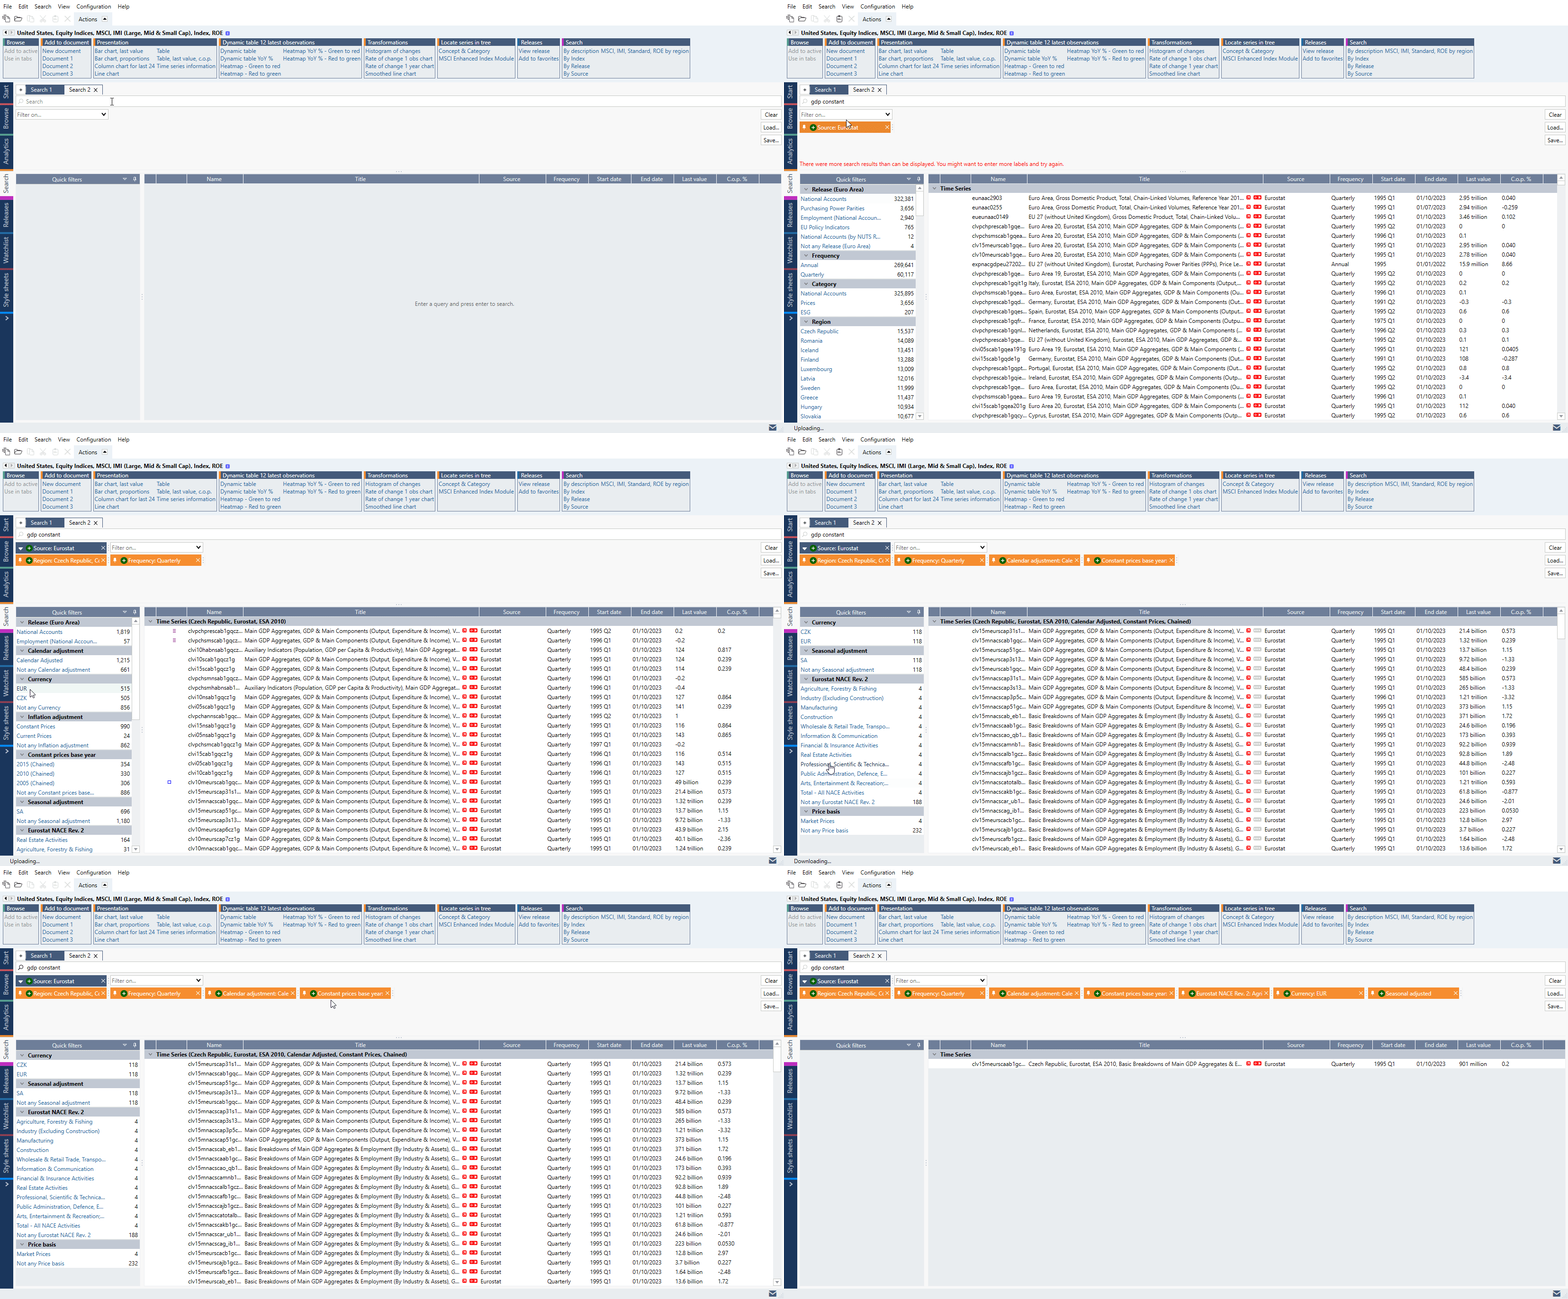
In Search, you can use keywords or our metadata to find time series across all the databases in the application. For more see Search – overview and In Search activity tab.

Releases

Use the Releases tab to stay up to date on data release events from the different sources in the database. For more see Releases – overview and  In Releases activity tab.

Watchlist

This activity can be used to create a customized list of documents you want to monitor, to see when the data within the document is updated or is scheduled to be updated. For more see Watchlist – overview and Watchlist.

Flexi tab

The seventh and final activity tab allows you define a default activity for that tab yourself. The activity is defined by selecting one of the four options from the pop-up menu below the tab, which are referred to as secondary activities.

My lists

In this tab you can create list of series or list of regions the use them in analyses or to search for indicators. You can store your lists just like your in-house series - on Personal, Department or Company account. List can then be used in other documents and be shared with your colleagues. For more see My lists activity tab.

My series

You'll find the secondary activities from the pop up menu below the tab. Select this activity to upload external data to create and edit your own time series. These time series can be used in all the same ways as the Macrobond time series, as well as being combined with them. For more see Integrating and using external data (My series activity tab).

Style sheet

In the Style sheets activity, you can predefine settings for the layout and formatting of your charts. Applying a style sheet creates a consistent look for charts and tables as per your specifications. For more see Style sheet.

Web publish

The Web publish tab provides you with a simple way of publishing Macrobond charts online, for example to blogs, websites or social media channels. Charts can either be published as static or dynamic. For more see Web Publish.
Flexi Tab – overview

Choose from secondary activities to define the last tab

The activity for the last tab can be changed by clicking on the arrow below it and toggling between four secondary activities.

My lists

You can create List of series or List of regions and use them in analyses or to search for indicators. You can store your lists just like your in-house series - on Personal, Department or Company account. List can then be used in other documents and be shared with your colleagues.

For more information see: My lists tab.

My series

You can store your own time series in the in-house database associated with your Macrobond account. Series can be accessed on any computer running Macrobond, and can be stored in different folders.

There s also a possibility of storing data linked to Excel files stored internally, on your own servers or computers. The values are not stored by the Macrobond application; only the reference to the Excel sheet where the data is found.

For more information see: Integrating and using external data.

Style sheet

Style sheets are used to save time and produce uniform charts and tables. You can define one or a number of style sheets based on specific presentation preferences, as well as set a default for your account. Applying a different style sheet will automatically update the appearance of charts or tables in Macrobond documents or presentation documents.

For more information see: Style sheet.

Web publish

Easily publish static or dynamic charts online; on a blog, website, intranet or on social media accounts.

Using a URL or HTML code generated in the application charts, saved to Macrobond servers, can be added to online publications. Dynamic charts are automatically updated to reflect the latest data.

For more information see: Web publish.

Macrobond Viewer – introduction

Introduction

The Macrobond Viewer is an application where users can view charts created by their colleagues, make stylistic changes to them, and share, export, or create presentations with selected charts.

Purpose

The purpose of the Macrobond Viewer is to facilitate the work of distributing research done in the main Macrobond application. Viewer users have read-only access to research in the form of presentation documents and a chart library which they can view, share and present.

The following list summarizes what can be done with the Macrobond Viewer:

  • View presentation documents and charts created in the main Macrobond application, which are always updated with the latest data
  • Copy chart and paste to Office as embedded charts that can be updated
  • Export charts as PNG or SVG files
  • Make temporary stylistic changes to charts
  • Use Watchlist to track recent or scheduled data changes

Viewer Activities

The tabs along the left-hand side of the Viewer are called activities. In the following sections, we’ll go through each activity available in the Macrobond Viewer.

Library

The Library activity is the core of the Macrobond Viewer. In this tab, you will see the Library directory on the left-hand side. Here, you’ll find all the documents which have been saved in the library folder by your colleagues who use the main Macrobond Application.

Clicking on a document will open it on the right-hand side. If there is more than one chart in the document, you can select which chart to view from the drop-down menu. Presentation documents will be opened in a separate window.

When a chart is opened, you will be able to make stylistic changes to the chart, such as applying style sheets, changing fonts, colors, line widths, ranges on the axes, and adding or removing annotations. Once the changes are made you can export, print, copy, e-mail, or send the chart directly to X.

News

News items from Macrobond, such as data additions and blog posts, can be viewed in this activity.

Watchlist

In Watchlist, you’re able to monitor the last change and next release of data in selected documents.  You can create your own Watchlist items and save them to your personal account. You can also view your company’s watchlist items and open documents which your colleagues have added to the company watchlist.

Style sheets

In the Style Sheets activity, you can view the style sheets in your company’s account and apply them to your charts before exporting them. You can also create your own style sheets and save them to your personal account.

Accessing Documents

The main access point for documents and charts in the Viewer is the Library account.

You can browse through files saved in:

  • Library;
  • Macrobond chart library.

You can open and view files saved in:

  • Library;
  • Macrobond chart library;
  • Macrobond charts saved on Department account sent to you as a link, email attachment or in Presentation document;
  • your company’s Watchlist charts saved on Department account.

You cannot open charts from Company account unless they are referenced in a Presentation document on Department account.

You can also send links to documents (i.e., in emails, on Teams) and include linked documents in Power Point files.

Accessing SQL database

It is possible to access your company's SQL database from Viewer, but first you need to establish connection. The process is same as in Macrobond main-app. Please obtain from your company a Configuration File, username & password and apply them as described here. Then, you can fully view documents that utilize SQL series those through Viewer.

Technical requirements

The technical requirements for the Macrobond Viewer are the same as for the main Macrobond application. These are outlined here.

Note: It is not possible to have both the Macrobond Application and the Macrobond Viewer installed on the same computer at the same time. Keep in mind that a Macrobond Application account can be used for both the Application and the Viewer, but a Viewer account can only be used to log into the Viewer.

Installing the Macrobond Viewer

Macrobond Viewer has its own installation file. You can find it with all instructions here: Installation Viewer

Watchlist – overview

Keep track of when important documents and particular time series are scheduled for data updates

See the latest changes and next releases

Under Overview you can see a list of all the monitored documents, and sort it relative to the last change or next release.

Display additional information

Clicking on an item displays the document and allows you to access relevant information, such as who created the item, time series metadata, shortcuts for the Macrobond document, as well as related resources that you have defined.

Quick access to your related resources

Add links to related Macrobond documents or any external files that are relevant to the monitored item. For example, Excel, PowerPoint, or Word documents.

With all this information gathered in one place you’ll be one click away from running the necessary calculations or changing the comments in a cyclical presentation or report.

Items tab

Create folders for Watchlist items

Organize items into related groups to get an overview of all the documents you are watching and to facilitate the search and navigation between them.

For more information see: Watchlist.

Analytics – overview

Manipulate and present data using a range of analyses from the most fundamental to the advanced

With a workflow from left to right, Analytics is composed of three main elements:

The series and document browser

  • Select data to work with from any of the data sets in the application
  • Use the filtering and sorting options available to simplify your selection
  • Select documents to work with
  • Search through databases (available since version 1.28)

The analysis tree

  • Organize and view the calculations and presentations applied to the data in the document
  • Access the list of data that has been added to the document (Series list)
  • Apply one or a sequence of calculations to the data in the series list, seen below

The Presentation pane

  • Define and adjust how the manipulated data is displayed using the tools in the command bar

Working in Analytics

Watch below presentation for a hands-on example of:

  • Finding and adding data
  • Applying a simple analysis

For more information see: Analyzing data.

Browse – overview

Quickly and easily find, compare, and visualize time series from the database

As the name suggests, this activity is optimal for browsing the database. Use it to obtain a cursory view of the data by quickly selecting data to visualize as a simple line chart, table, or report.

Find Key Indicators

The Overview tab is your fast track to finding key indicators. The data displayed here are drawn from a number of different databases in the application. You can browse by country, or by company to access the data in the most relevant groupings.

View specific time series

The Time series tab allows you to go through the full list of databases available in Macrobond and browse the time series as they are organized there.

Shortcuts to data

Favorites tab and Bookmarks tab allows you to quickly see previously marked data or to quickly navigate to relevant node in data-tree.

For more information see: Finding data – overview.

Releases – overview

Track, view and calendarize scheduled data updates from sources

View past and coming scheduled releases

To narrow down the list of releases you can define the following parameters:

  • Regions
  • Time period
  • Data type
  • Source (in Filter tab)

Which series are updated?

By clicking on a release, you can view a list of the main series updated for that release. This is true for all past releases, as well as for upcoming key releases.

Working with series found in releases

To work with a series, select it from the list and use the command bar to choose from the available actions.

Filter tab

In the Filters tab you can select predefined filters, enabling you to display only certain Regions, Sources and Releases. They can be combined if needed, to further narrow down the displayed list of Releases.

Regions tab

In the Regions tab you can select certain Regions to narrow down the displayed list of Releases.

For more information see: In Releases activity tab.

Search – overview

Use keywords to search the entire application database for time series

With the Search activity tab you can search the database for all kinds of data.

The search will return results for series that have titles or descriptions matching the search keywords or phrase. Select the series, you want to add to the document, by holding down the Ctrl or Shift button.

To make use of the data, click on one of the Actions ribbon > Add to document.

You can also use the list of predefined filters and combine them, if needed, to narrow down your search results or use Quick filters based on series metadata (this feature is available since MB 1.28) or use common Operators.

For more information see: In Search activity tab.

Start – overview

The home page of the application

See here pre-1.28 version view


From Start tab you’ll have quick access to:

Left pane:

  • Recent documents - a list of your most recently used, or pinned documents.
  • Document changes - [Document changes, Watchlist alerts] - shows information when document in a subscribed folder was changed and alerts from Watchlist tab.
    For further reading on how to set these notifications see (Note that filters where added in version 1.28.):

  • Additional datasets - [My datasets, Available datasets] - We have integrated certain commercial data providers into the application. Here you can see what you have and what is available. (This feature is available in Macrobond 1.28 and later.)
    • Green: you have a full access to the datasets
    • Grey: you do not subscribe to this content yet
    • Green & Grey: you partially subscribe to the dataset listed

Right pane:

  • Blog, Chart of the week, News - a feed of the latest updates about new application features, articles and data; also posts from our blog and Chart of the week feature.
  • Help/Training materials -  in the right bottom corner you may find links to user guides and support options