- Overview
- Creating new style sheet
- Saving style sheet
- Editing style sheet
- Applying style sheet
- Sharing style sheet
Overview
Creating a style sheet is not difficult to do, but it can take a bit of time. You can always reach out to your account manager if you’d like help setting up a style sheet.
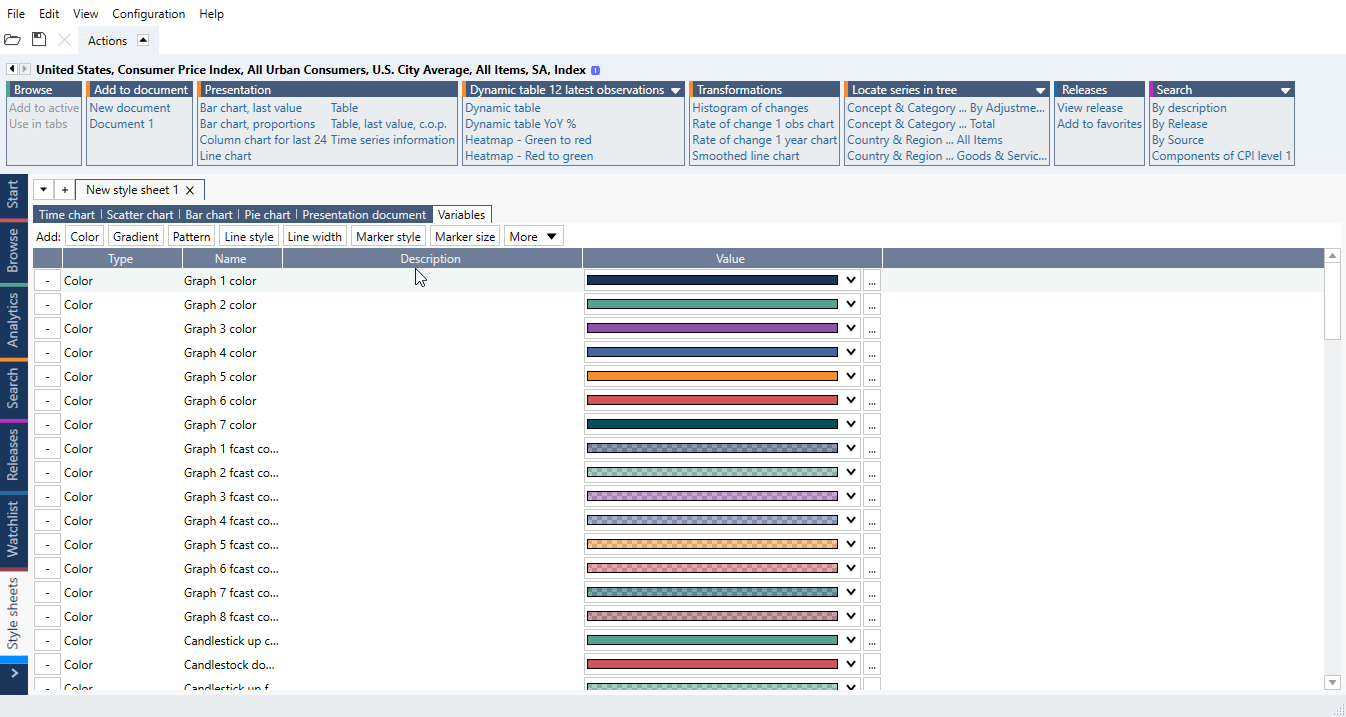
With Variables tab you can apply same color/setting to elements in all chart types.
Creating style sheet
Create new
To create a new style sheet, open the Style sheets activity tab and click the ' + ' sign.

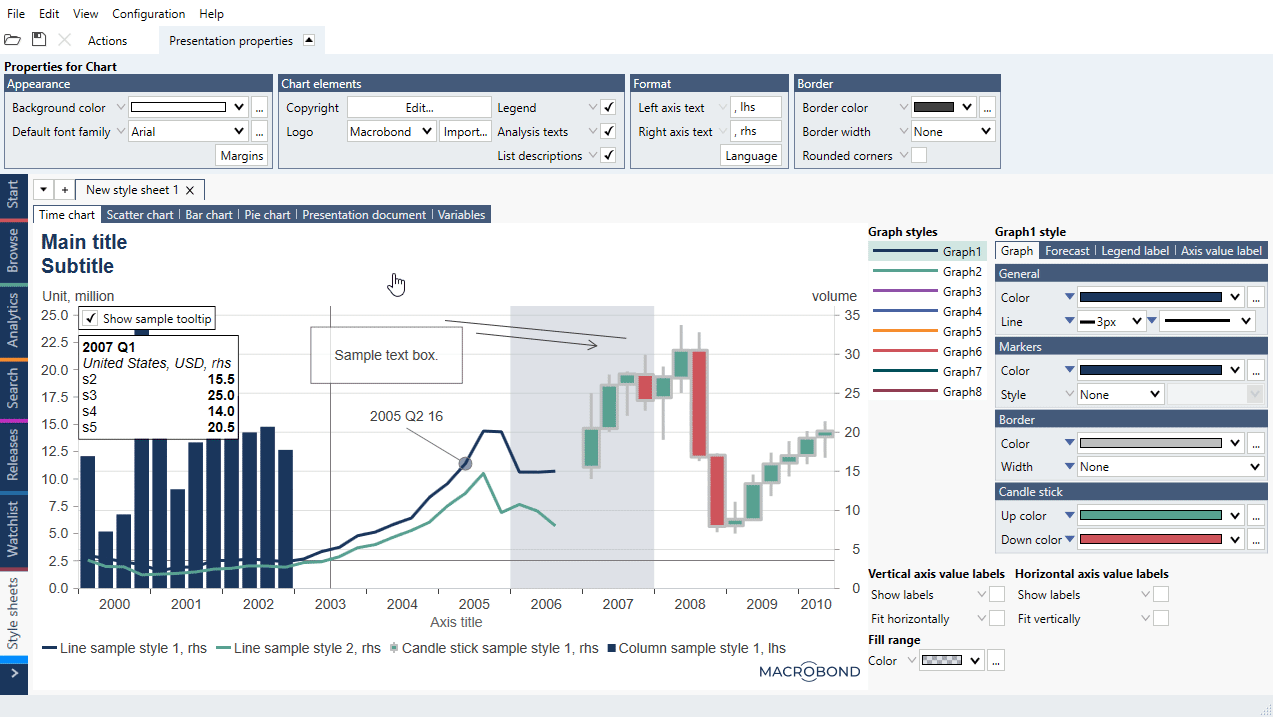
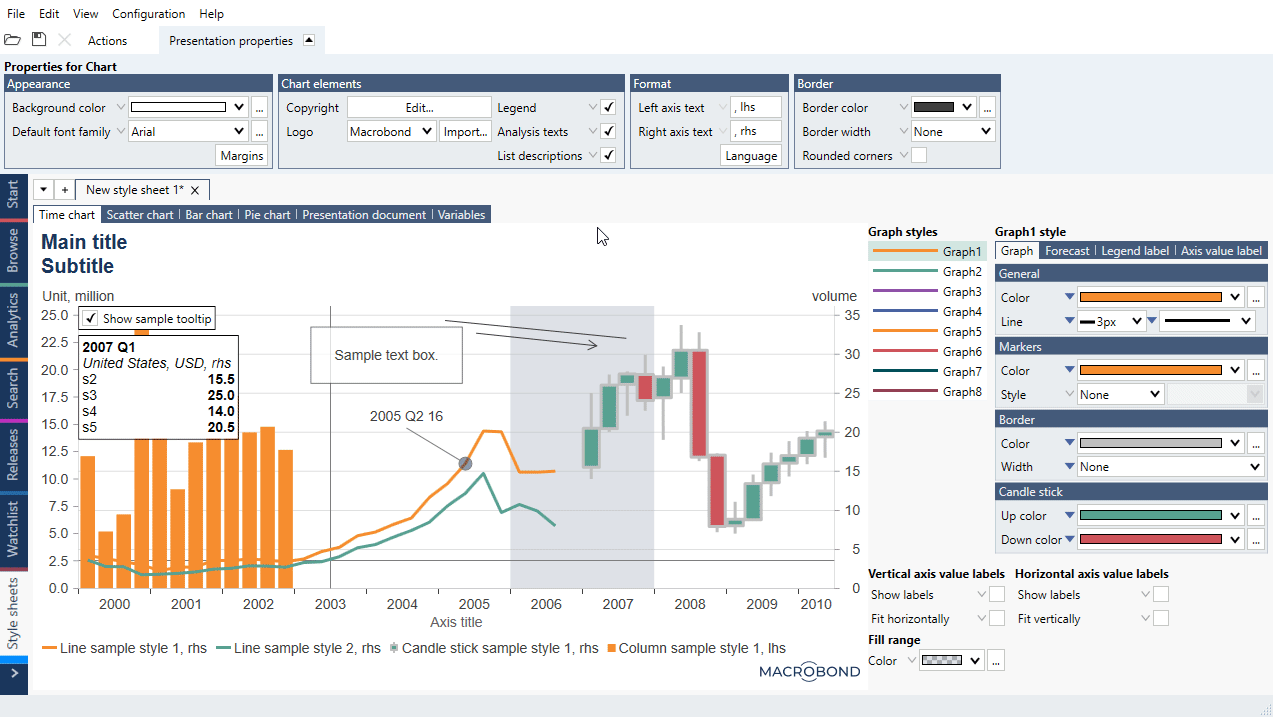
Graphic's settings
There is a tab for each chart type where you can click and edit elements similarly to how you would in a chart in Analytics. Click on an element and see available options.
You can do it for each chart type separately. Under Variable tab you can control same elements in all chart types.

See here pre-1.30 version view
Fixed chart size
This feature is available in Macrobond Analysis 1.30 and later.

Since version MB Analysis 1.30 you can control the graph size to fit to your publication requirements. Chart size will be applied together with other graphic's settings.
Dynamic text in Style sheet
Pointing to a specific series (i.e.; s1, s2, s3...) while preparing Style sheet won't work properly. For example, {s s1.Date} will pick up Date from that specific s1 series but when you select it in Style sheet editor main app will remember s1 as 'sample series from editor'. In effect on actual chart it will show <Series not found> instead of a date.
You can point to the Date property of the first series in the chart with {s [0].Date}.
Variables
To help manage graphical elements we have added Variables tab. Changing element here will change same element in all chart types.
Of course you can exclude any element from being connected to Variables setting.
To add more elements to the Variables list click on 'Add:' line or see under More dropdown.
Saving style sheet
Once the charts look how you want them to, you can save the new style sheet by clicking Ctrl + S. You can also open the File menu and select 'Save as'. While saving a style sheet, you can also decide to define it as default for any new chart.
You can share a style sheet with your colleagues by saving it in Department or Company Account.

Saving custom style as style sheet
To move current style to editor, select in upper menu Style sheet > Open in style sheet editor. This will copy the current settings from the chart to the style sheet, however, this method does not copy line settings such as color, thickness, or markers.
For settings in Bar charts, which may have several different configurations within the same chart, like separators between columns and graph area settings, the first relevant column will be used. Graph styles will be copied from the first eight graphs.
Editing style sheet
To see your style sheets:
- go to File in upper menu and select Open.
- use keys Ctrl+O.
- click on an open document icon.
 Click on one and press 'OK'.
Applying style sheet
To apply the style sheet in the Analytics activity, make sure that the chart you would like to change is selected in the analysis tree. Then, open the style sheet main menu at the top and select the name of the style sheet you would like to apply. If it's not there press 'Select chart style sheet' to see all style sheets saved on different accounts.

Set as default
You can set your style sheet to appear on each newly created document. Go to any chart, open the style sheet main menu at the top and press Select chart style sheet. In new window select a style sheet and mark at the bottom 'Use as default for new charts'.

Apply to all open documents
Since version 1.31 it is possible to use 'Apply to all open charts'.
Sharing style sheet
Save your style sheet on Department or Company account and whoever has access to those directories can use them too.
You can also send style sheet directly to your colleague. If you save style sheet to 'My computer' it will save it on your machine in mbndt format. To find its directory open Windows' File Explorer and type in directory field:
%appdata%\..\Local\Macrobond Financial\Stylesheets

Your colleague can then open Windows' File Explorer, type in directory field:
%appdata%\..\Local\Macrobond Financial\Stylesheets
and copy there mbndt file you have sent. New style sheet will appear under 'My computer'.