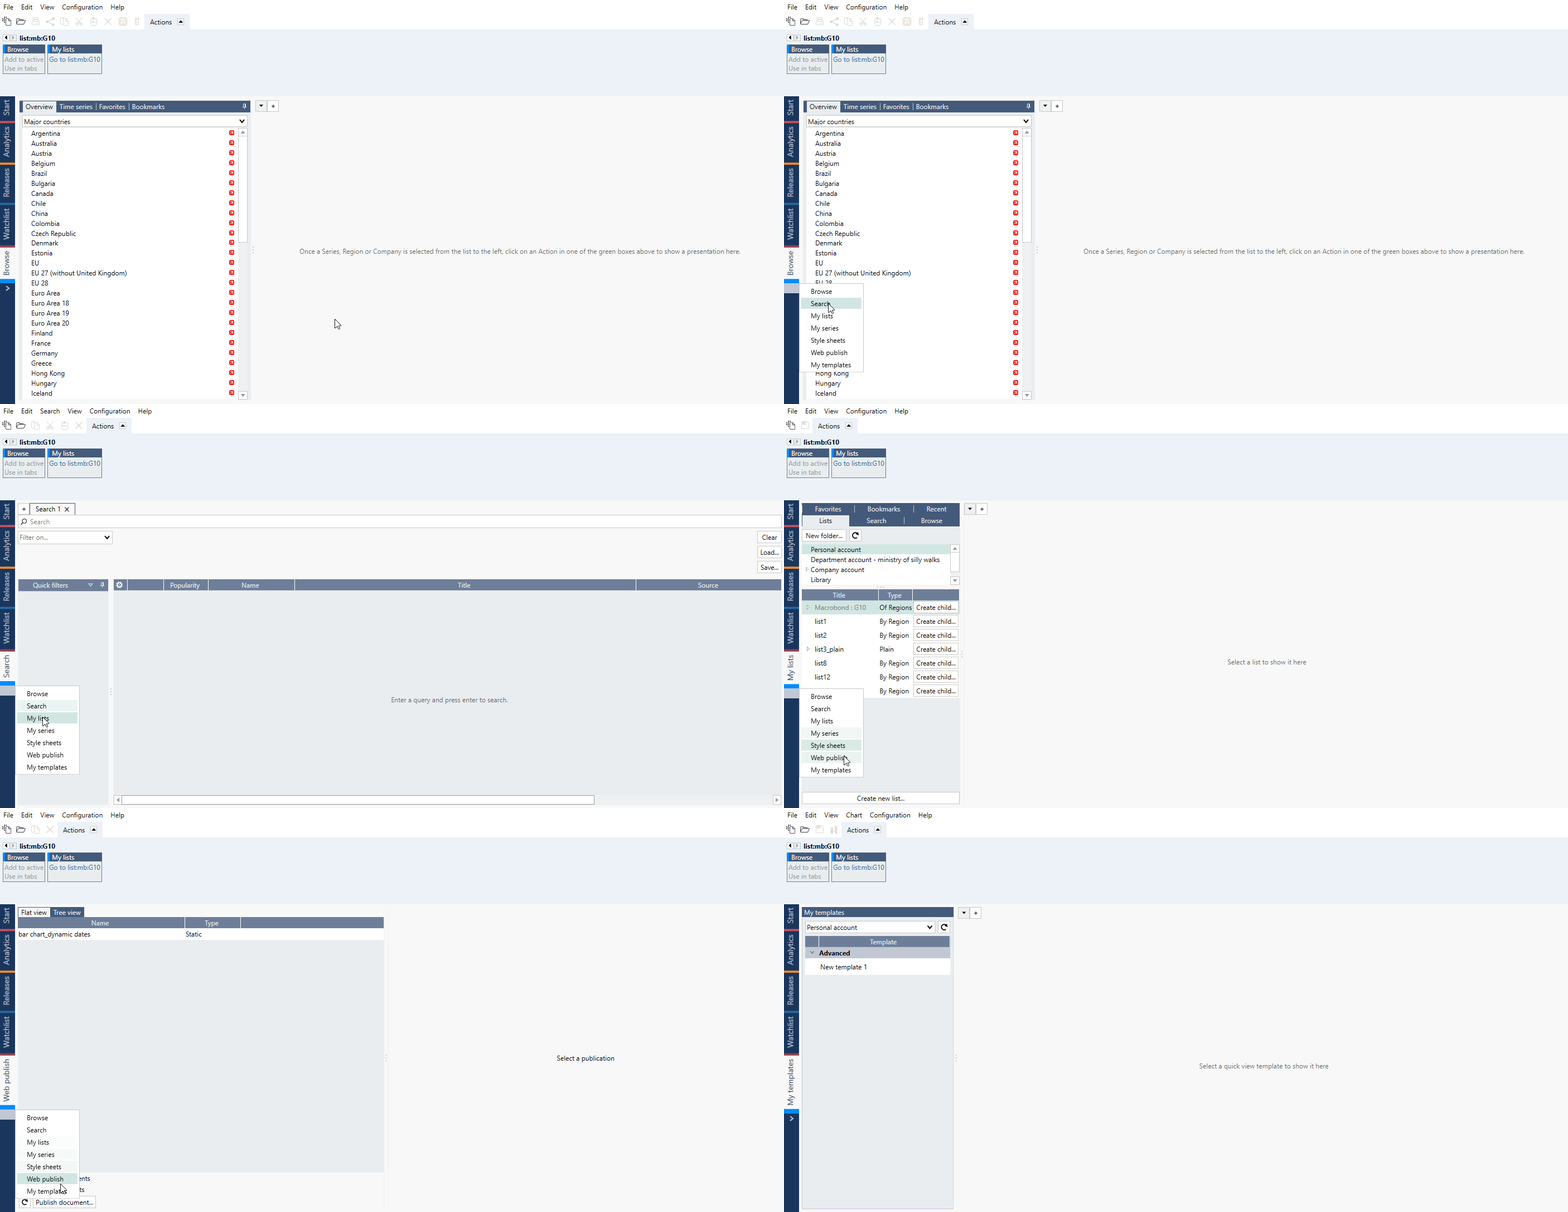
Choose from secondary activities to define the last tab
The activity for the last tab can be changed by clicking on the arrow below it and toggling between secondary activities.
Browse
Selecting the Browse activity allows you to easily find, compare and visualize time series from the database. Browse is particularly effective in making quick and easy comparisons of the same indicators between countries.
Browsing through time series is integrated into Analytics tab.
Since version 1.30 Browse tab’s Overview functions were overtaken by Quick View functionality with addition of My template tab in 1.31.
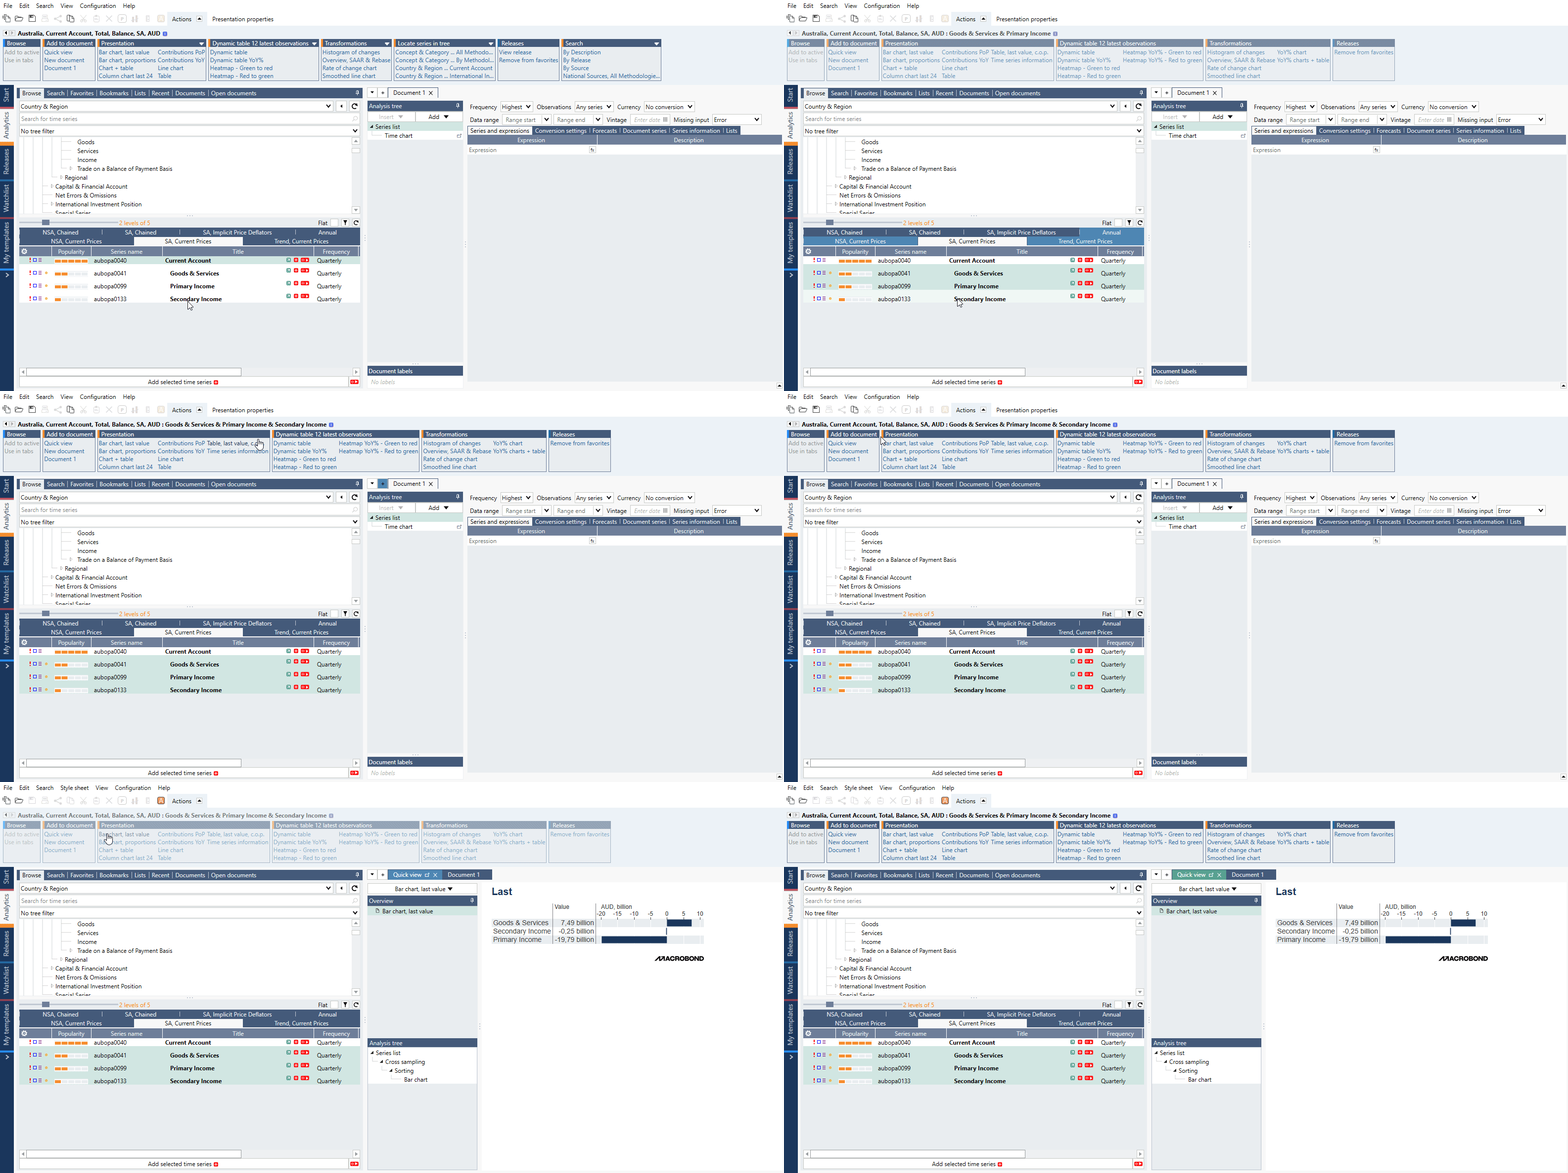
For more see Browse activity tab.
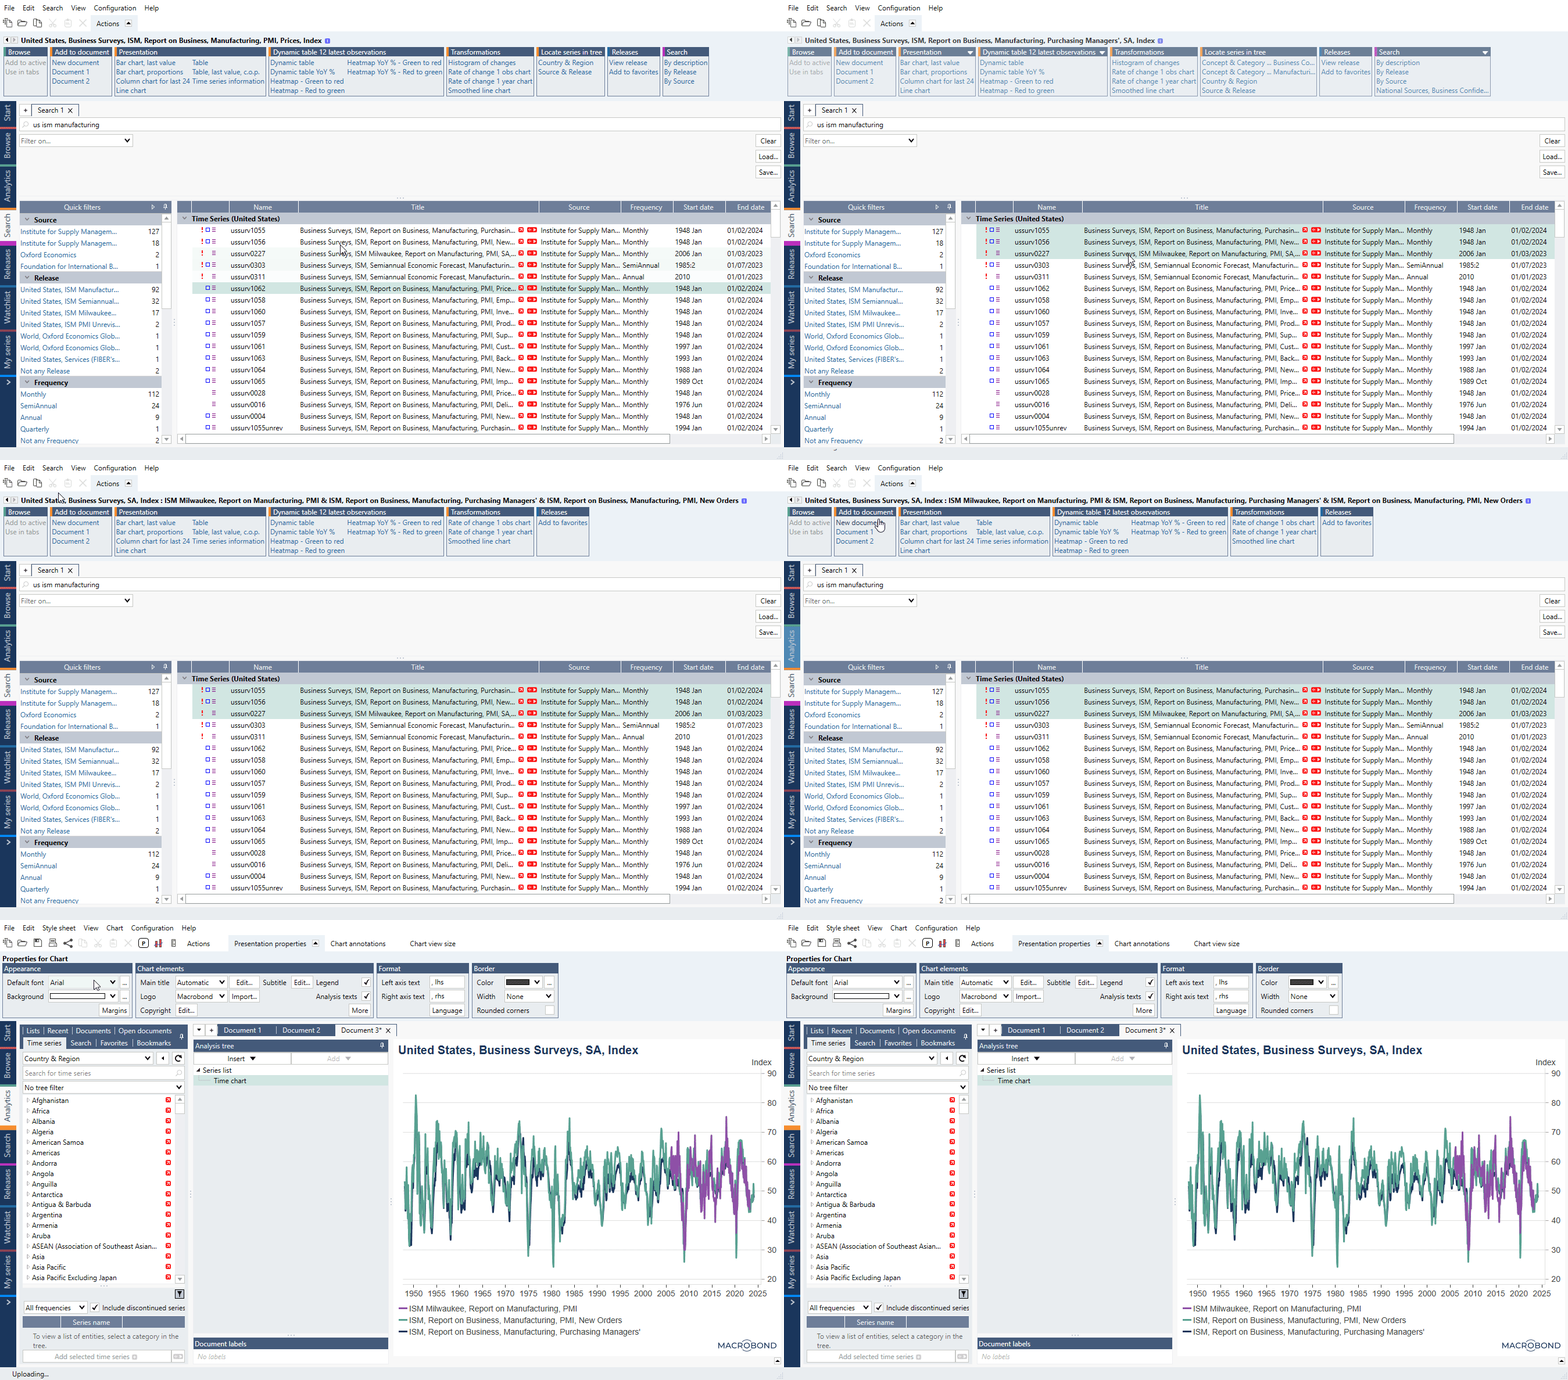
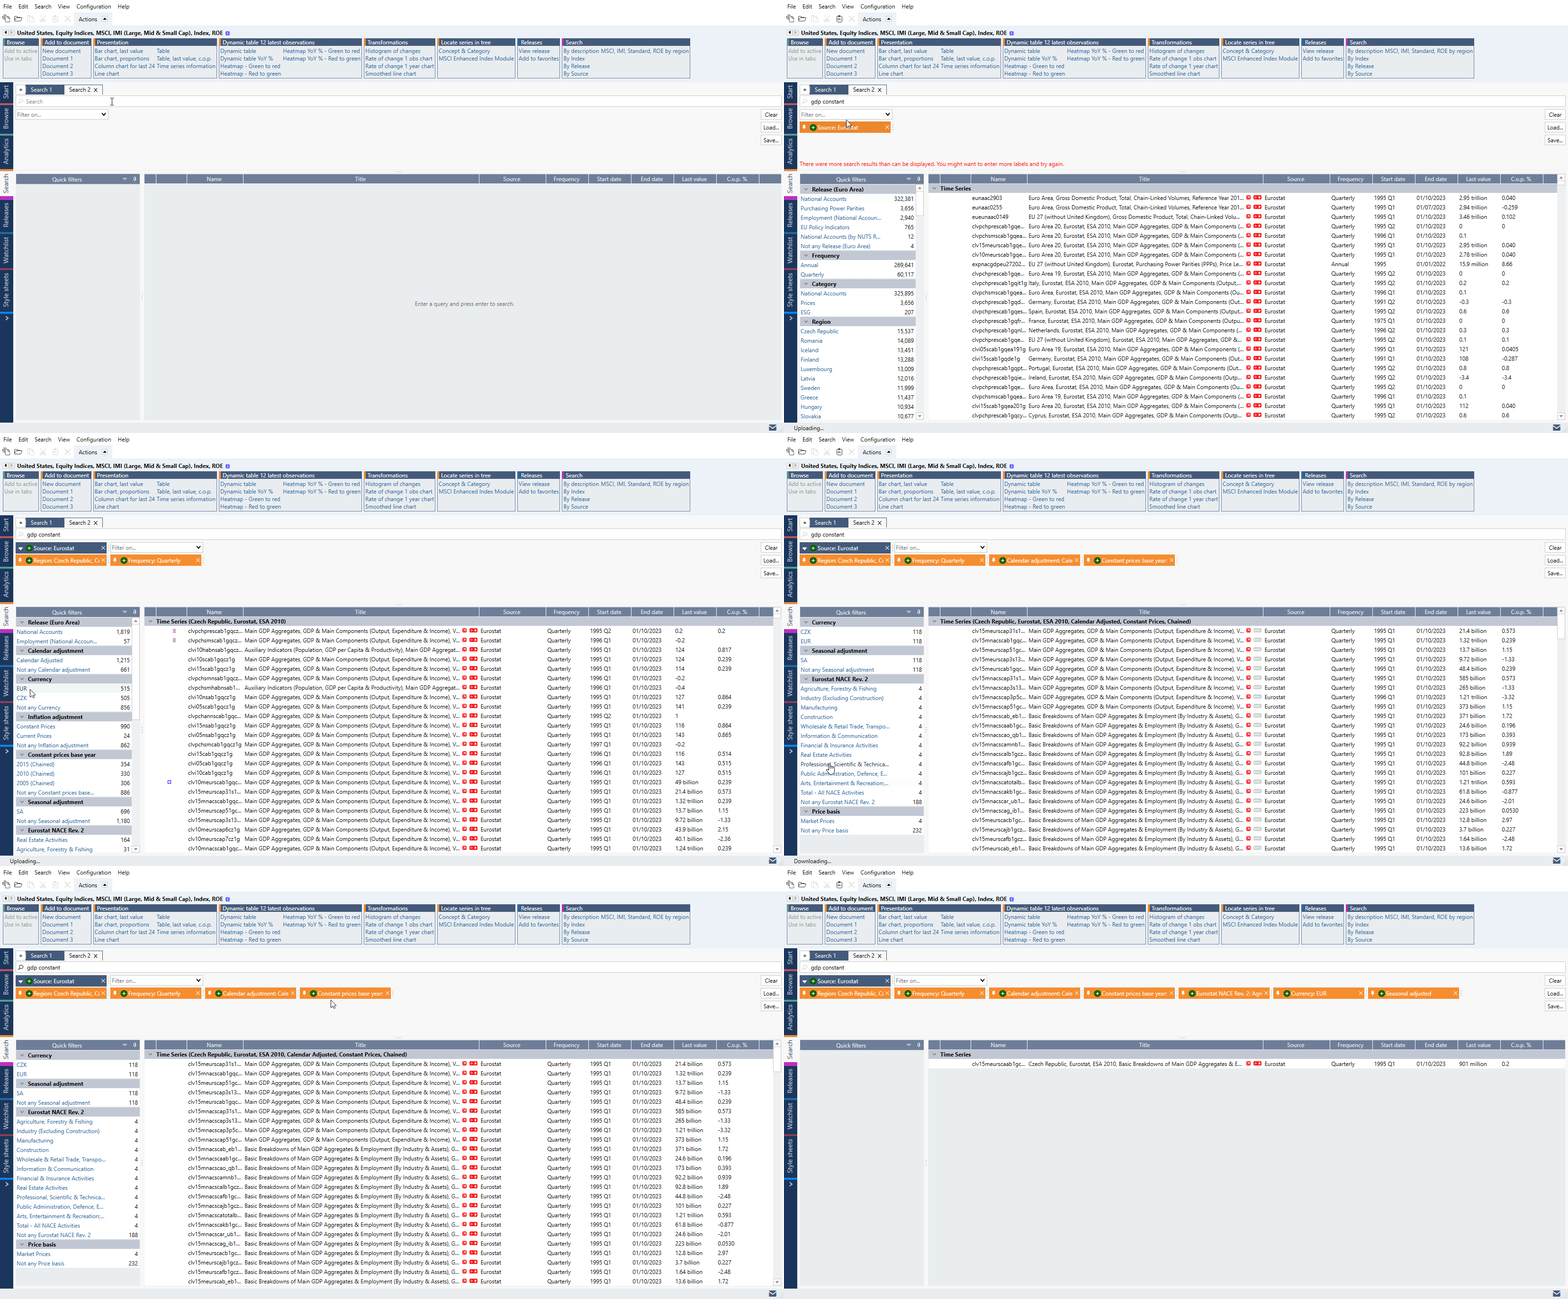
Search
With the Search activity tab you can search the database for all kinds of data. The search will return results for series that have titles or descriptions matching the search keywords or phrase. Select the series, you want to add to the document, by holding down the Ctrl or Shift button. To make use of the data, click on one of the Actions ribbon > Add to document.
You can also use the list of predefined filters and combine them, if needed, to narrow down your search results or use Quick filters based on series metadata or use common Operators.
Search tab is also integrated into Analytics tab. In version 1.31 Search tab was moved under Flexi tab.
For more information see: In Search activity tab.
My lists
You can create List of series or List of regions and use them in analyses or to search for indicators. You can store your lists just like your in-house series - on Personal, Department or Company account. List can then be used in other documents and be shared with your colleagues.
For more information see: My lists tab.
My series
You can store your own time series in the in-house database associated with your Macrobond account. Series can be accessed on any computer running Macrobond, and can be stored in different folders.
There s also a possibility of storing data linked to Excel files stored internally, on your own servers or computers. The values are not stored by the Macrobond application; only the reference to the Excel sheet where the data is found.
For more information see: Integrating and using external data.
Style sheet
Style sheets are used to save time and produce uniform charts and tables. You can define one or a number of style sheets based on specific presentation preferences, as well as set a default for your account. Applying a different style sheet will automatically update the appearance of charts or tables in Macrobond documents or presentation documents.
For more information see: Style sheet.
Web publish
Easily publish static or dynamic charts online; on a blog, website, intranet or on social media accounts.
Using a URL or HTML code generated in the application charts, saved to Macrobond servers, can be added to online publications. Dynamic charts are automatically updated to reflect the latest data.
For more information see: Web publish.
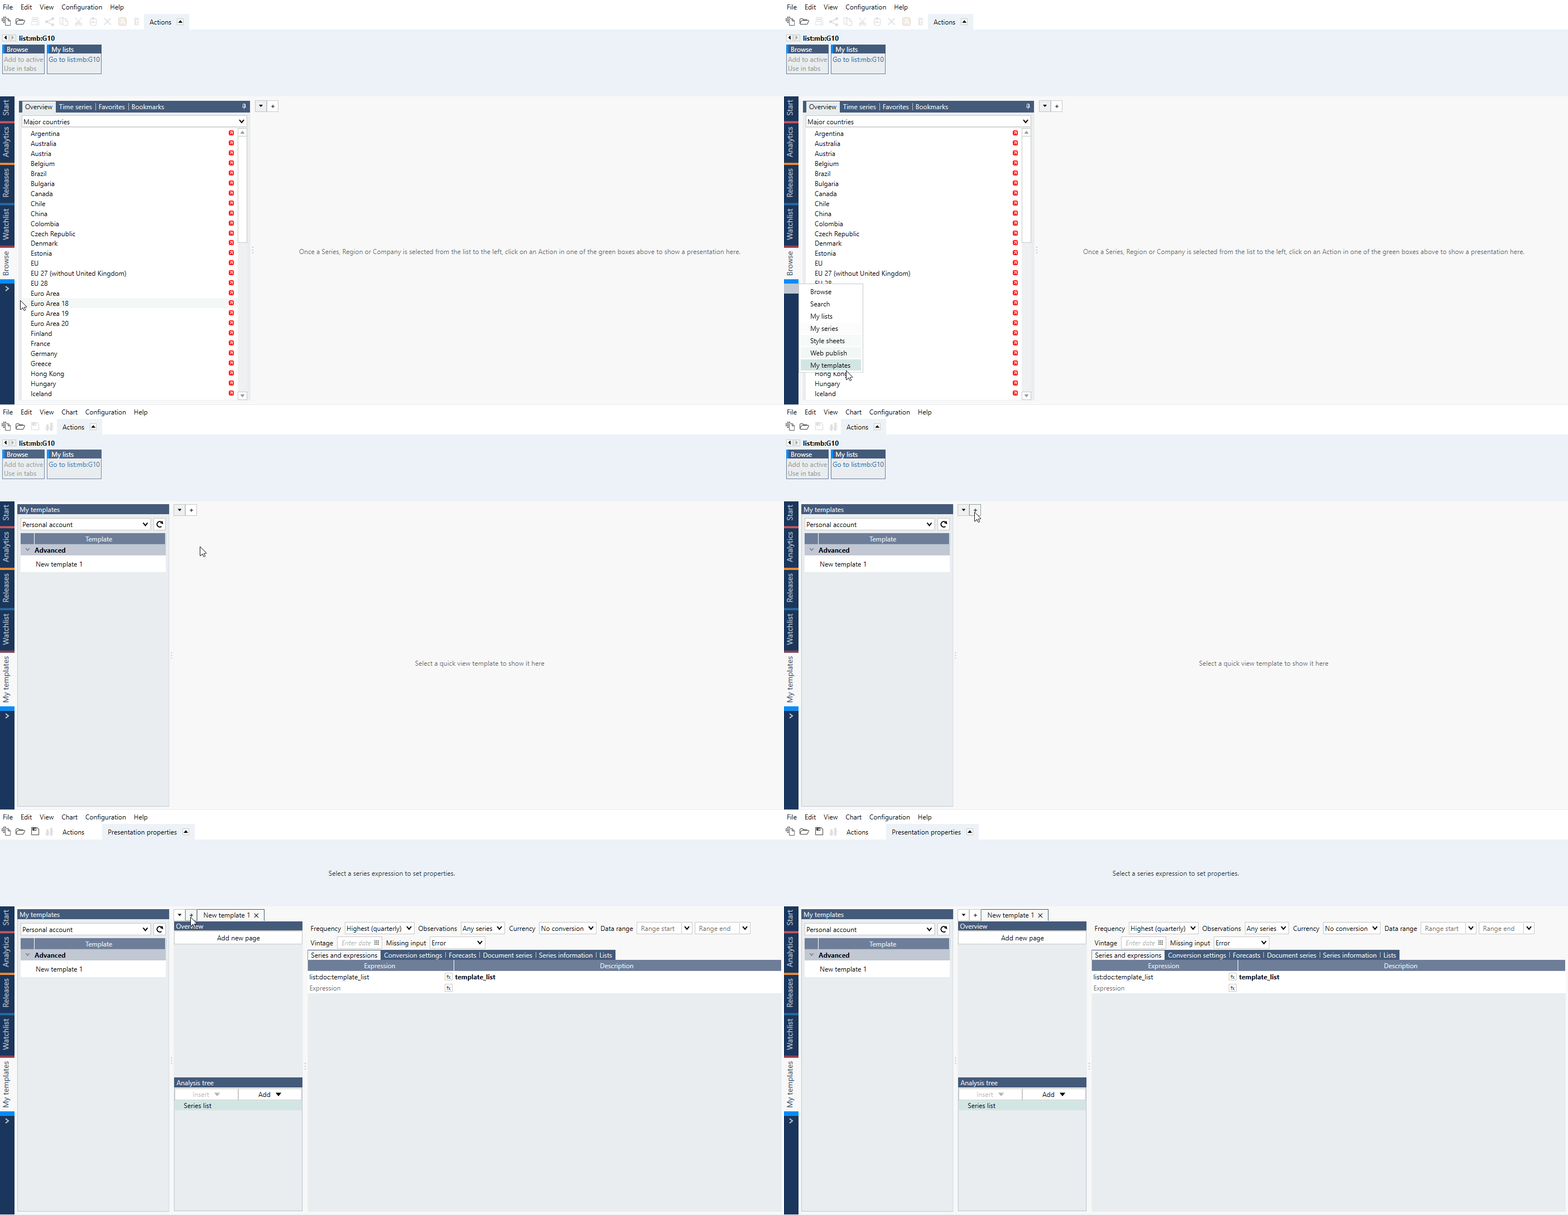
My templates
This feature is available in Macrobond 1.31 and later.
A dedicated activity, called My templates is now available to create your own Quick Views. Quick View was designed to enhance reviewing and comparing series. With My template you can now create your own combinations of calculations, charts and tables. For more information see: Quick view & My templates tab.
