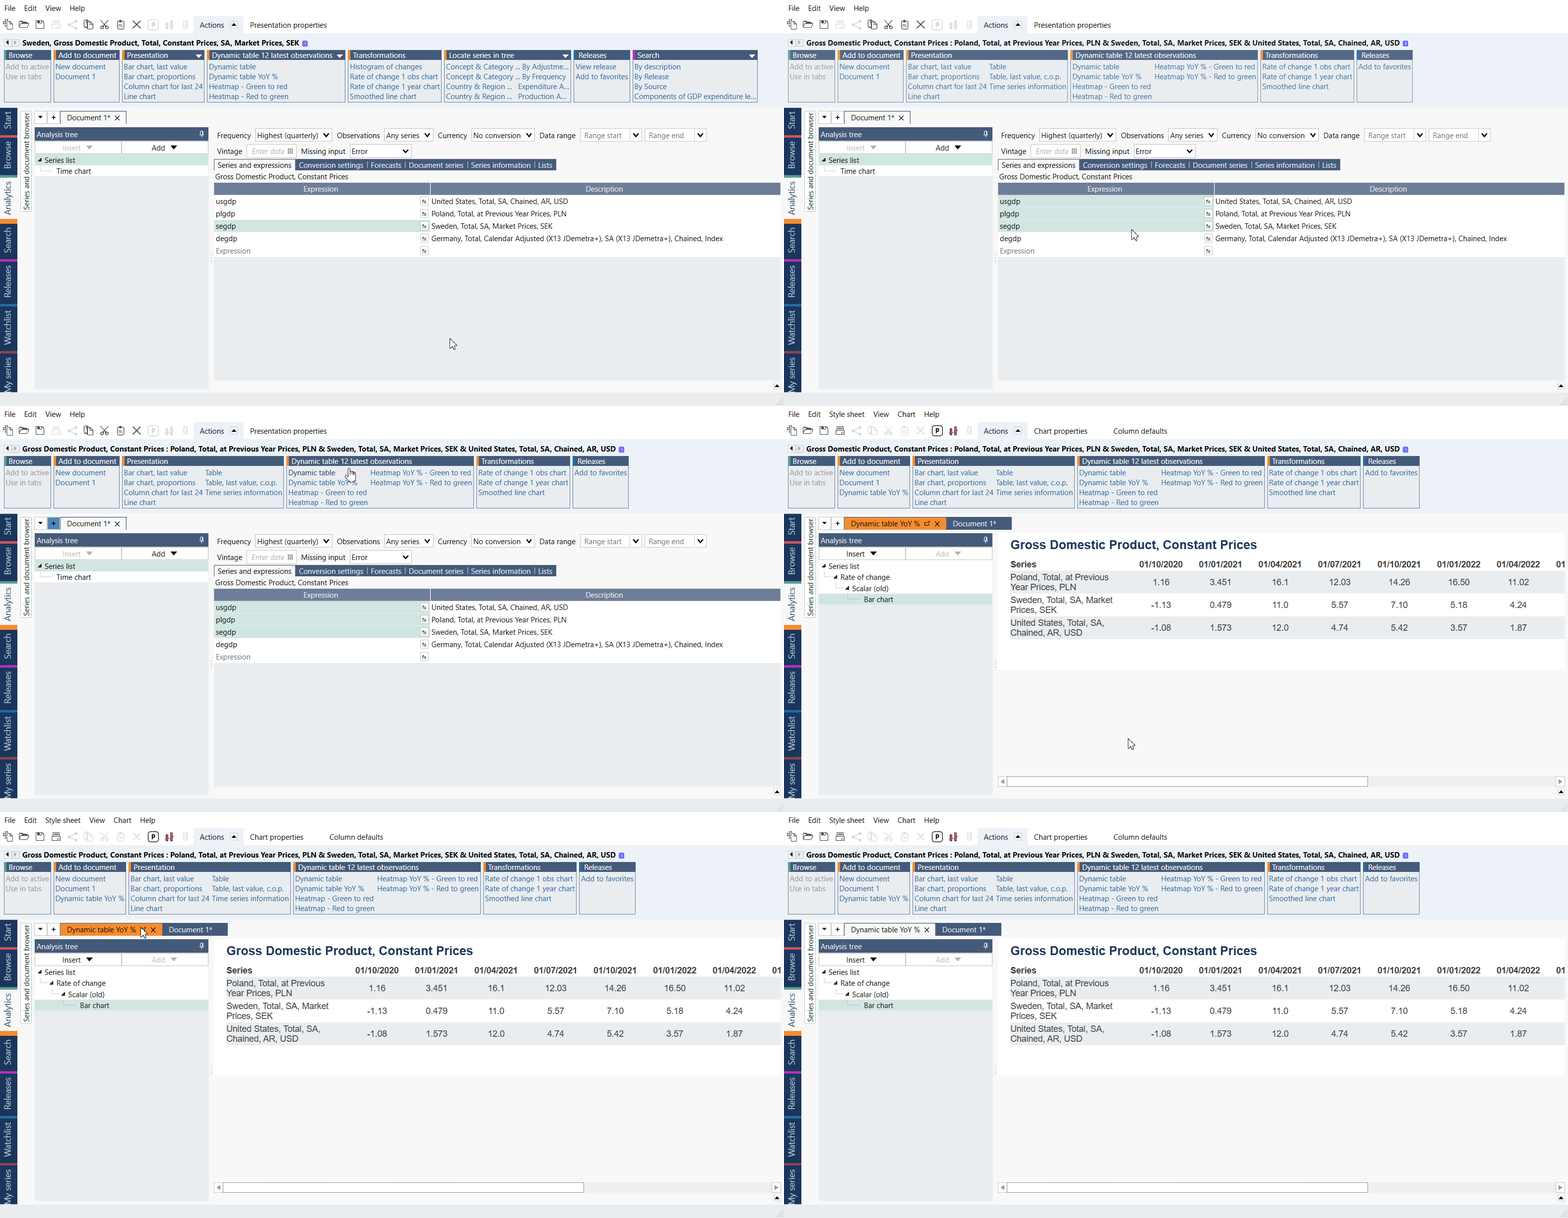
You can create tables as reports, using Bar Charts presentations. The table is created using a bar chart with text columns. Below is an example of what the end result might look like.
How to create a dynamic table?
Shortcut from panel
In Actions ribbon you will find a panel with shortcuts which create dynamic table with latest 12 observations. Mark all series which you want to use and select one of the options:

Build it
- Add the series to Series list.
- Use analysis (i.e., Scalar) to define the calculations or values you’re interested in.
- Add a Bar chart as Presentation, open Graph layout (Ctrl+L).
- Add Text-columns displaying values and text. Each column is a separate 'Text'.
- Drag the output series under the desired column.
How to copy a dynamic table?
To copy such table right-click on it and select Copy Special. You can find more information about it under How to copy a chart to Office document?.
Example
In this example, we calculated Rate of change and then constructed table with text columns.