Skip to content

Macrobond Help

  • Application Overview
  • Q&A
  • User Guide
  • Test your skills
  • Analyses
  • Charts
  • APIs/Feeds/Connectors
  • Technical information
  • Legal
  • Support

Report

Report is automatically generated output from some analyses - it includes relevant statistics and information. Below an example of Report from Histogram:

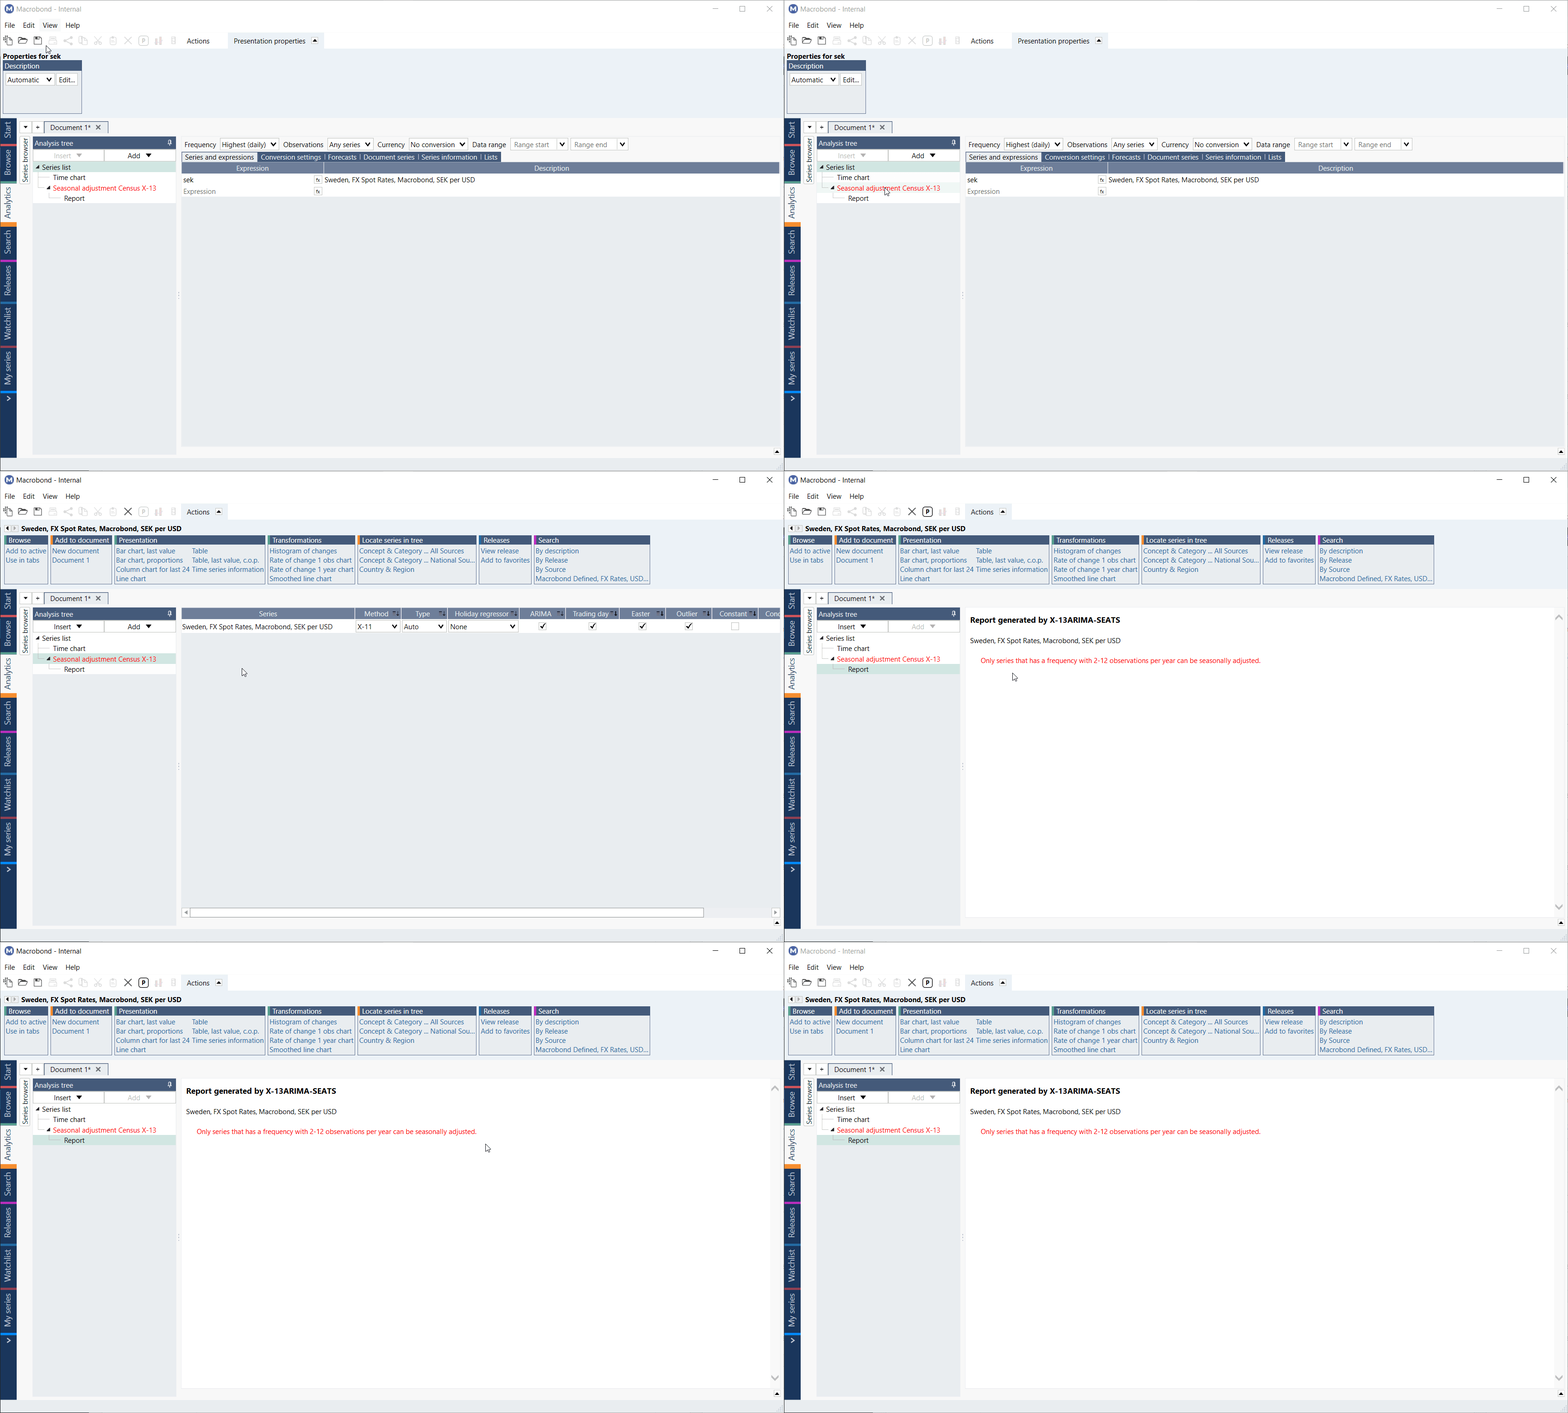
In some cases, like in the Seasonal adjustment Census X-13 analysis, the report will also contain information about error.
As mentioned above, Report output is available only in some analyses, and these are:

Seasonal adjustment Census X-13
Histogram 
Regression
Unit Root Test 
Vector autoregression 
Tags: report

Contents

  • Finding data
  • Analyzing data
  • Charting
    • Charting – overview
    • Displaying data on a chart
    • Types of charts
      • Presentations
        • Time chart
        • Time table
        • Category chart
        • Category table
        • Scatter chart
        • Category scatter chart
        • Bar chart
        • Pie chart
        • Other
          • Matrix
          • Report
      • Graph layout
      • Outside of Macrobond
    • Elements of the chart
    • Style sheet
    • View size
  • Publishing & saving your work

Related material

  • Dynamic table 1 tag related Charting
  • Create reports in Excel 1 tag related MB in Excel
  • How to create dynamic tables for Word and PowerPoint? 1 tag related Publishing & saving
  • Application Overview
  • Q&A
  • User Guide
  • Test your skills
  • Analyses
  • Charts
  • APIs/Feeds/Connectors
  • Technical information
  • Legal
  • Support
Macrobond Help © Macrobond Financial AB