Changing the font and color of the text
Title & subtitle
To adjust the format of your chart’s title, click on it, and open the presentation properties tab at the top of the window. In the appearance group, you can change the text color and font.
Click on the '…' button next to font to select from more fonts and adjust the size.
If you want to re-use the selected font and color for the title of many charts, you can save it as part of a style sheet which you can easily apply to your charts.
Elements
You can adjust the format of your chart’s elements, i.e., axis text, one axis at a time. Click on an axis and open the presentation properties tab at the top of the window. In the appearance group, you can change the text color and font.
Click on the '…' button next to font to select from more fonts and adjust the size.
If you want to re-use the selected font and color for the axis text of many charts, you can save it as part of a style sheet which you can easily apply to your charts.
All text
If you want to change font for all text on chart the easiest way is to create a Style sheet and apply it.
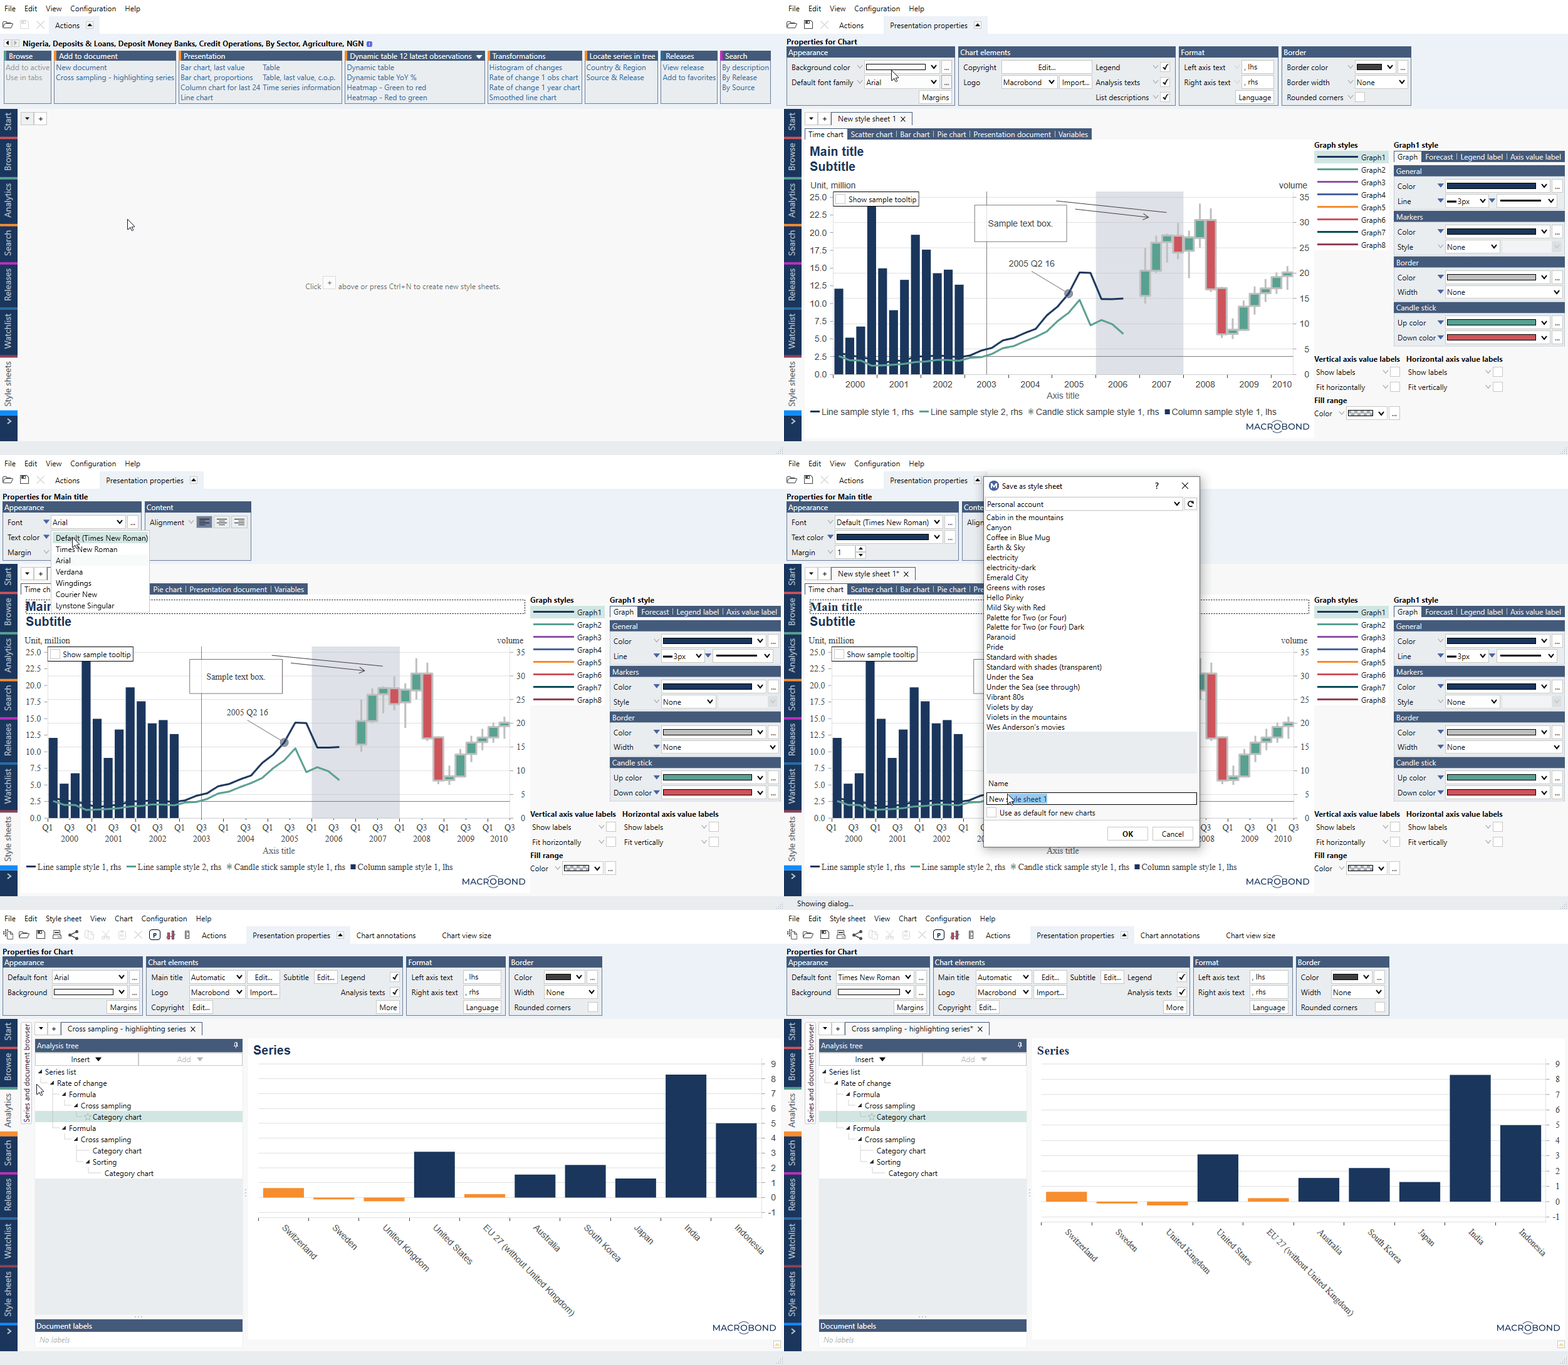
- Go to Style sheet tab, open new with + sign.
- Under Presentation properties > Appearance > Default font family select font.
- If you need, change fonts for Title and subtitle.
- Save style sheet.
- Go back to your chart, from under Style sheet > Select chart style sheet select that style sheet.
Font picker
The font picker window lets you choose the font family, typeface, and size for any selected text in your chart.
You can select to use the default font family. The selection of the default font family is set in one place for the whole chart and can be set in a style sheet.
At the bottom of the dialog box, you will find a preview of the font.
For the font size, you can select the unit as either pixel or points. A pixel here is defined as 1/96 of an inch and point as 1/72 of an inch.
