How to:
- remove the borders from a chart?
- remove the grid lines from a chart?
- remove the margin around a chart?
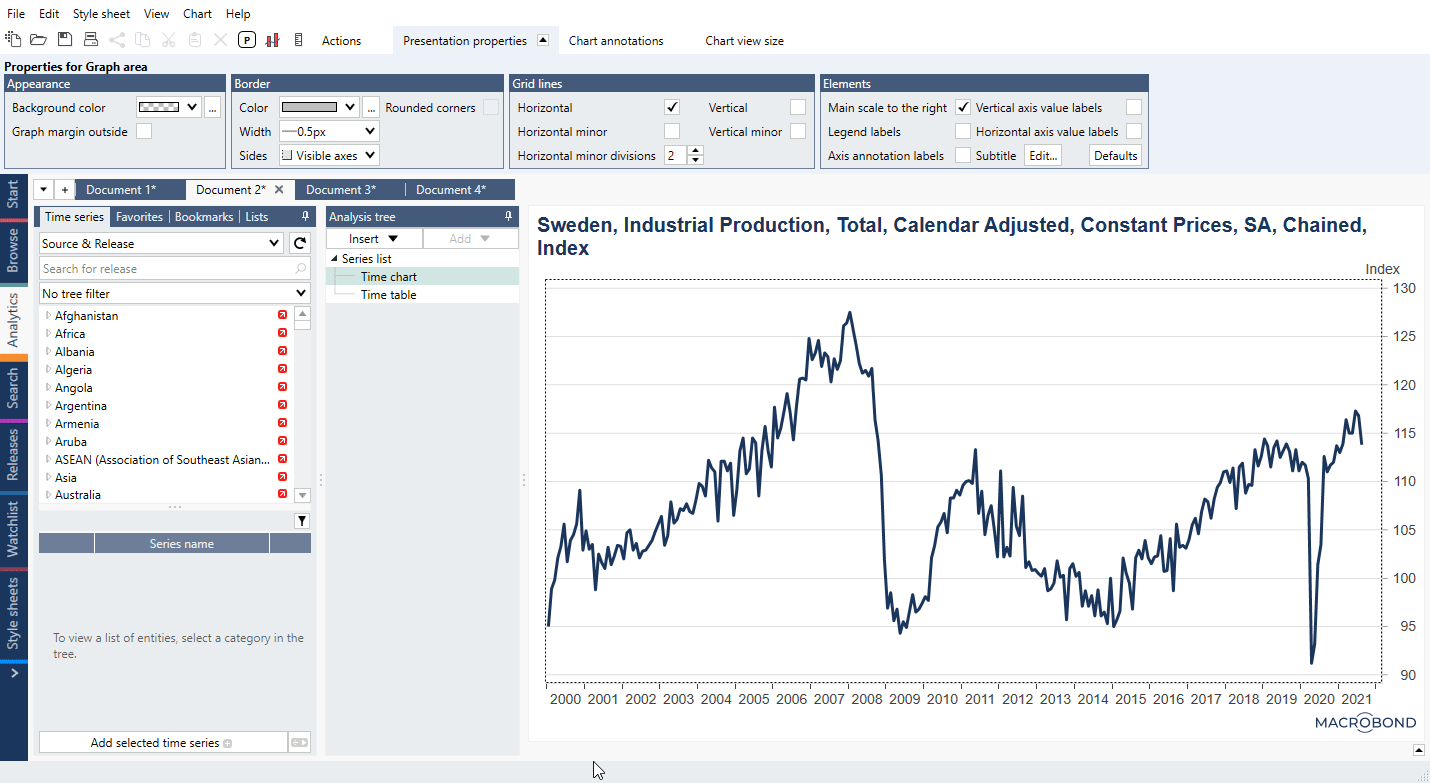
How to remove the borders from a chart?
Click the background of the graph area. In the Border group under the Presentation properties tab, you can adjust settings for the chart border. To remove the border, set the width to “None”.

How to remove the grid lines from a chart?
You can add and remove grid lines from your chart under Presentation properties for the graph area. Click the background of the graph area to access the grid lines group under Presentation properties at the top of the window. Here you can uncheck horizontal/vertical lines.

How to remove the margin around a chart?
Click on a chart and under Presentation properties > Appearance check Graph margin outside. This will remove margin (additional chart area) that ensures graph is not clipped by the upper and lower edge of graph area. Instead, margin will be added to the outside to attempt to avoid clipped or overlapping axis labels.