How to:
- change the color of a series’ graph in a chart?
- change the background color of a chart?
- set the pattern?
How to change the color of a series’ graph in a chart?
Click on the series’ graph and open the Presentation properties tab at the top of the window. In the Appearance group, you can select a graph color from the graph style drop-down list or enable more color options by selecting custom graph style.

How to change the background color of a chart?
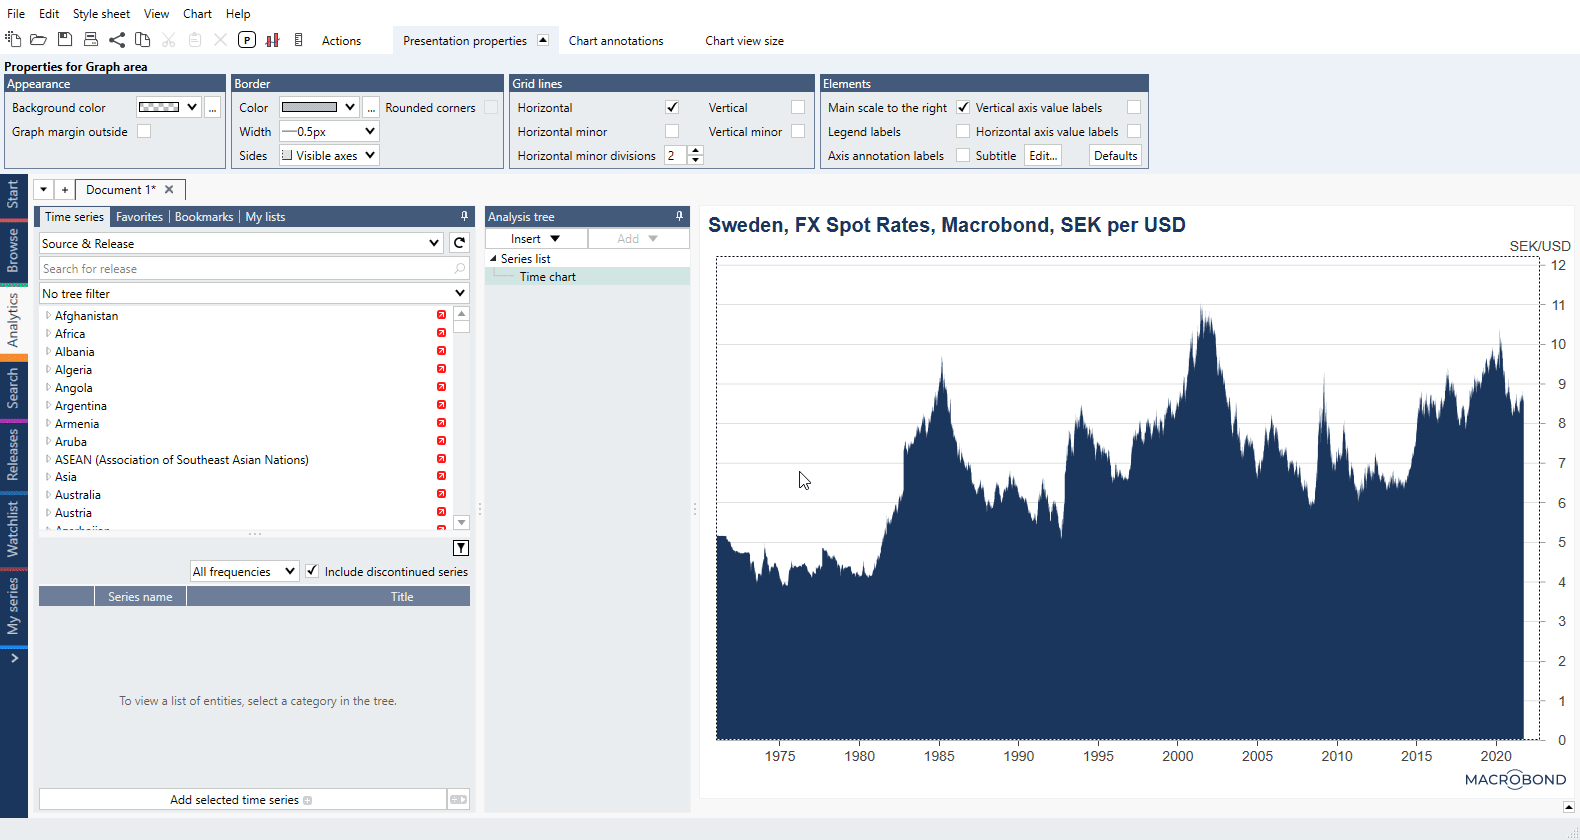
You can adjust the background color of what we call the graph area, the area within the axes where your series are represented.
Click on the graph area background (avoid the graph itself and the grid lines), and open the Presentation properties tab. In the Appearance group, you can select the color from the drop-down list or create a custom color.

If you want to re-use the selected background color often, you can pin it to the drop-down list or save it in as part of a Style sheet that you can easily apply to your charts.
How to set the pattern?
Select graph type where you can use pattern, for example Area charts. Click on area, open color's editor, and select pattern.