Overview
Tooltip appears when you hover over any point. They contain information about point-in-time, description, value and (optional) title.
Color and style settings
All the colors and style settings can be controlled through Style sheet functionality. Go to Style sheet tab, assign new settings to tooltip, save style sheet and use it on your chart.
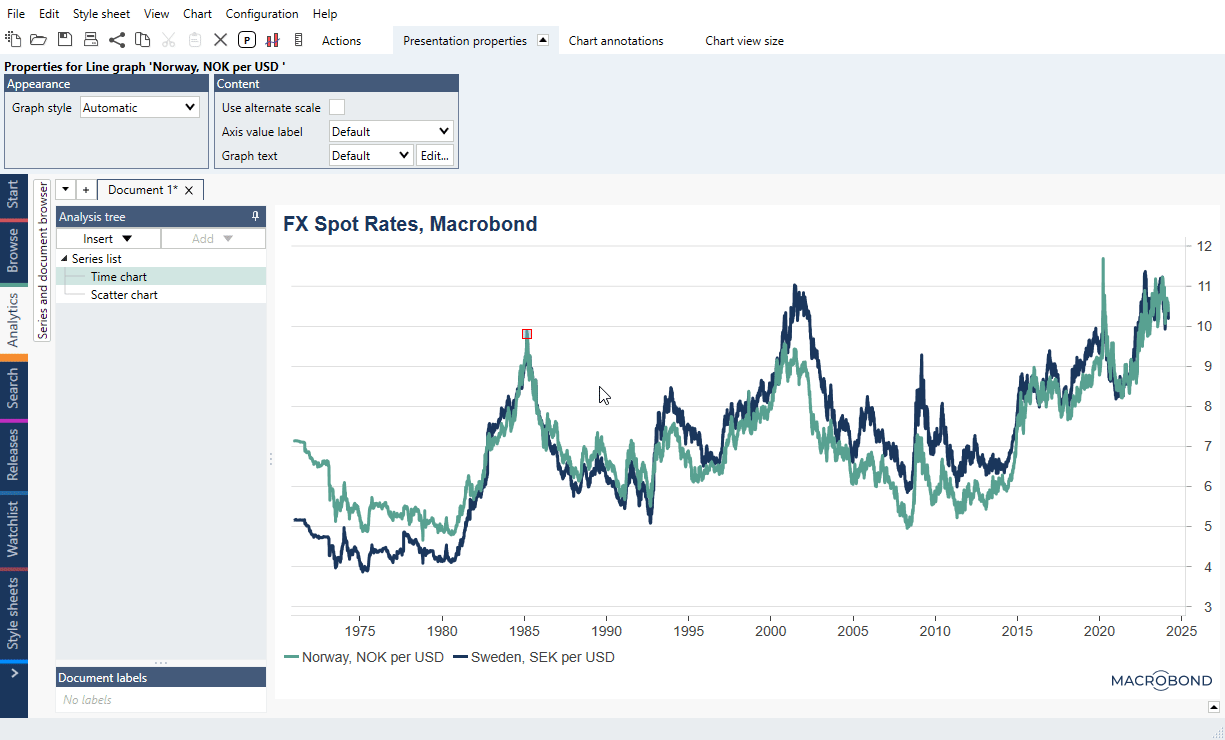
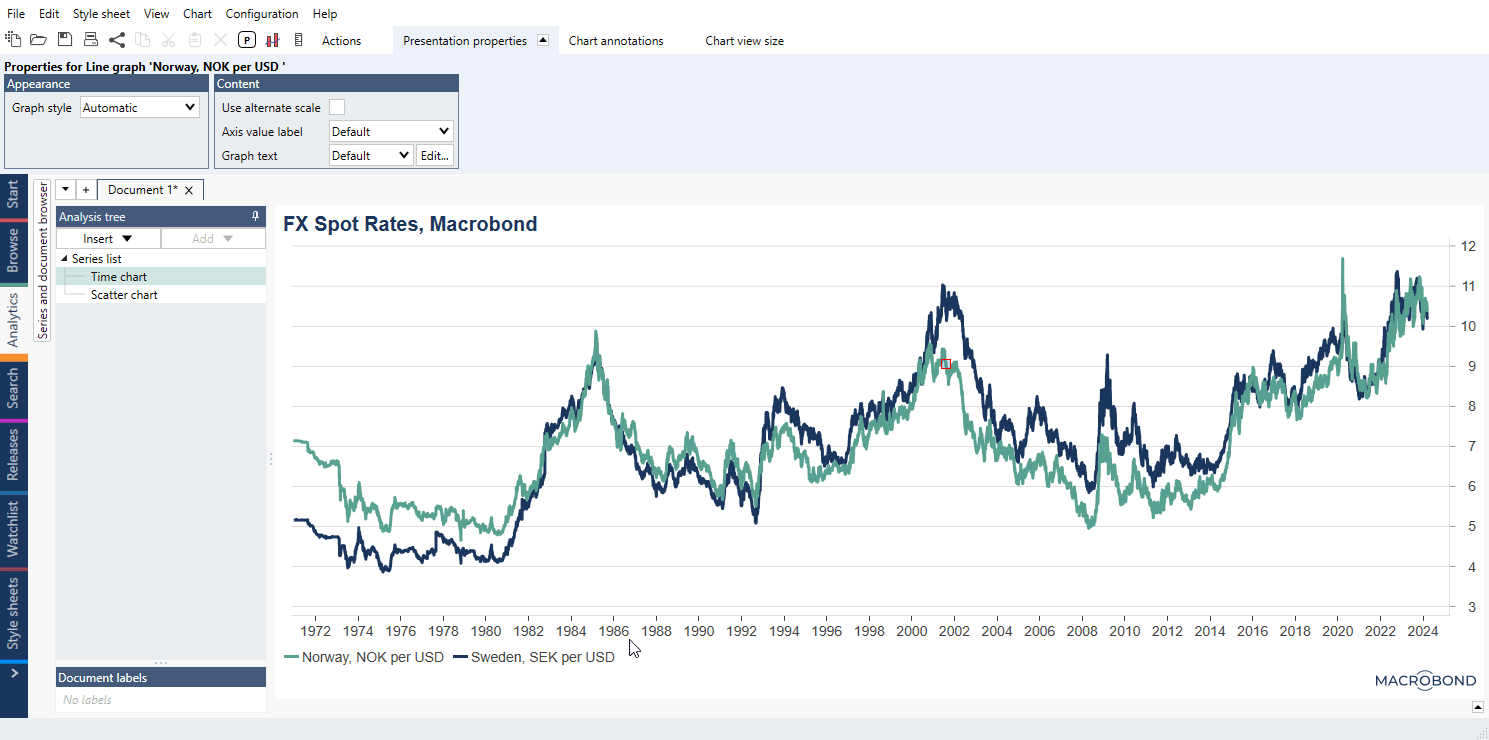
Note, currently Tooltips are available only for Time charts and Scatter charts.

Tooltip
on charts
Tooltips are available only for Time charts and Scatter charts. You can have different setting for each of chart type. 'Title' is the common title i.e., for a group of series like on Scatter chart.
on SVG
Tooltip will be added automatically. Under File > Export image or video > Format: SVG you have an option to disable showing tooltip or animation (before Macrobond Analysis 1.29 you can enable it).
For more information see Animated charts.