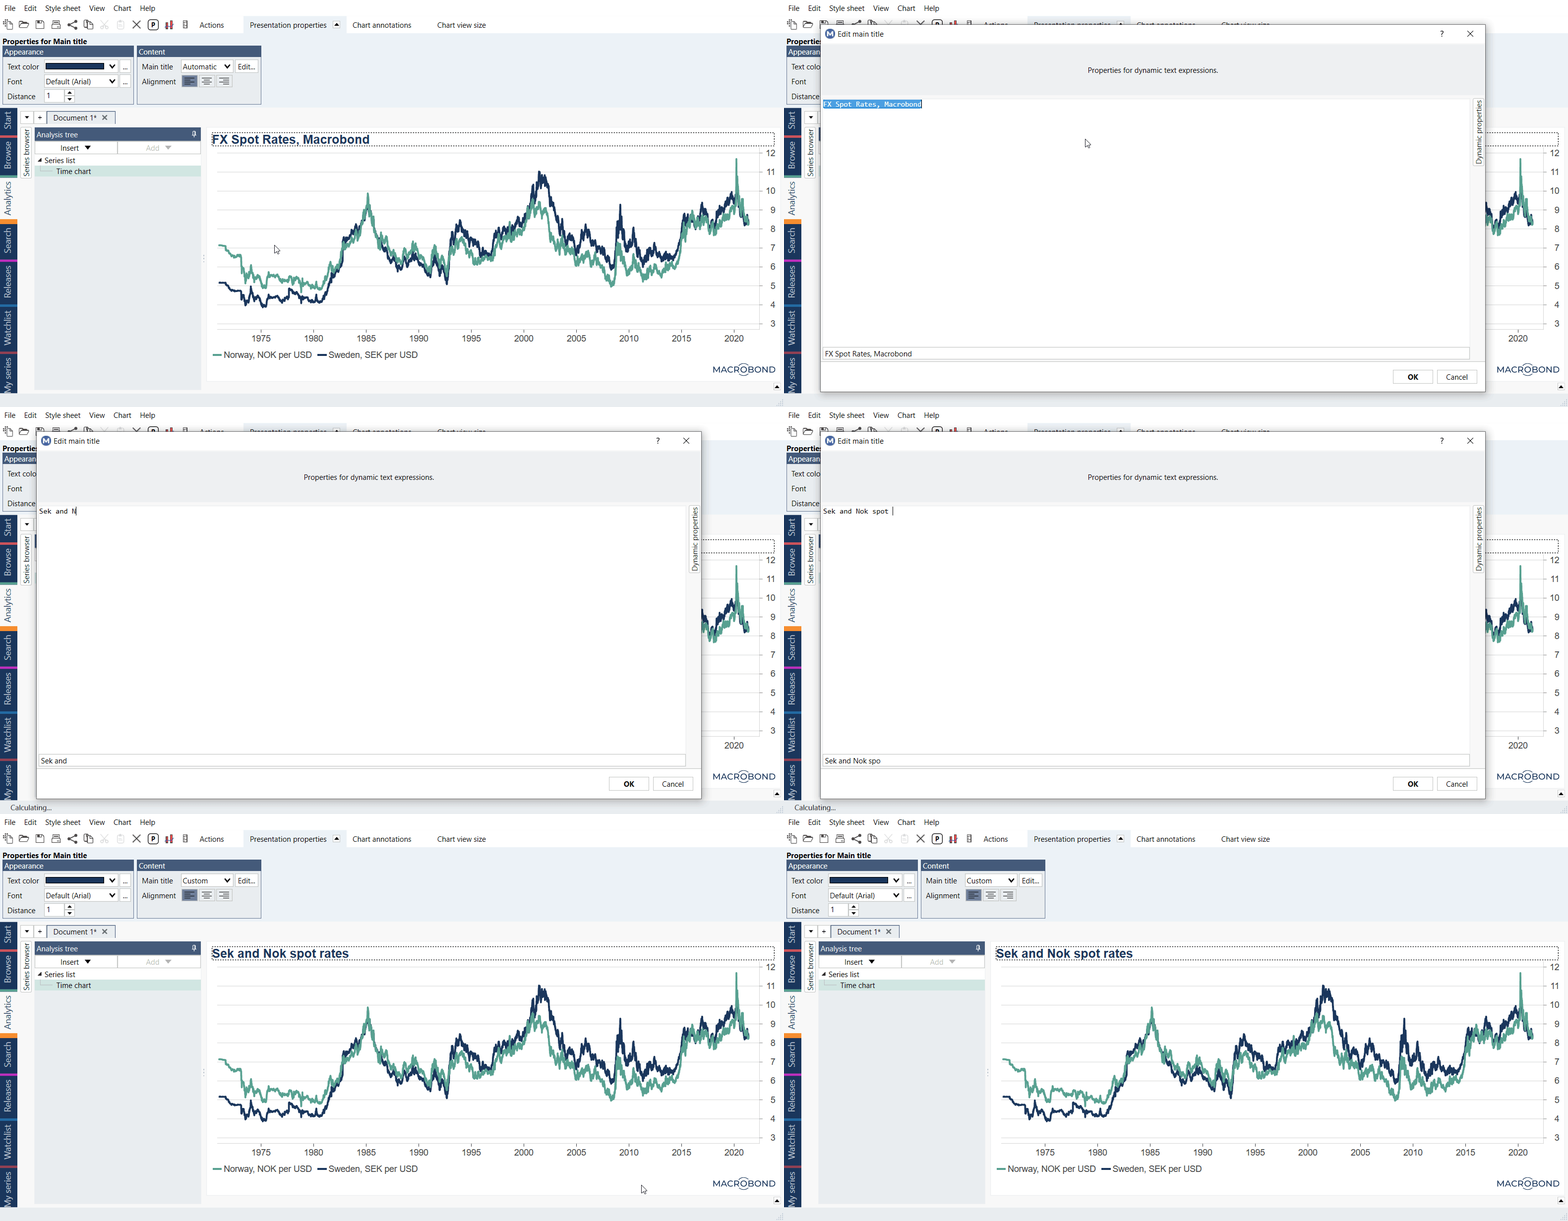
It is possible to edit almost any text in Macrobond, to do this you need to double-click on an element you want to edit.
How to:
How to edit the title of chart?
There are two main ways to add title for chart/graph:
- The easiest way is to double click on the title and edit the text in the window that opens up.

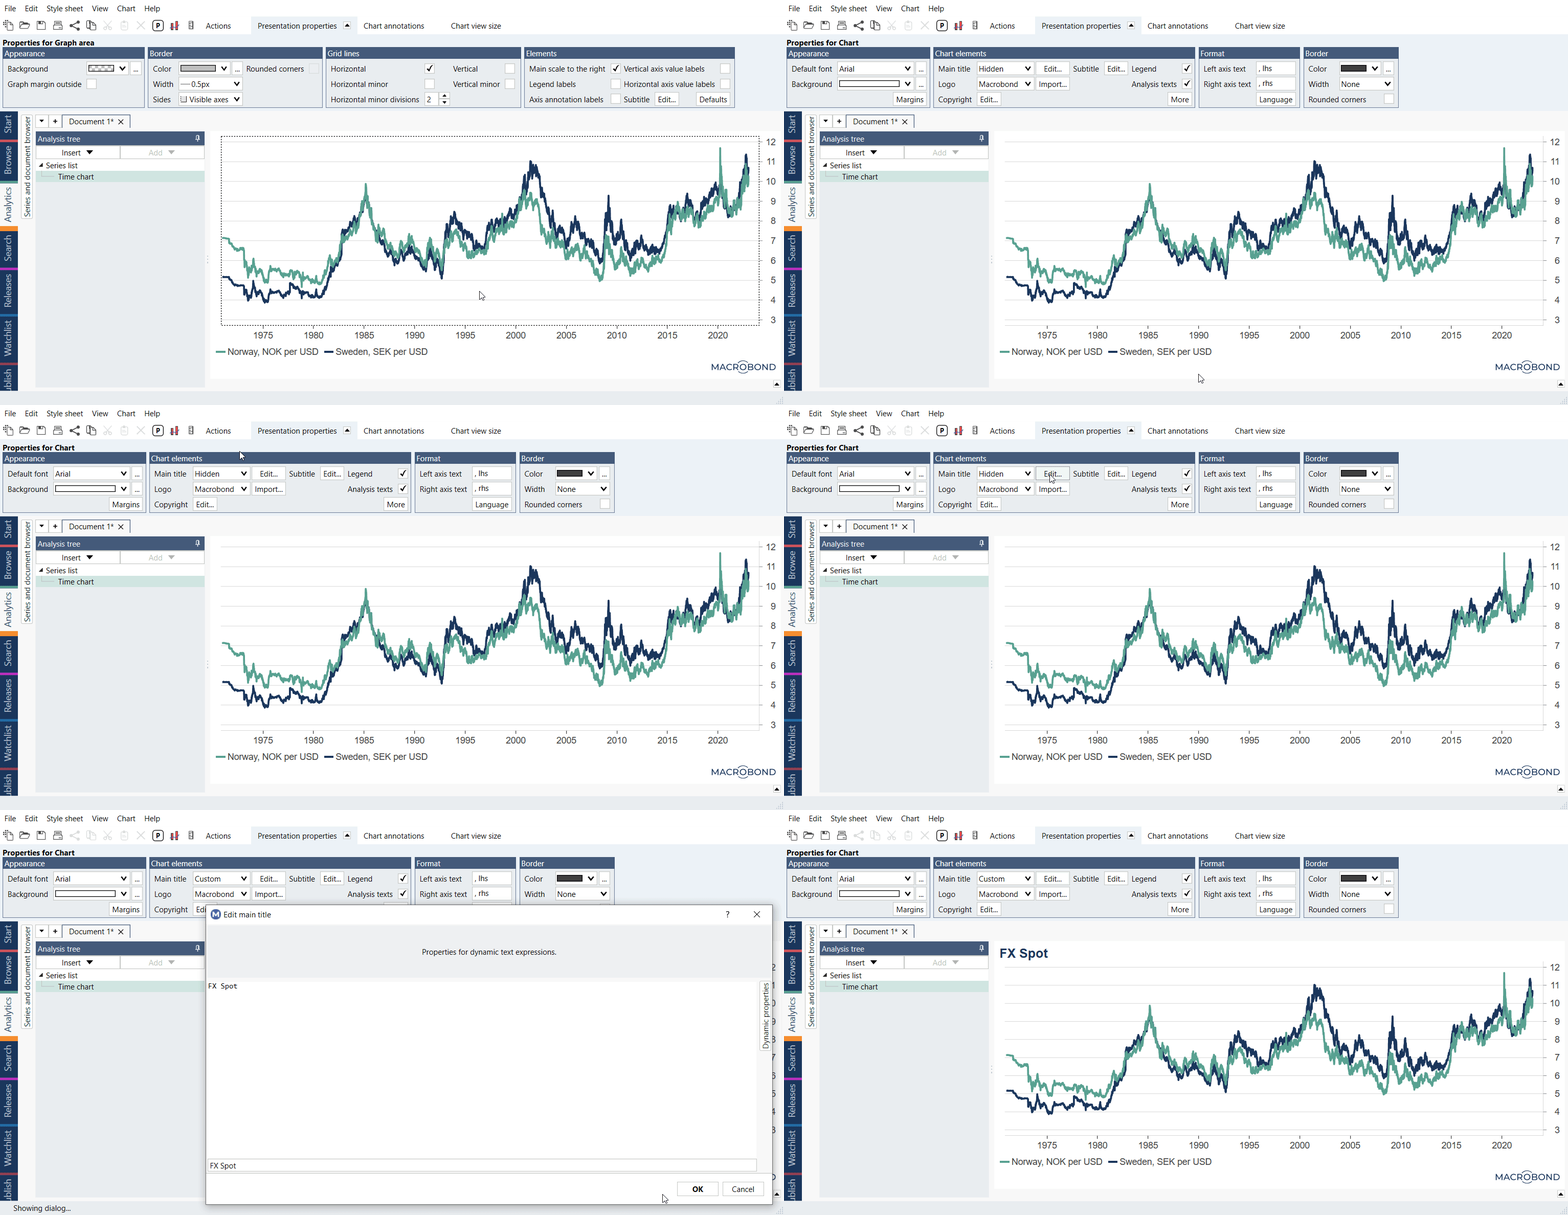
- If you do not see a title to double-click on, you can edit the title under the chart's presentation properties.
- Click anywhere on the white area around the chart.
- Open the presentation properties tab.
- In the Chart elements panel, next to 'Main title' click on 'Edit'.

Under 'Main title' there's edit button for a 'Subtitle' element if you wish to add it. When editing the title, as with any text element, you can add a dynamic text. ,Find more information on dynamic text here: Dynamic Text
How to edit the source text on a chart?
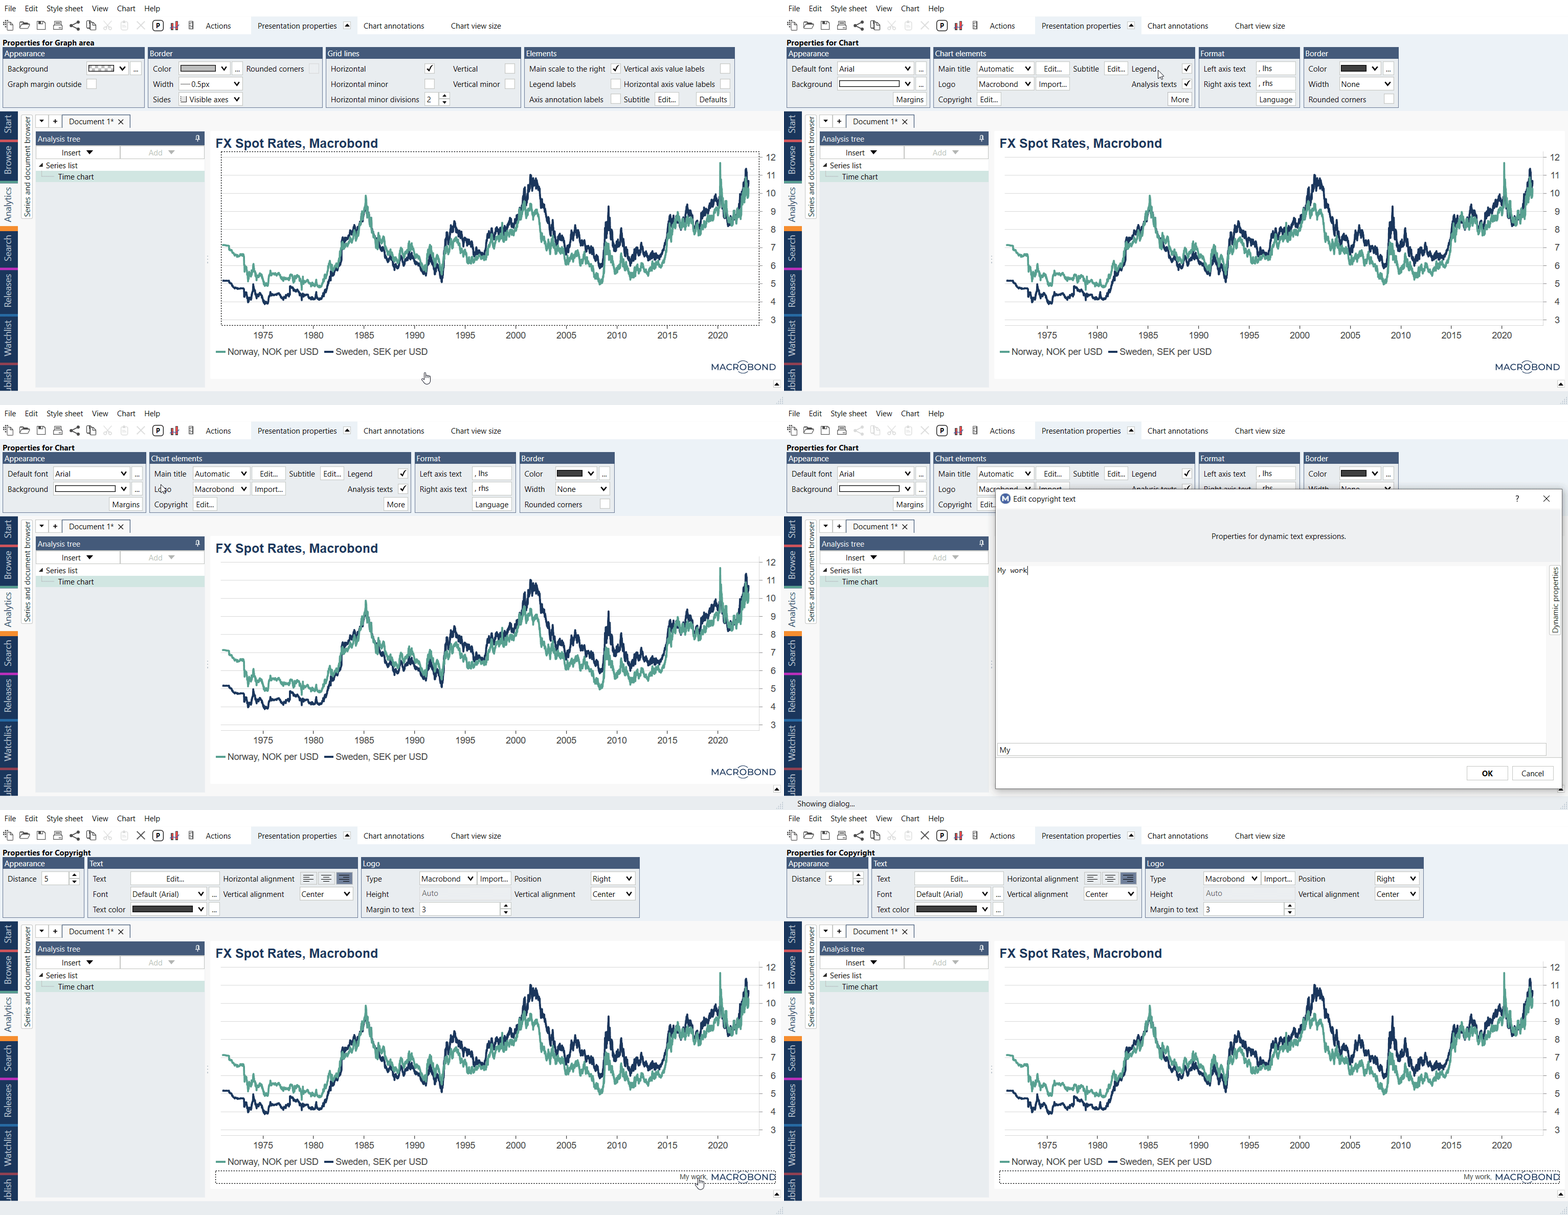
Click anywhere on the white area around the chart and open the presentation properties tab. In the chart elements group, you can control the source description with the option called 'Copyright.' Click on the 'Edit' button.
Here, you can type your preferred text. You may also want to use the dynamic text option to automatically add the source of the series. For more information about it see Logo & Copyright.

If you don't see your new source description at the bottom right-hand corner of the screen, you may need to change the text color to a darker color. Click around the area where the Macrobond logo was before until you select the box where the source description should go. Once selected, you can change the text color in the presentation properties tab.