Certain analyses produce category series - which by design do not keep any time parameters. With below workaround you can pass time information through analyses and show it in Bar chart.
Add formulas
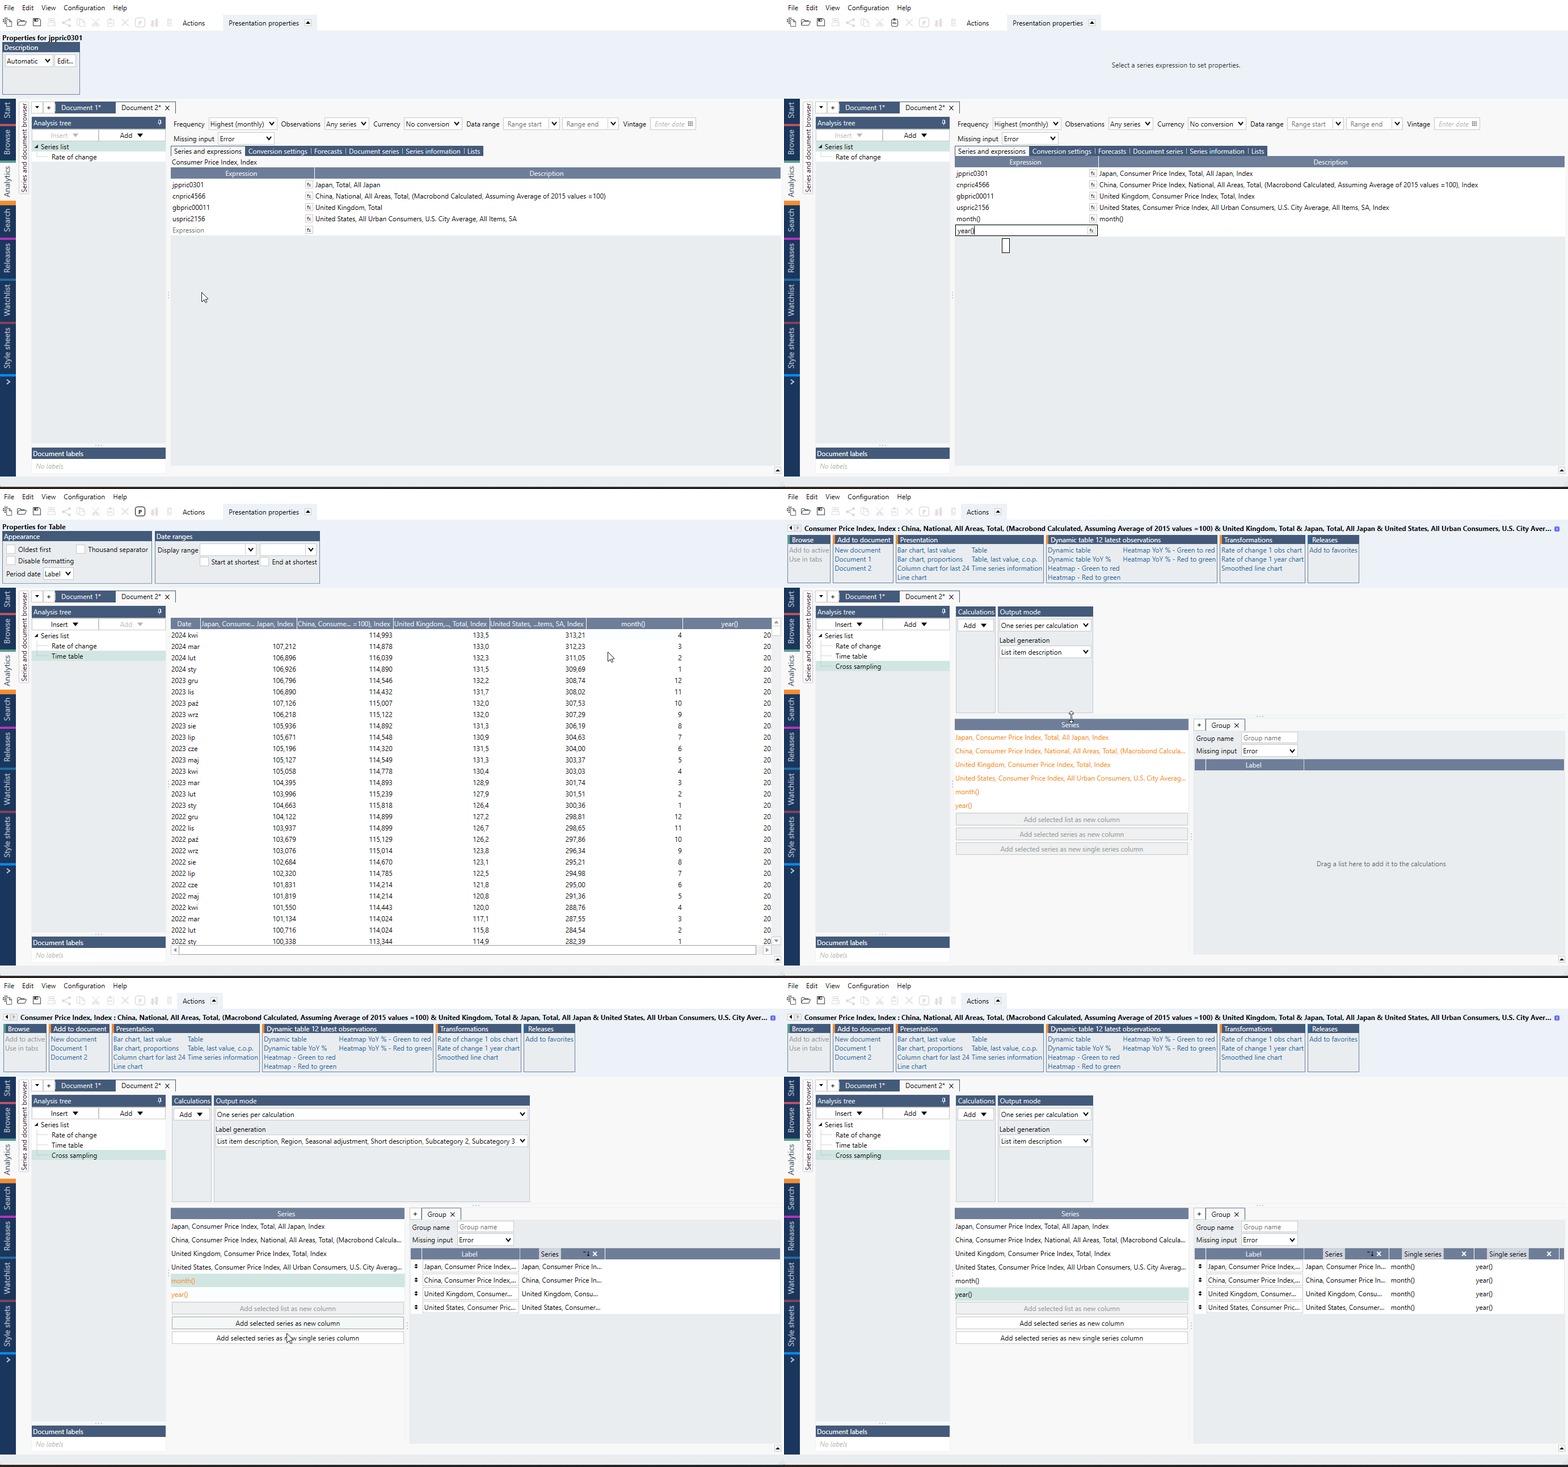
We have formulas which output time parameters, add needed ones to Series list:
week()
month()
quarter()
year()
From their output you will build dynamic dates.
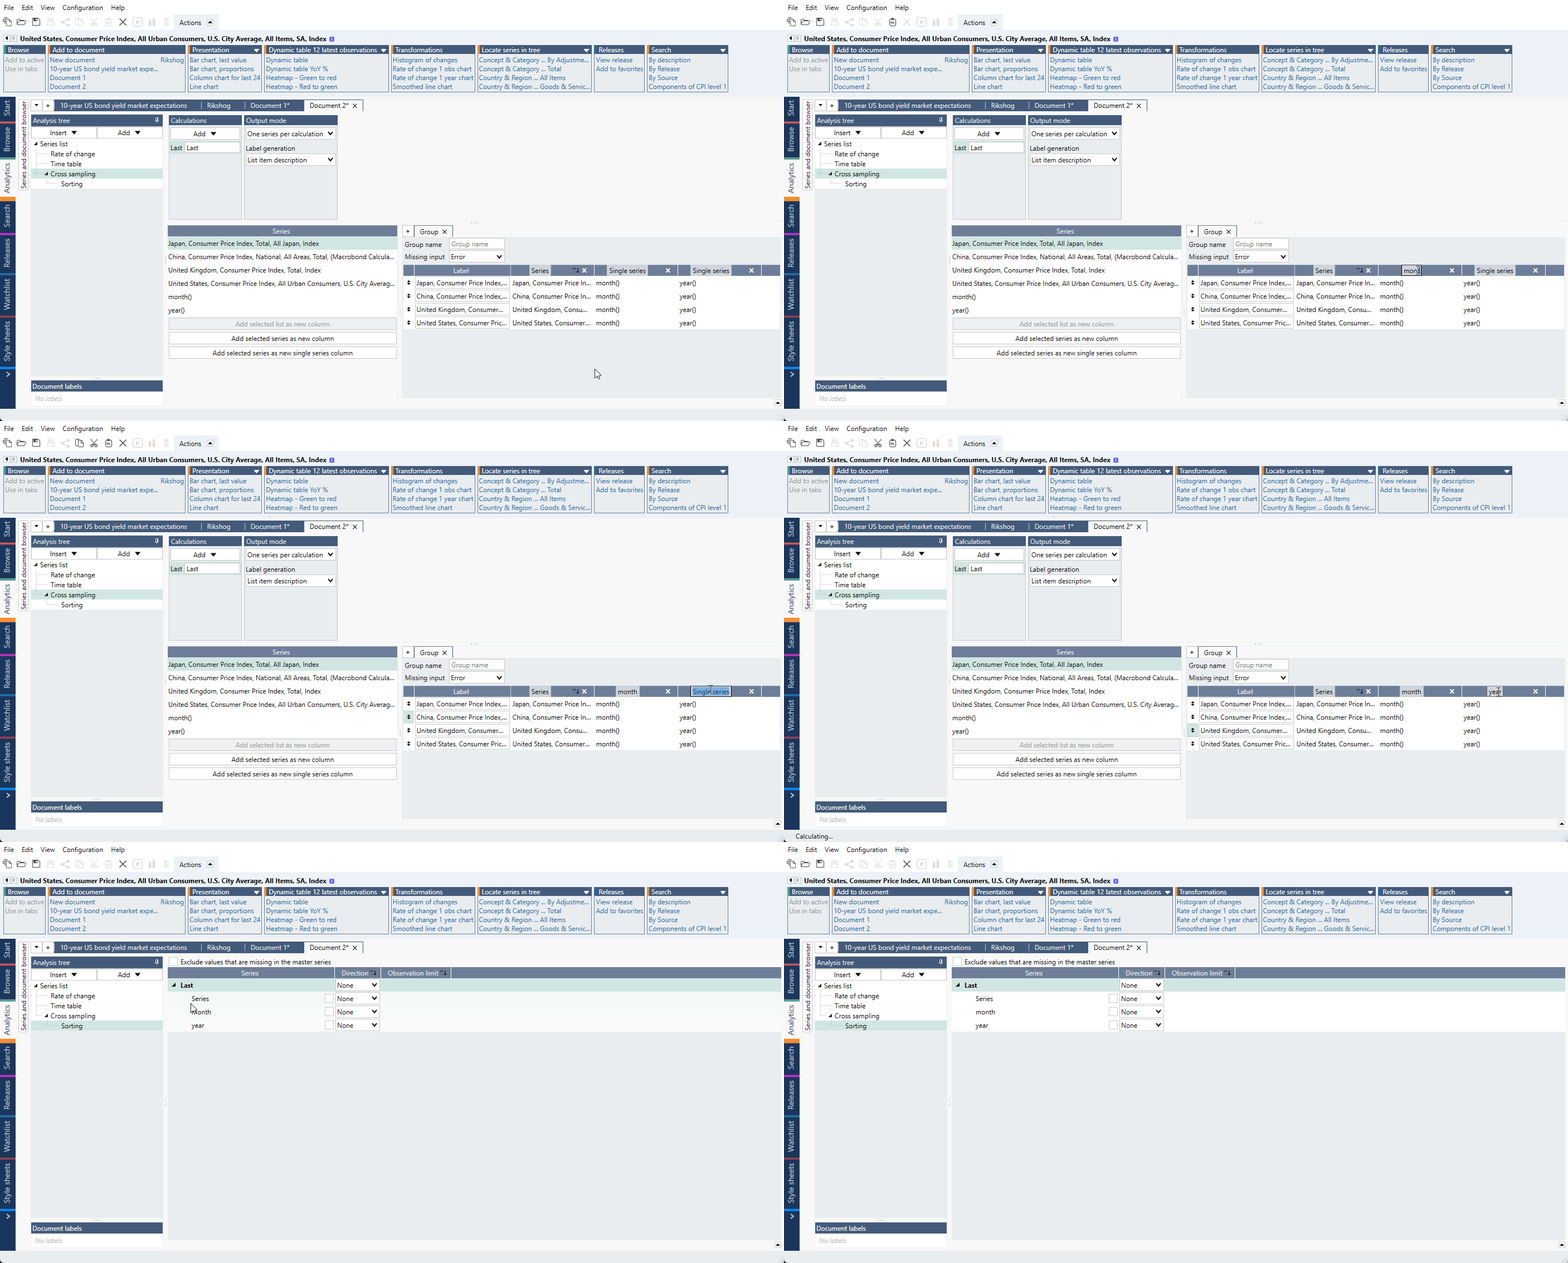
Cross sampling
- Mark series and 'Add selected series as new column' under a Group.
- Add each time formula in same Group with 'Add selected series as new single series column'.
- Add calculations.

- You can also rename columns for easier identification in next steps.

Sorting
If you are using it - don't sort time formulas. See below, that's all it is needed.
Bar chart
Prepare simple chart:
- Open Graph layout.
- Under Text leave only one series.
- Under Bar delete all series.
- On the left mark series and use 'Add new Text column' > 'One column per series with value'.
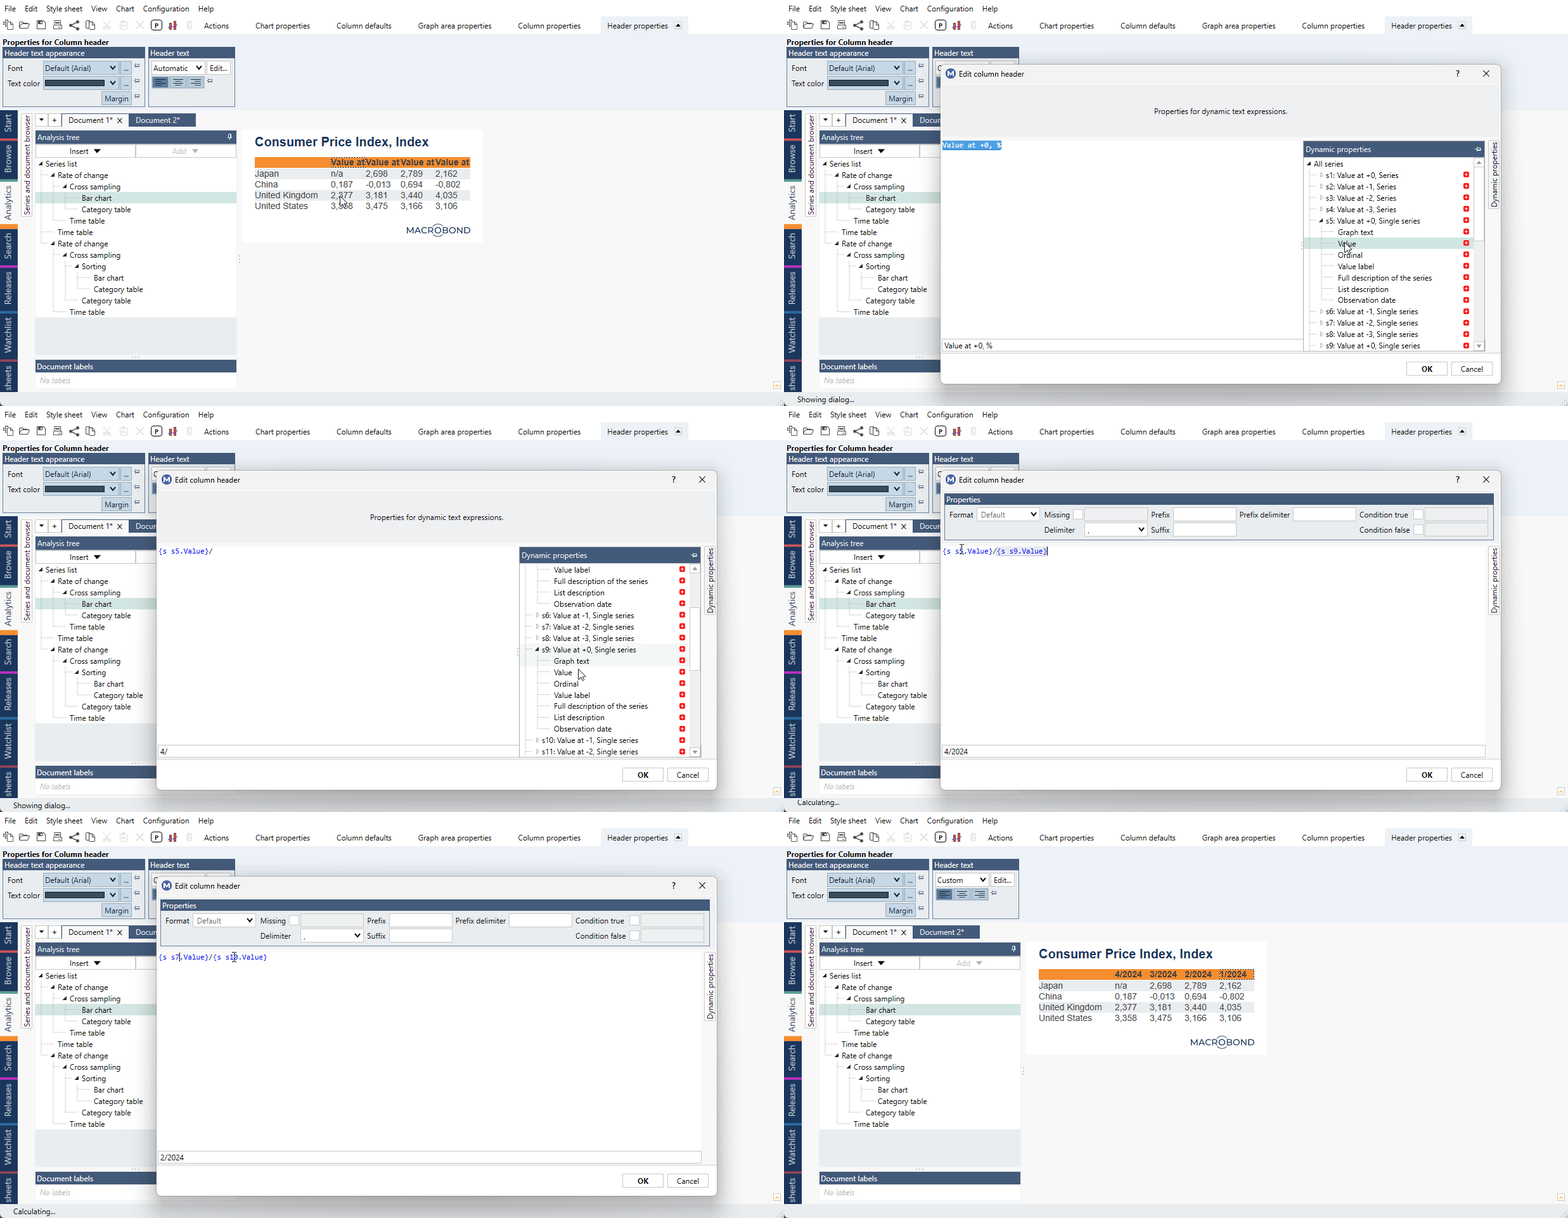
Add dynamic dates:
- Double-click on a cell.
- Roll out Dynamic properties.
- Find the right series for this cell, select Value.
- In next column you can use next/previous number i.e.; {s s5.Value}/{s s9.Value}, {s s6.Value}/{s s10.Value} and so on.
