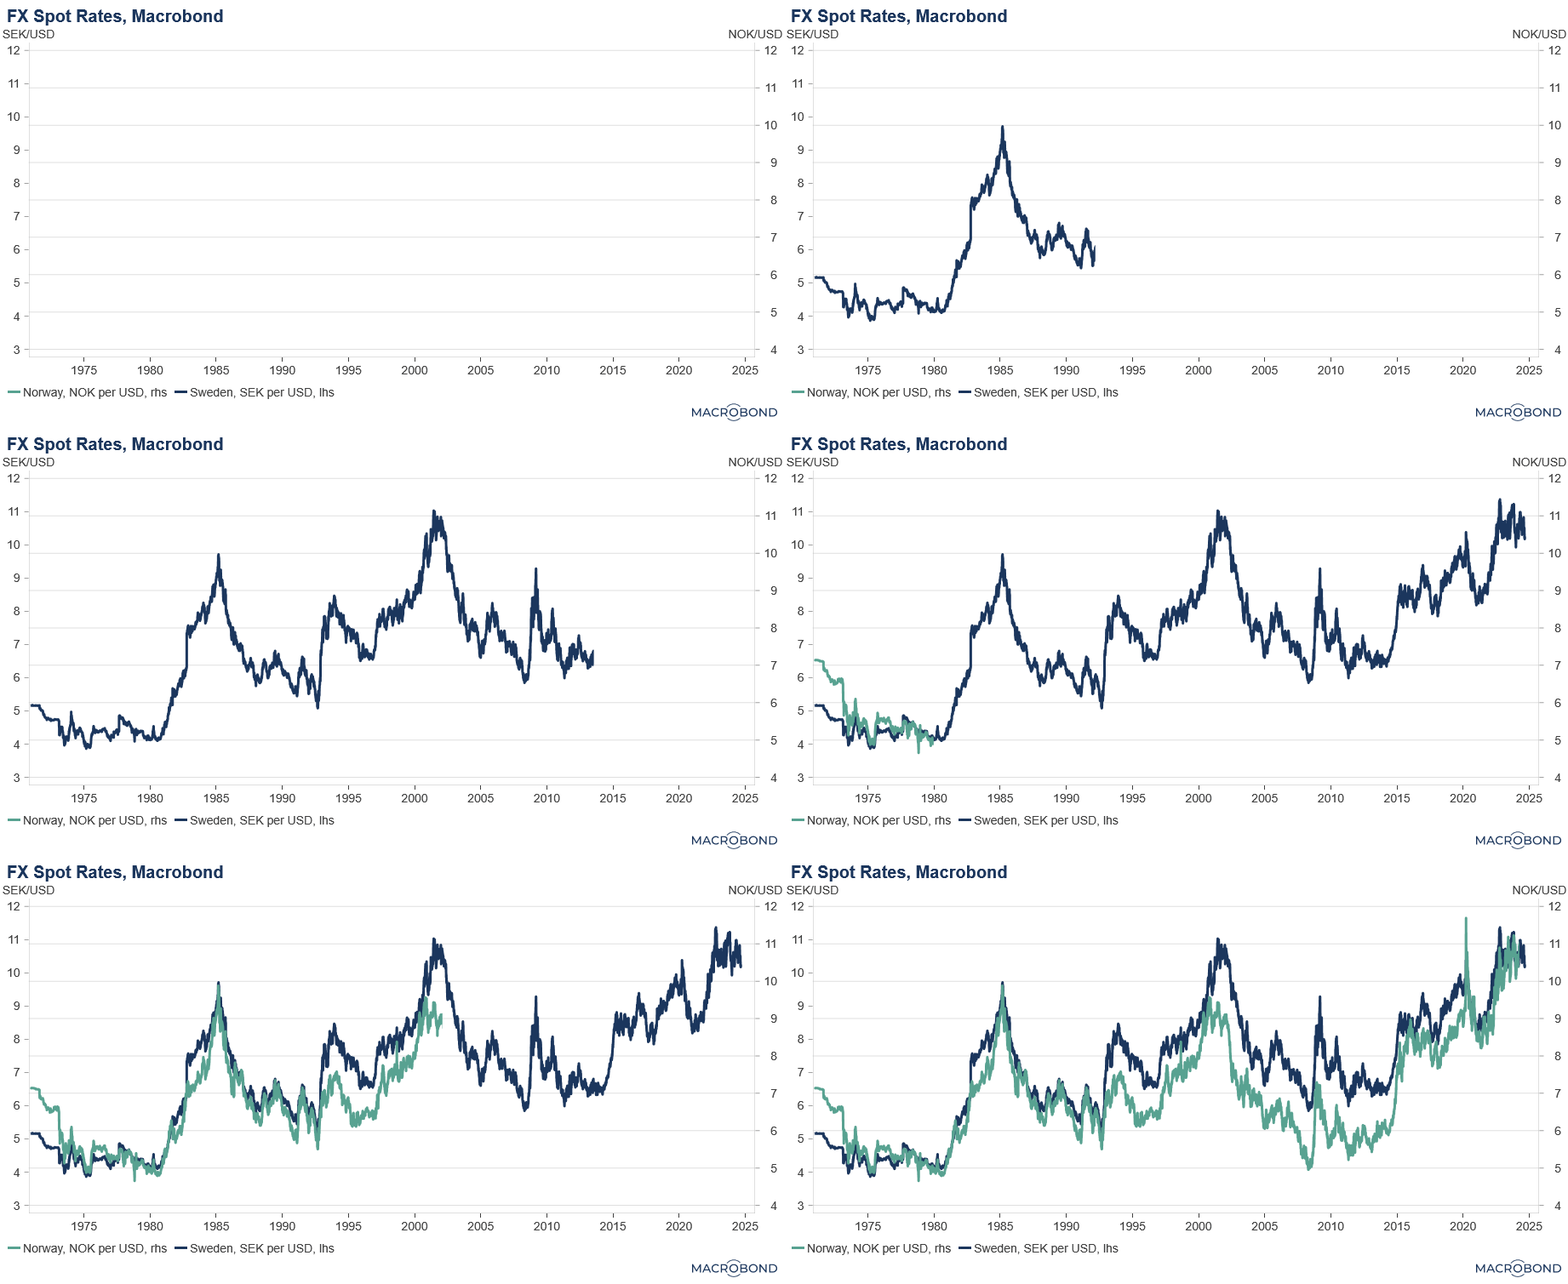
This feature was first introduced in Macrobond 1.28. Major improvements were added in 1.29.
Overview
This feature was first introduced in Macrobond 1.28 and later. Major improvements were added in 1.29.
With this feature you can animate your charts. With version 1.28 you can animate only Time charts, but in version 1.29 we introduced also animation of Scatter charts, Category charts, and Category scatter charts, added live preview on chart in main application and more animation formats.
Currently it is not possible to animate Bar charts and Pie charts.

How to create animated chart?
Preview chart
This feature is available in Macrobond 1.29 and later.
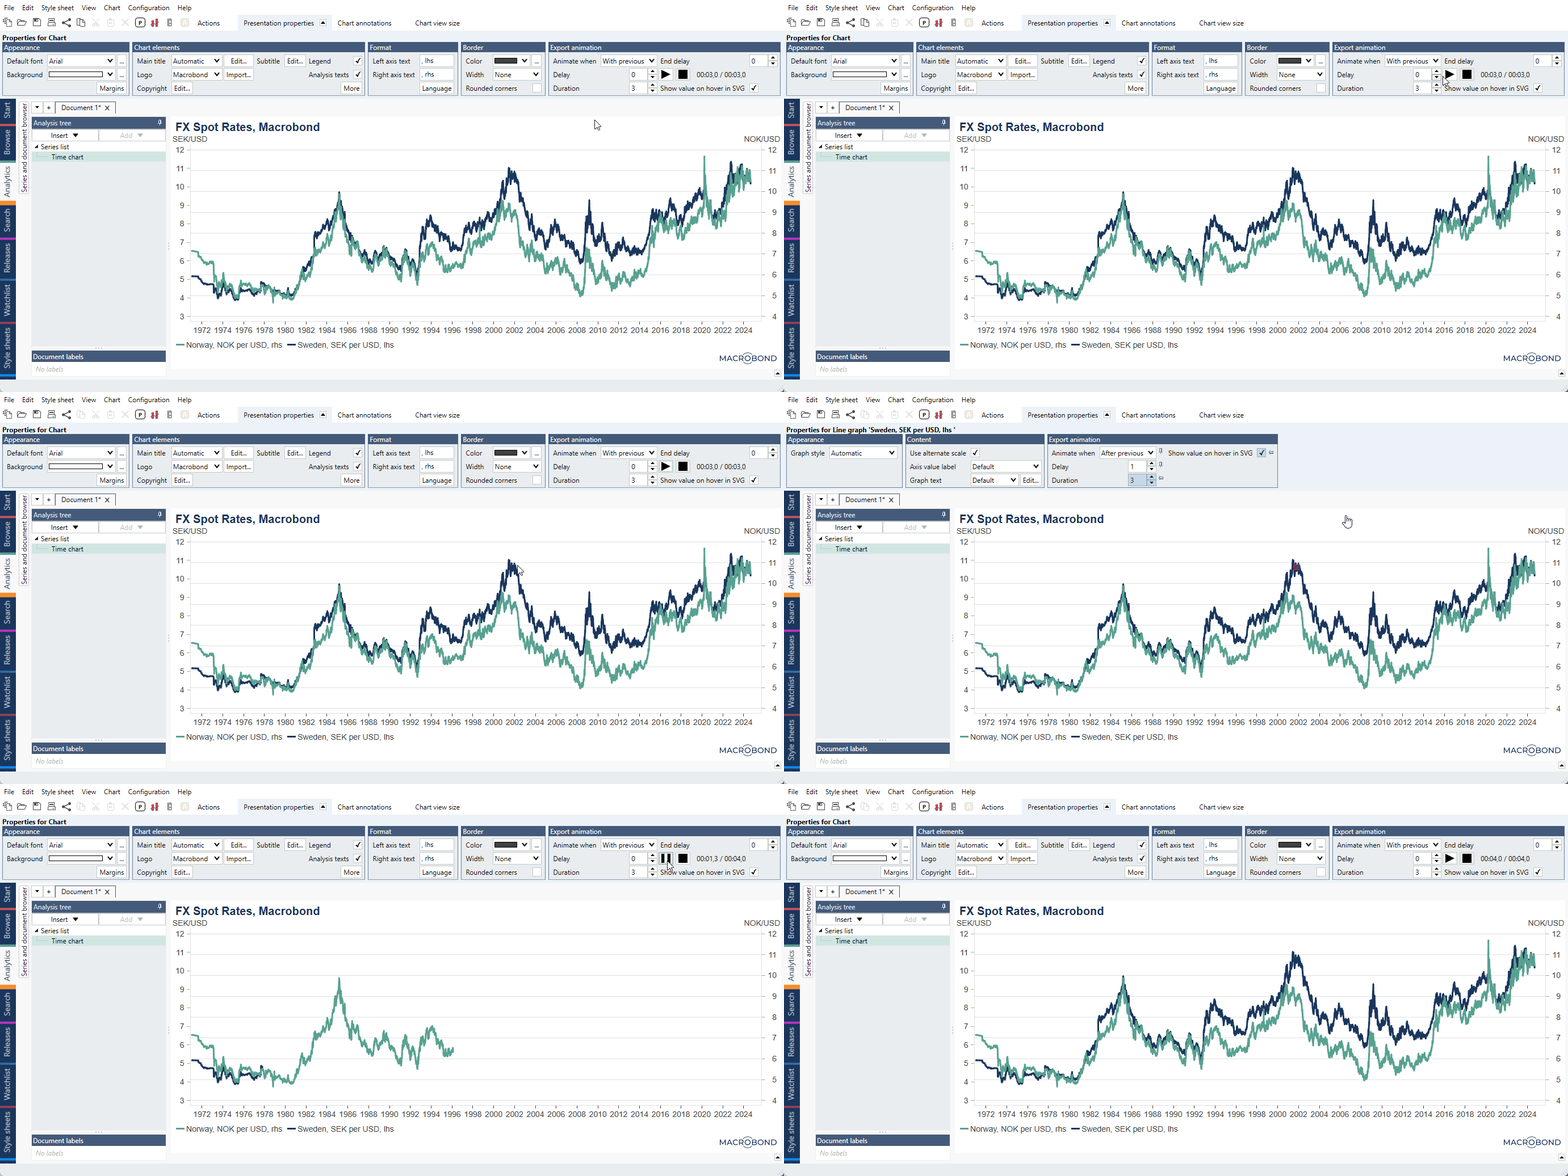
Under Presentation properties > Export animation you will find a panel with few settings about which you can read below. Note that you can select these setting for each individual series. To do this click on each line/column and you will see separate settings.

Elements of animation
- Animate when - you can choose from: After previous, With previous, Never.
- Delay - it’s a length of intervals between drawing each line. To start all series at the same time set it to 0 with Animate when: With previous.
- Duration - how long it will take to draw line from the start to the end.
- End delay – when you want to use looped animation (i.e., GIF) you can set how long last image will be shown before the cycle starts again.
- Timer – calculates total time needed to execute all elements of animation.
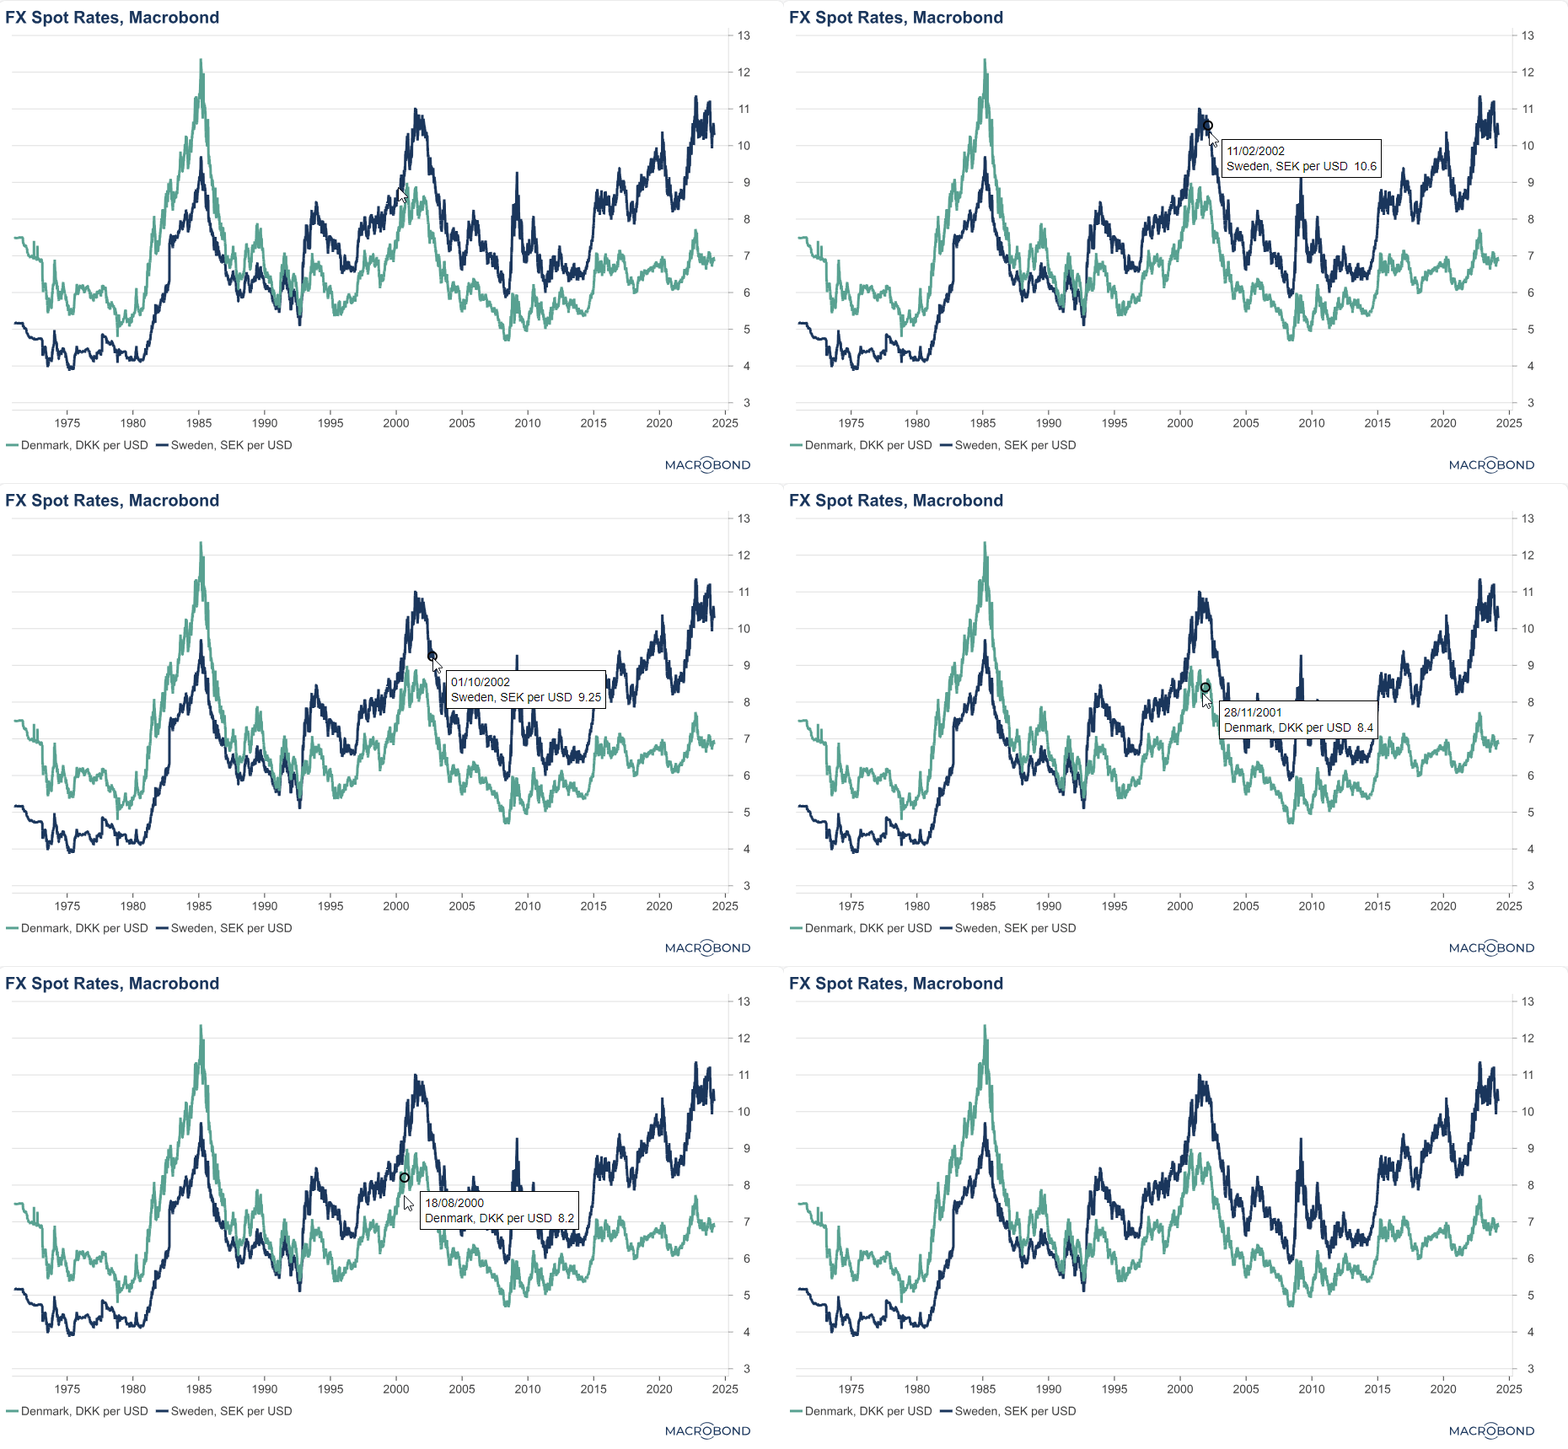
- Show value on hover in SVG - after checking it you will be able to hover over SVG image and see each data point with date and value. This is a tooltip and you can change its color/style in Style sheet. For more information see Tooltip - Color and style settings.

Animation formats
In version 1.28 only SVG was available. Since version 1.29 you can choose from:
- vector image/animation: SVG*;
- animation: GIF (looped), MP4.
*Note that animation won't work in Office programs (i.e. Power Point).
How to show it to others?
Copy special (SVG)
Right-click on your chart and choose Copy special. In new window you can select SVG format.
File > Export image or video (SVG, GIF, MP4)
There are two places from which you can export video. First from upper menu: File > Export image or video. And second, in main app working space right-click on a chart and select Export image or video. See How to ensure the image and video quality? for tips.
If you enable ‘Copy path to clipboard’ when exportin GIF or MP4 you can paste the chart directly to Office programs (Word, Excel, PowerPoint).
Note that you can save preferred export settings with 'Save as export favorite.' Then on chart, after right-click, you will see Export favorites list where you can quickly select favorite format.
Go to File > Send to LinkedIn to connect to you account and send image, MP4 or GIF file. For more information see Publishing charts on LinkedIn.
Animation in version 1.28
In version 1.28 setting are only available under File > Export image.
You can specify Directory, File name, Size (you can use Current). The only available format is SVG with settings (check Animate line graphs):
- Show data point on hover - you will be able to hover over image and see each data point with date and value. This is a tooltip and you can change its color/style in Style sheet. For more information see Tooltip - Color and style settings.
- Delay per graph - length of intervals between drawing each line. Set it to 0 to have all of them shown in the same moment.
- Duration - how long it will take to draw line from the start to the end.
Style sheet
This feature is available in Macrobond 1.29 and later.
The Presentation properties > Export animation panel is available in Style sheets.