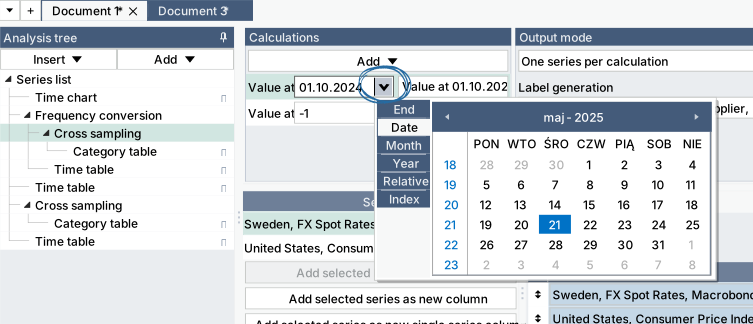
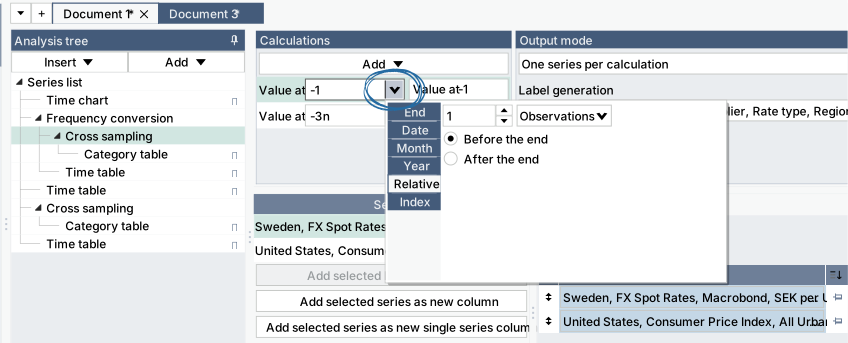
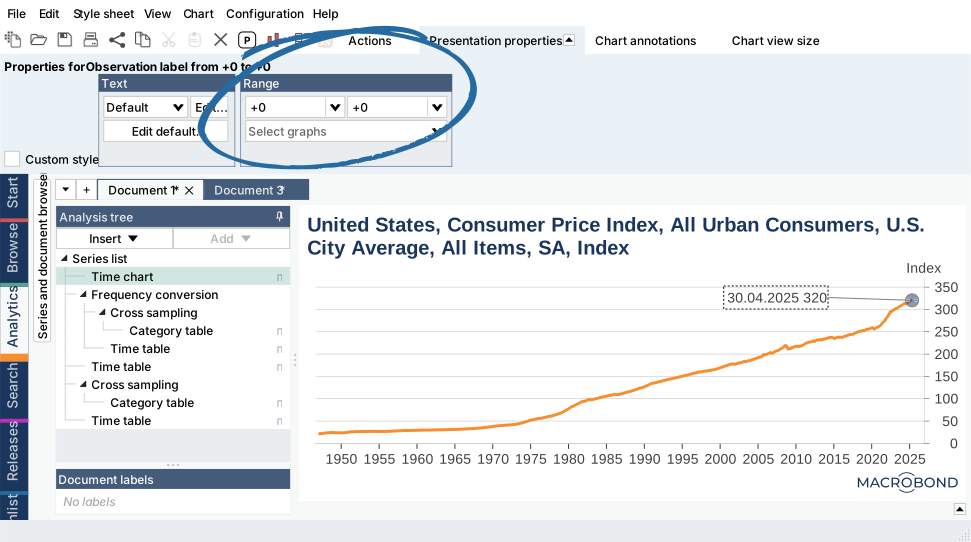
In Macrobond you can select date to indicate point in time with date or you can use a relative shortening to, for example, always show value from one year before the end of series. This can be used everywhere where you see Date box, i.e.; Cross sampling, Observation label.
Date
| 01.10.1997 | the observation at the specified date |
| 10.1997 | the last observation of the specified month |
| 1997 | the last observation of the specified year |
Relative
| -1y | one year before end of series |
| -2q | two quarters before end of series |
| -3m | three months before end of series |
| -1w | one week before end of series |
| -2d | two days before end of series |
| -1 | one observation before end of series |
| -1n | one period of the original frequency before end of series, i.e., when you have Quarterly and Daily series, and main frequency is Daily, the -1 won't show anything for Quarterly but -1n will give you a value one period before current quarter. |
| +0 | last available value, end of series value; +0 +0 applied in range (i.e.; in Observation label) will keep observation always on last value in series |
| +1 | one observation after end of series |
| +2d | two days after end of series |
Other
| 0 | number from 0 to 49 means year 2000-2049 |
| 50 | number from 50 to 99 means year 1950-1999 |
| #1 | first index number/first position, used in category charts where there are no dates i.e.; after Slice analysis |
| #50 | fiftieth index number/fiftieth position, used in category charts where there are no dates i.e.; after Slice analysis |
