Overview
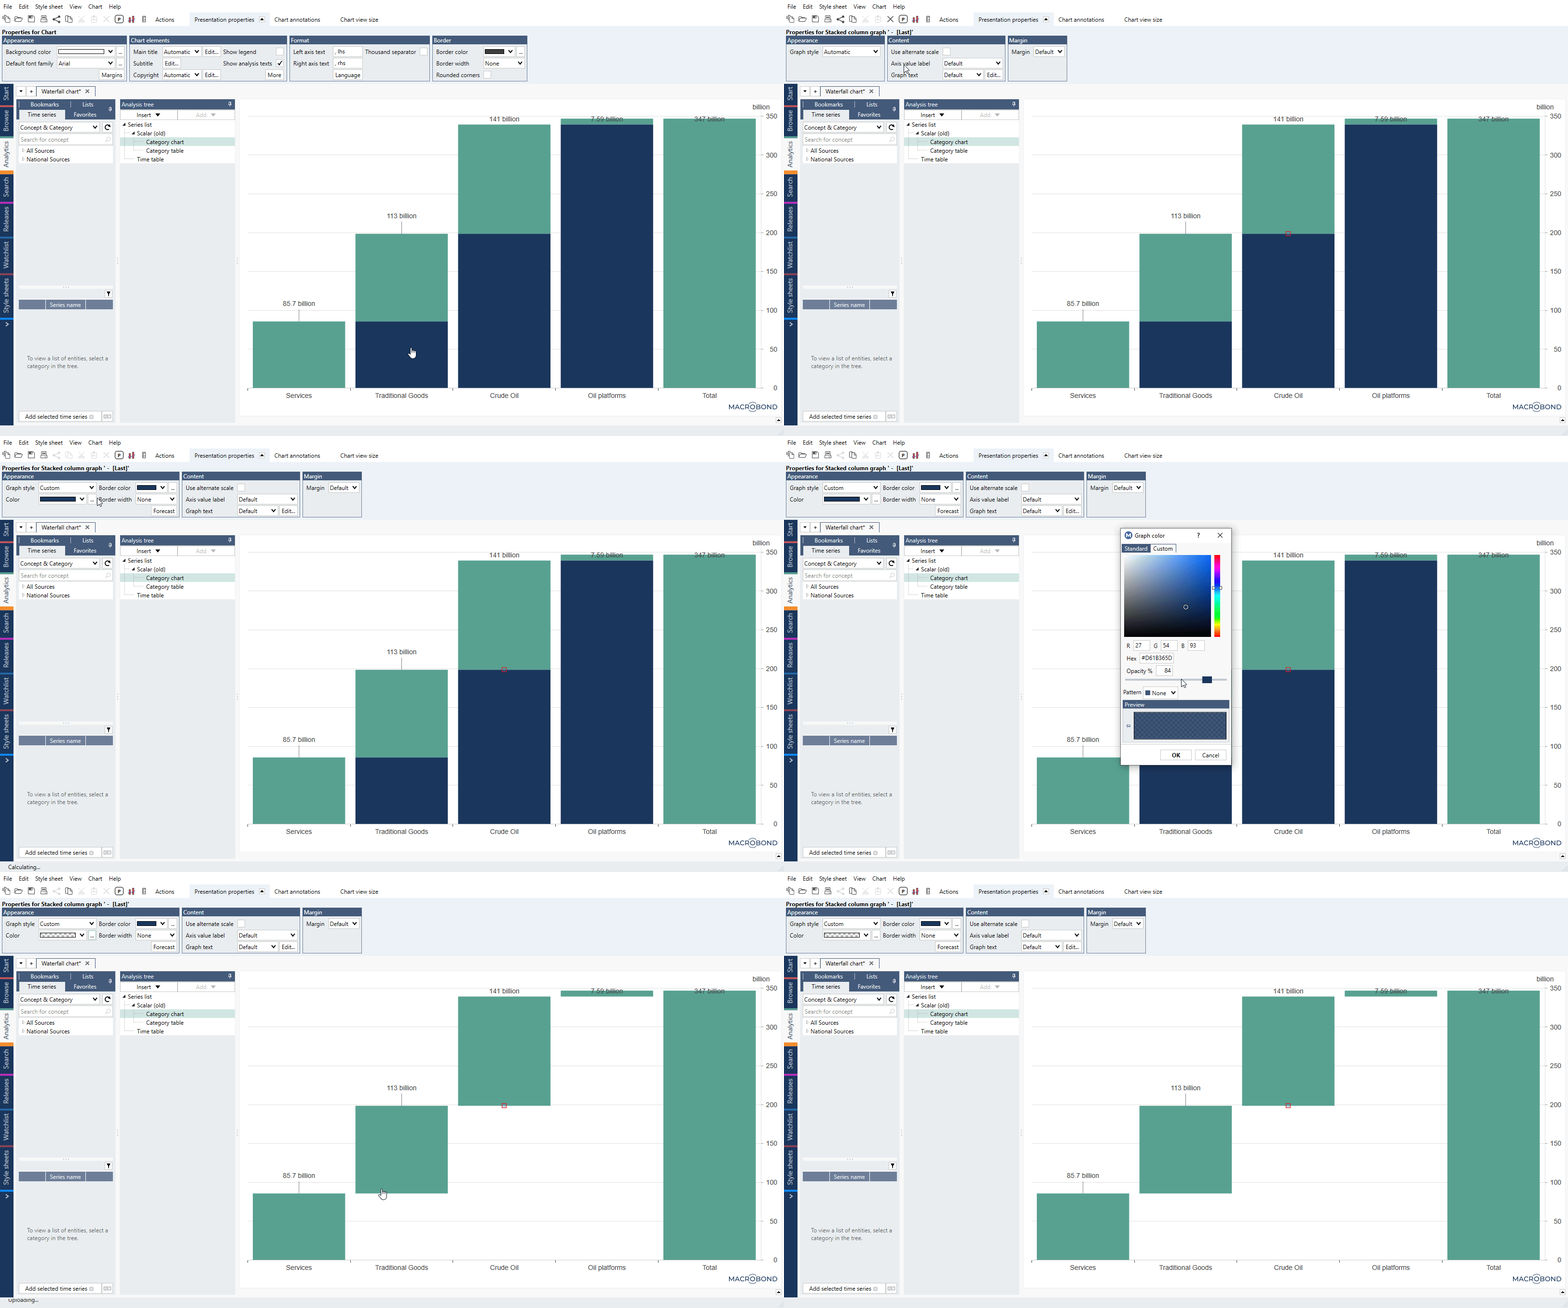
With a little bit of arranging series you can show series as a Waterfall chart on a Category chart.
How to create a Waterfall chart?
- On Series list add series and same amount of '0' as series.
- Decide the order of the series on chart - when you want particular series to 'float', replace the '0' with a sum of series to create base, on which 'floating' series will stand. Each base is the sum of preceding series.
- Add Scalar analysis:
- In Input panel arrange pairs of series in order '0 - series - <replacement for 0> - series.'
- For Output series use 'Partition into: 2'.
- Add Category chart, select data set with 0's and turn its color into 0% opacity.

Examples
In this example we used transparent placeholder series to create waterfall effect.
Here we used range graph type to create anchor point at value '50'.
Here we combined placeholder method with anchors and created stacked columns/areas.