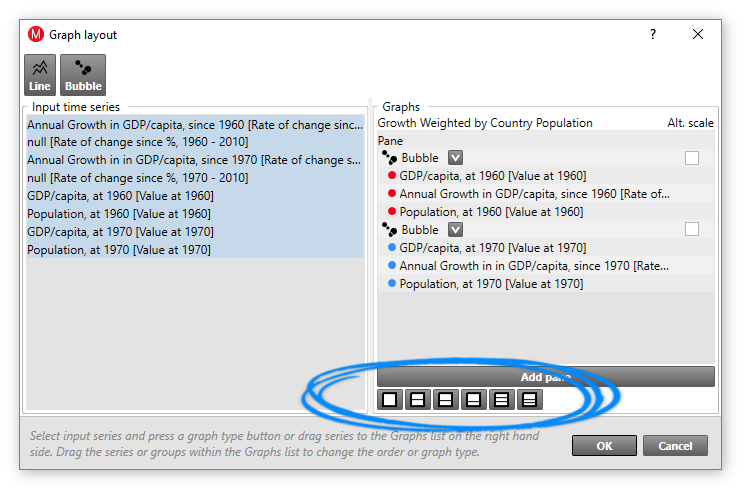
Charting
Pie charts
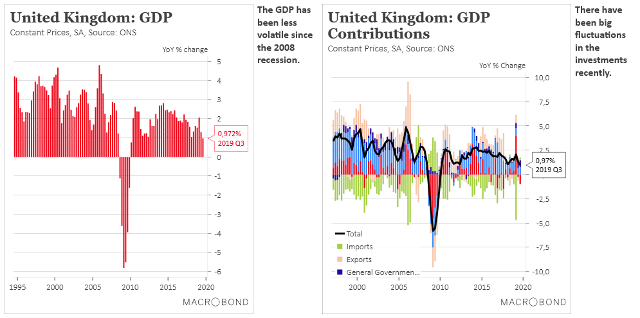
There is a completely new chart type called Pie charts that is typically used after Cross-sampling analysis.

Mini-pie charts as Bar chart symbol
The small Pie charts within Bar charts illustrates the proportion of two series, or magnitude of one value on a scale 0-100. These Pie charts are part of the new ‘Symbol’ column type.

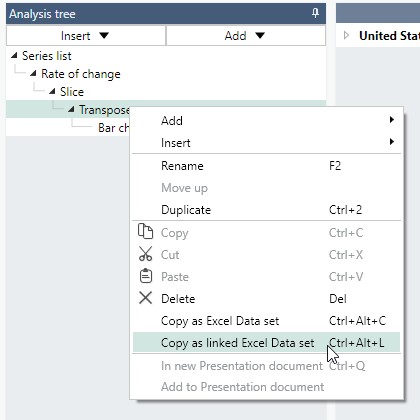
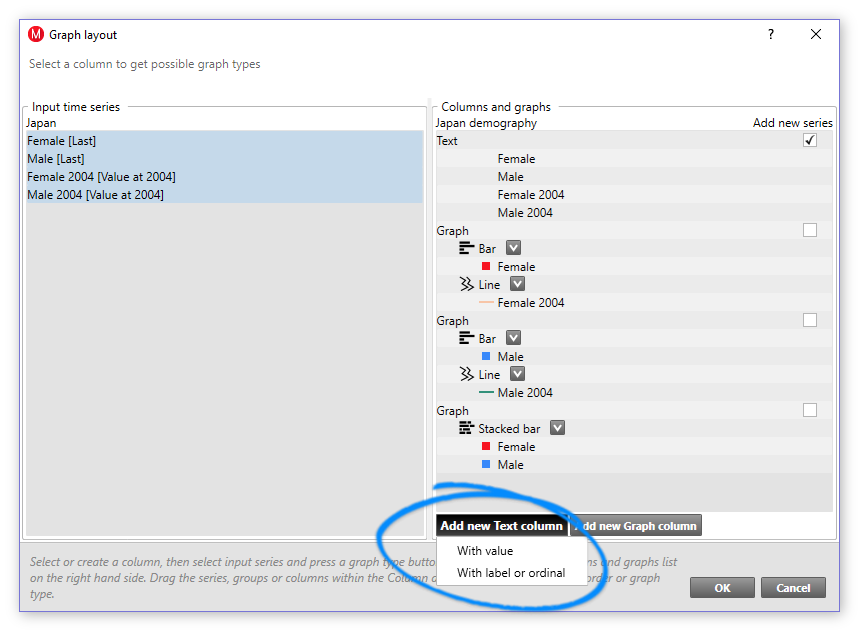
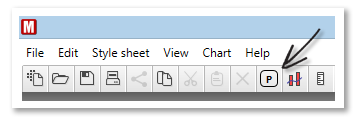
Custom logo
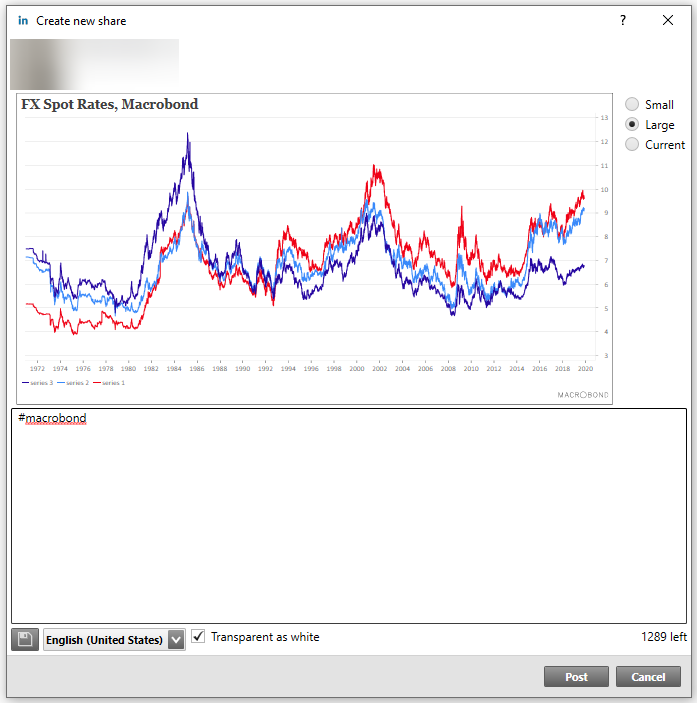
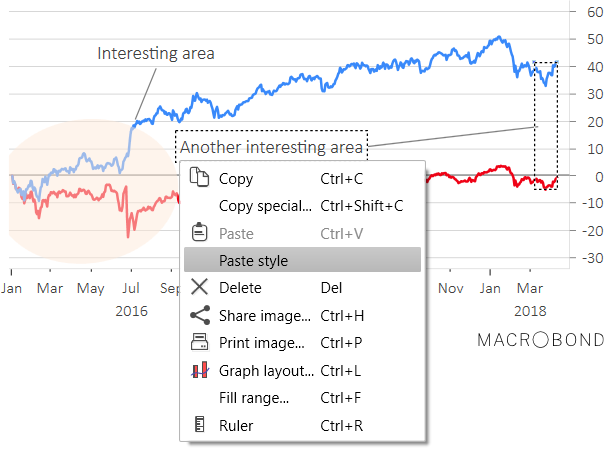
You can use an SVG image as a custom logo. This can be specified in the Style sheets as well as in each chart. See the previous image for an example.
We impose some limitations on the SVG images. For security reasons, any JavaScript and external references are ignored. Only vector graphics are supported and bitmaps in the image will be ignored. Embedded fonts will not work. You can use a tool such as https://boxy-svg.com to convert fonts to paths.
Logo + text at the same time
As seen in the previous example, you can have text and logo at the same time.
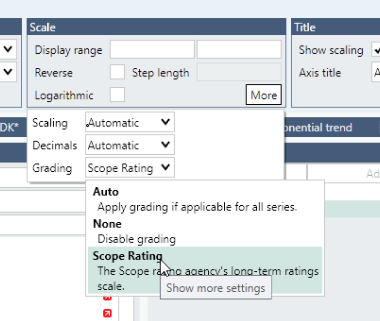
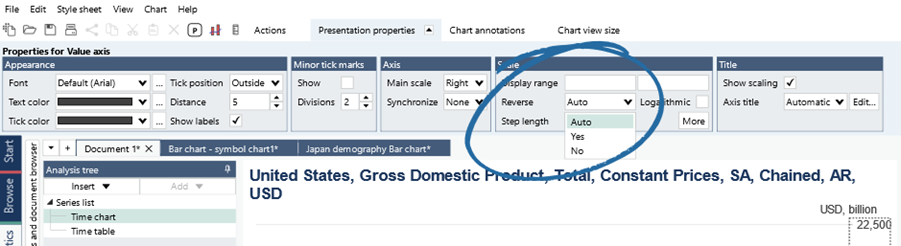
Value axis “Auto reverse”
Some series contain a hint that they are best presented using a reversed value axis. The setting of reverse scale on the value axes has a new option called ‘Auto’ that takes this hint into account.

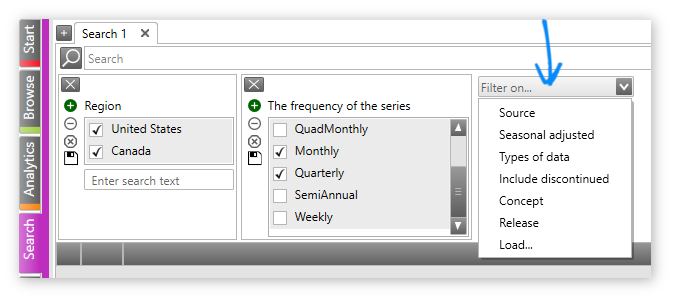
New tabs in Analytics
You will find an overview of these new features below. There is more information on our Help site here.
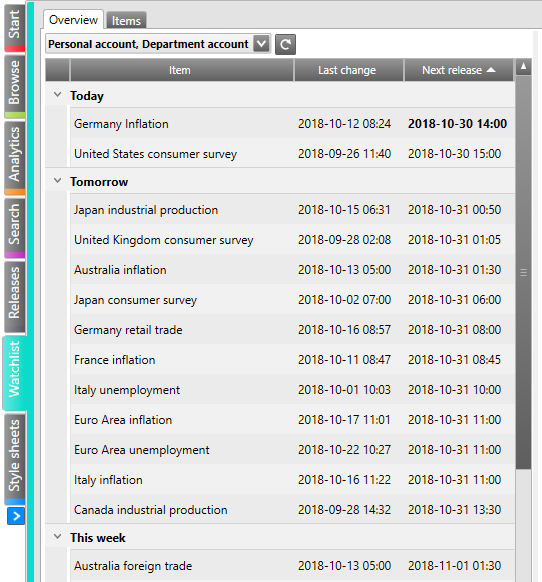
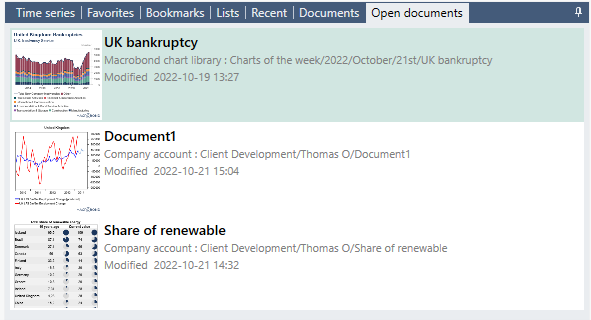
New “Open documents” tab
There is tab in the Analytics activity called Open documents. This offers a vertical view of the open document tabs including a thumbnail. You can go to the tab by selecting a document in the list.
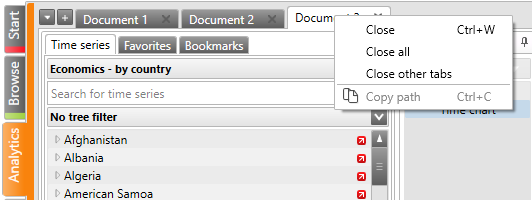
Documents can be closed by using the “X” in the corner which is displayed when the mouse is over an item or by using the context menu.
You can navigate to this tab using the keyboard shortcut Ctrl+Shift+o.
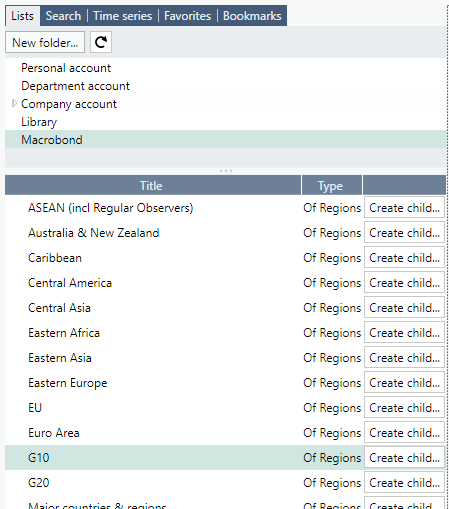
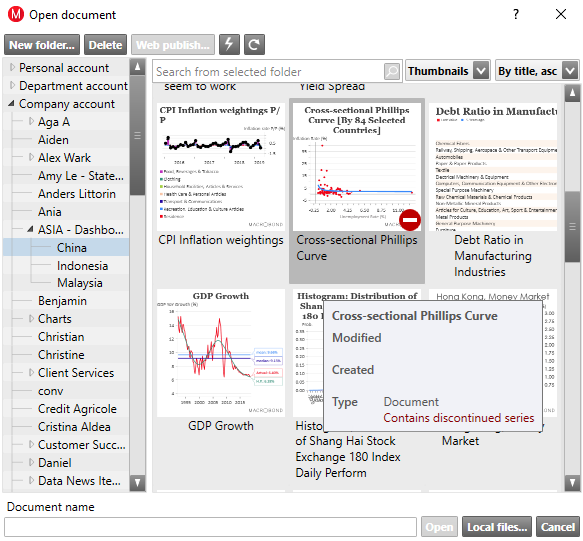
New “Documents” tab
The new tab called Documents in the Analytics activity is an alternative way to open documents instead of using the File Open/Save dialog.
This view offers the following benefits:
- You do not need to bring up a dialog to browse among the documents
- You can quickly switch between several different locations
It also integrates the list of Recently used documents and Notifications that can also be found in the Start activity.
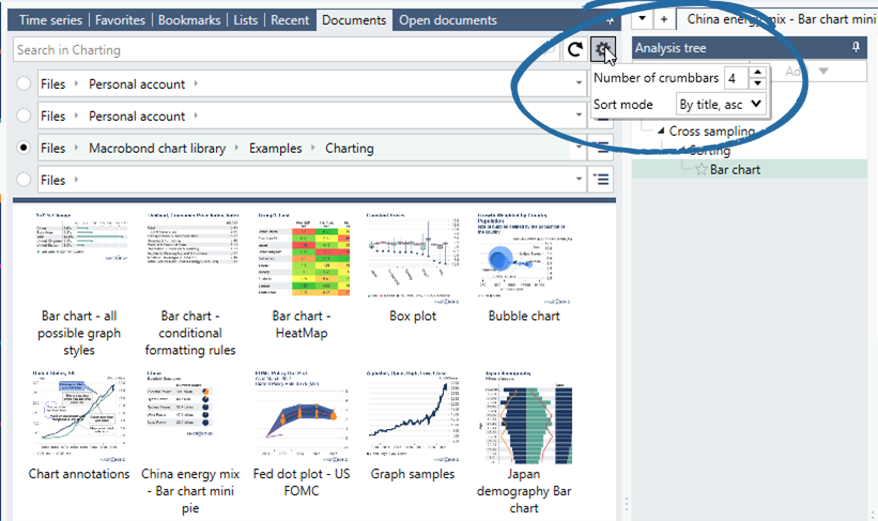
This view contains one or more crumb bars at the top that can represent different locations in the folder structure. Having more than one crumb bar allows you to quickly switch between locations you commonly use. You can select how many crumb bars you want to have by pressing ⚙️button that can be seen in the upper right corner in the image below.
You can navigate the directory structure in several different ways:
- By clicking on the “arrows” in the crumb bars
- By using the “tree button” to the right of the crumb bar
- By double clicking on subfolders displayed below the crumb bars
- By typing on the keyboard in the crumb bar
Preview document
When you select a document by clicking on it in the Documents tab, the document will be opened in preview mode. This is indicated with the orange color of the document tab:

When you select another document, it will replace any document currently opened as a preview. In this way, you can browse through documents and preview them without collecting a lot of open documents.
The document will stop being in preview mode if:
- You double click on the document in the Documents tab
- You click on the Open symbol next to the X in the orange preview tab
- You make any change in the document
Open containing folder
The command “Open containing folder” on the context menu of the document tabs, will navigate to the folder where this document is stored in the Documents tab.

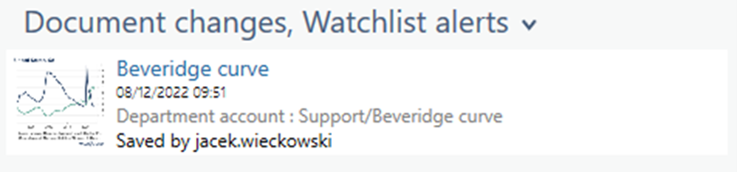
Notifications of changed documents
Notifications for open documents
You will get a notification in the application if a document you have opened is modified.
The notification will be in the form of a yellow banner at the top of the document and in the Open documents tab:

Subscribe to document change notifications
You can subscribe to notifications of document changes by right clicking on a folder in the new Documents tab. This will refer to documents in that folder and all sub folders.

You have an option of receiving those notifications on the Start activity of the application or also as Windows notifications.

The notifications on the Start activity looks like this:
Application features
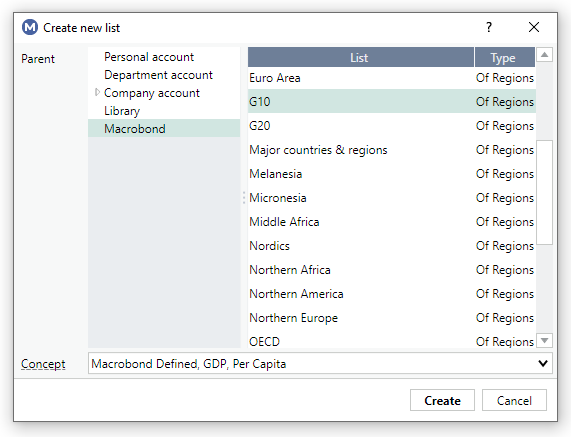
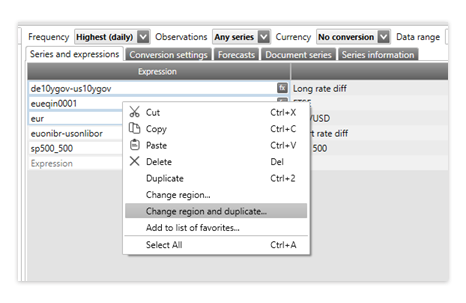
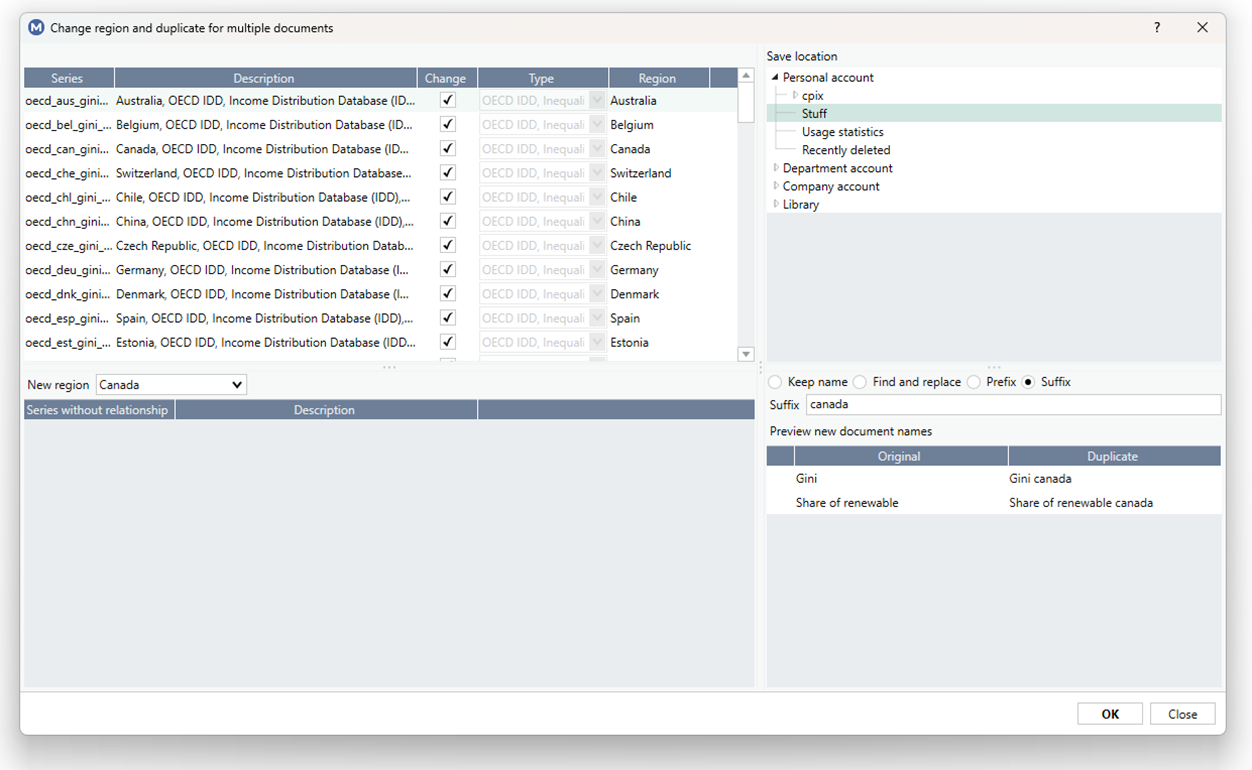
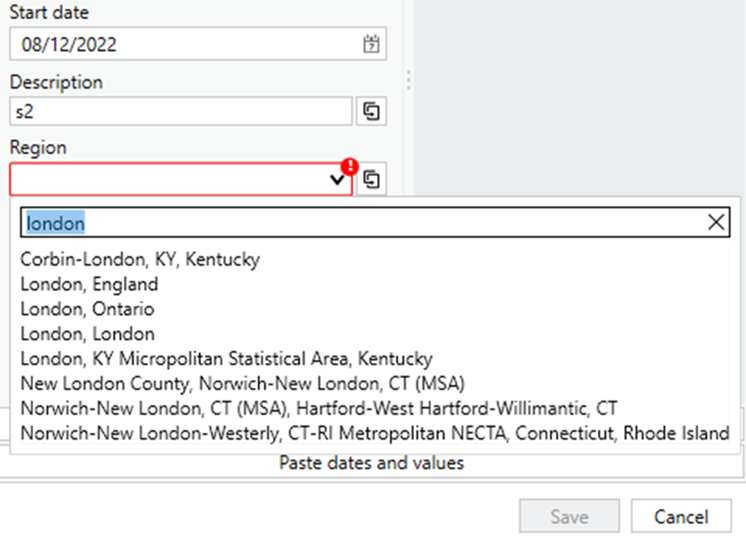
“Change region” for multiple documents
You can select more than one document in the File Open/Save dialog and then “Change region” on the context menu. You will then see a dialog where you can select a new region. The existing documents will be updated with series that matches the new region.
If you select “Change region and duplicate”, you can instead create new documents instead of the updating existing and select what location to save the new documents. It is also possible to select how the new documents should be named.
“Change region and duplicate” for Presentation documents
If you right click on a Presentation document in the File Open/Save dialog, you can select Change region and duplicate. This will work in a similar way as when you selected multiple documents as described in the previous section. You should pick a new folder for the changed documents and the new presentation document.
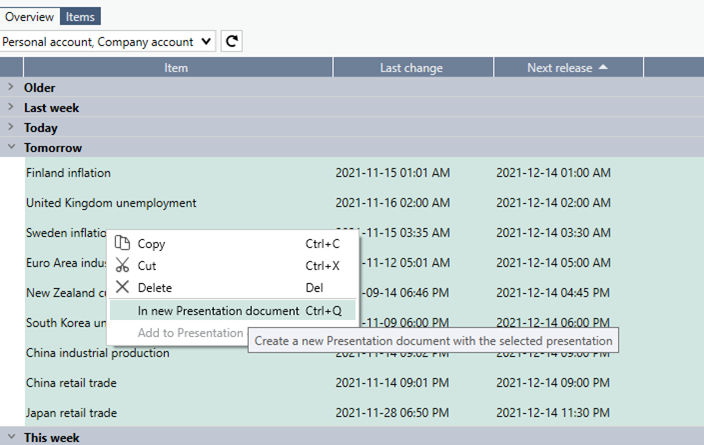
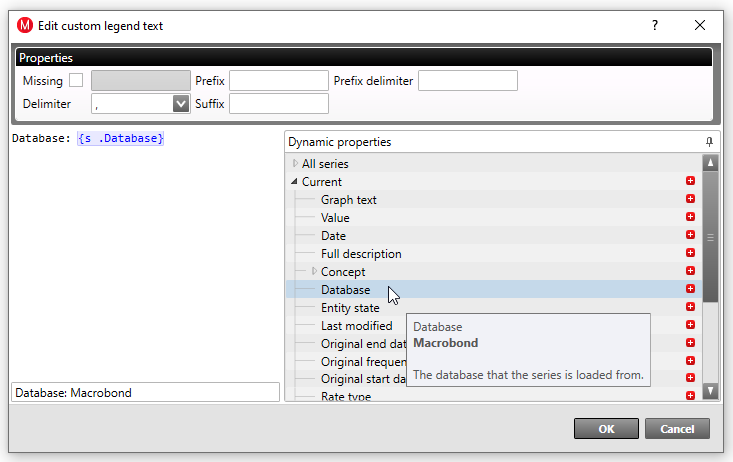
Time series info icon above Action bar + context menu
The blue “i” in the Action bar is a shortcut to display the Time series info report for the selected series.
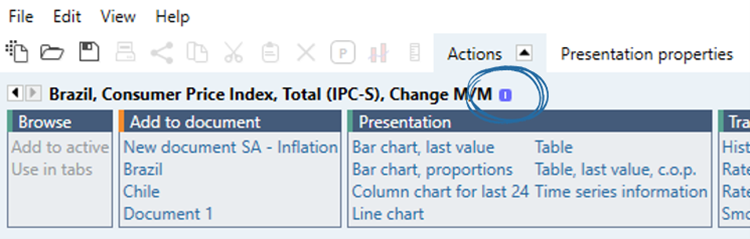
This option is also on the context menu of series in the time series browser.
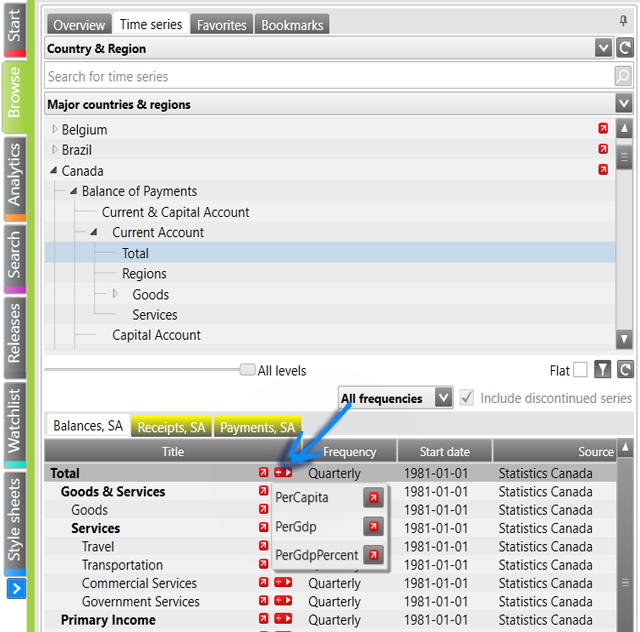
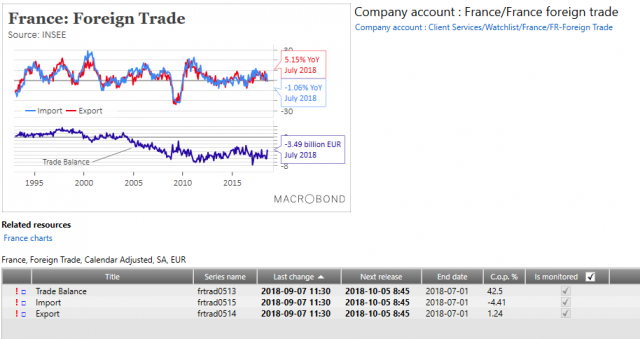
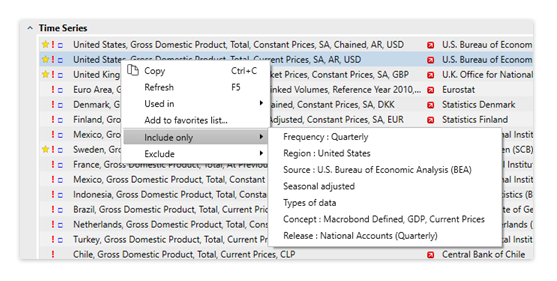
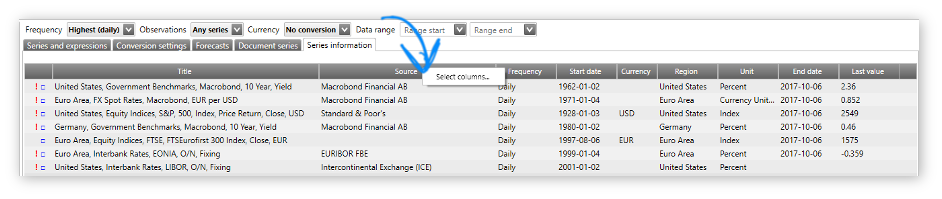
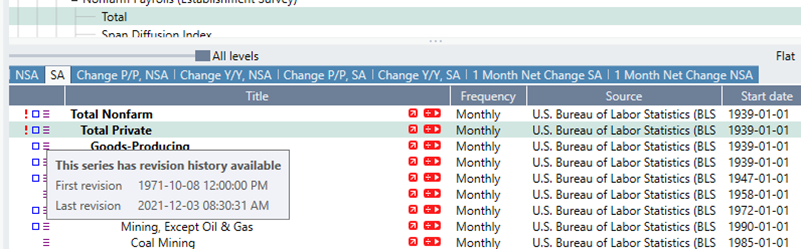
Columns First and Last revision date in the Data browser
From the context menu of the header in the time series browser you can select to include the timestamps of the first and last revision stored by Macrobond for series that have revision history.
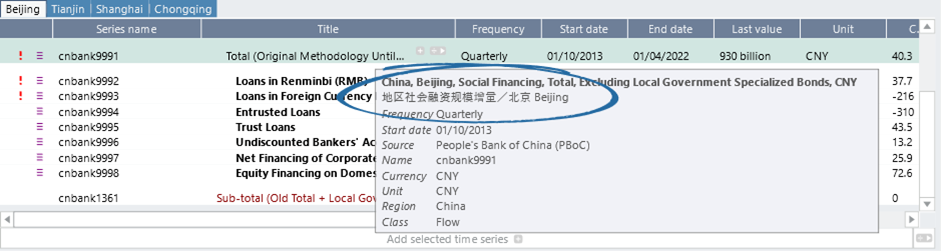
Show local language description in series info tooltip
For series that have a description in a local language it is now included in the tooltip of the series in the time series browser.
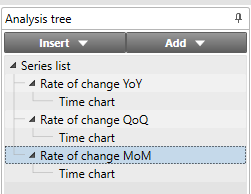
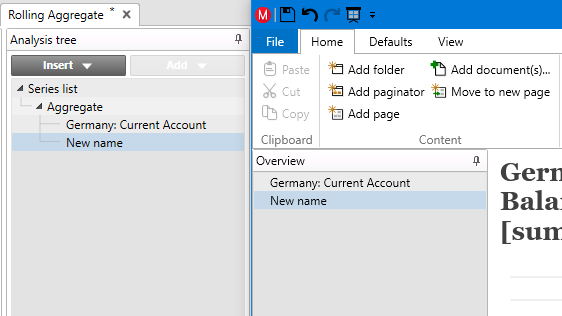
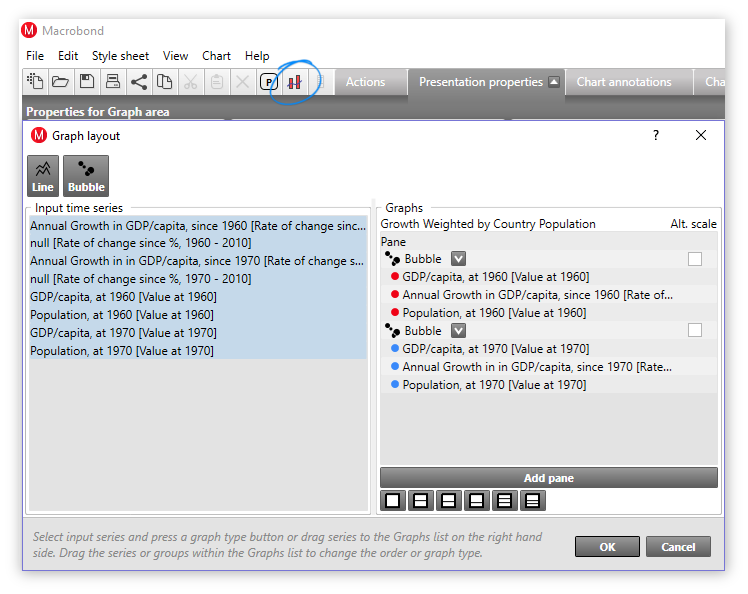
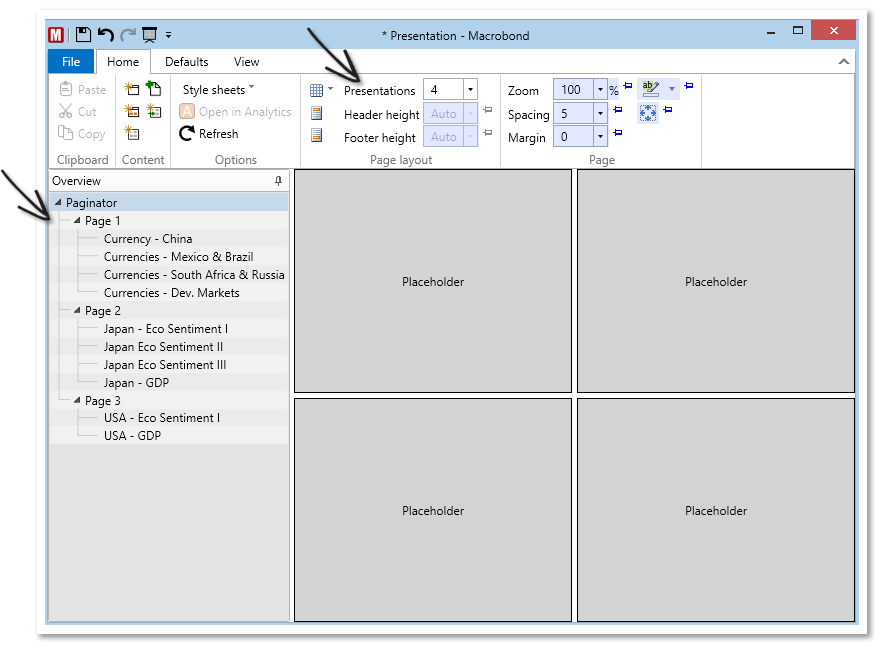
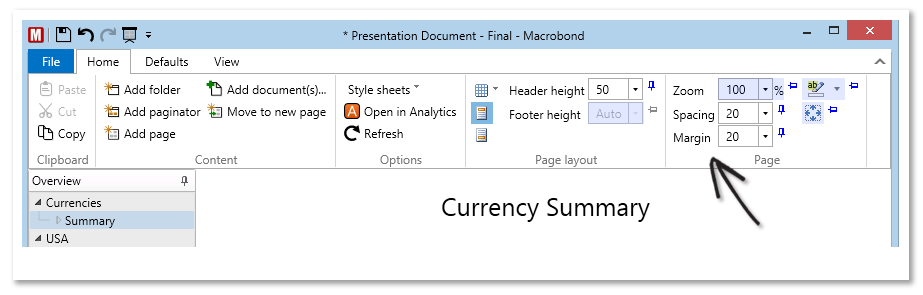
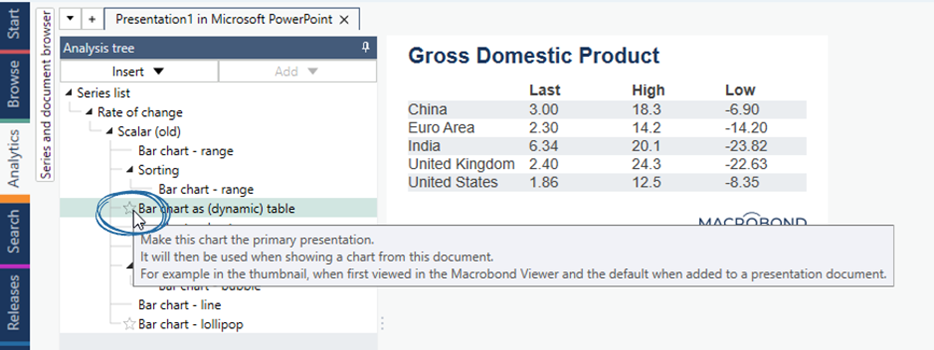
Explicit selection of “primary presentation”
The primary presentation is the presentation that is used for thumbnails. It is the one that is activated when you open a document and is the default for previews and in the Viewer.
There is a star in front of the name of the primary presentation in the analysis tree. This can be seen for the Bar chart here:
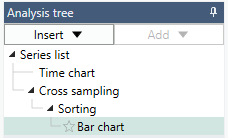
You can select another primary by clicking on the corresponding position for another presentation in the tree or by selecting “Make chart primary presentation” from the context menu.
New Start activity style
The Start activity has been redesigned.
- You can filter what types of news items to include
- Most news items have images that will be displayed together with the title and a short summary
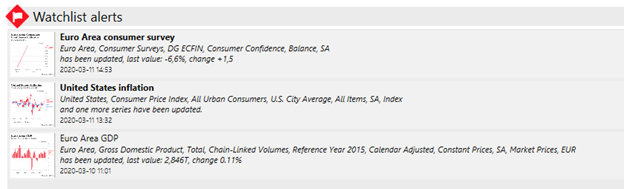
- The notification pane has been moved to the lower left corner and now includes both new notifications subscriptions to changed documents plus the Watchlist notifications
- You can change the proportions of the panes by dragging the splitter line

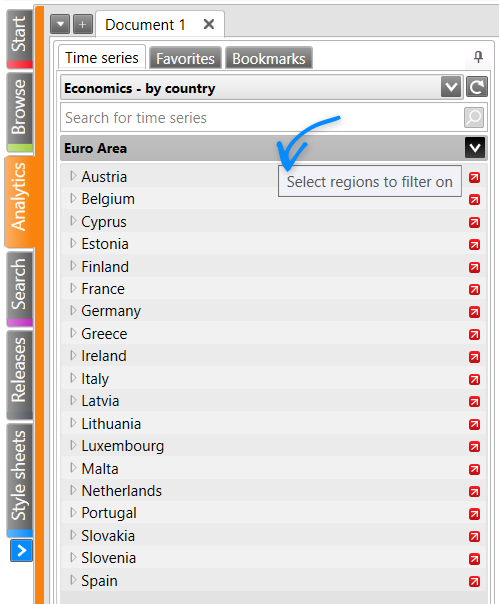
More options for Regions for in-house series
The list of possible regions when saving an in-house series now includes many more regions and not only the major countries.
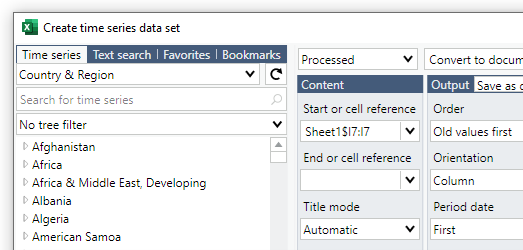
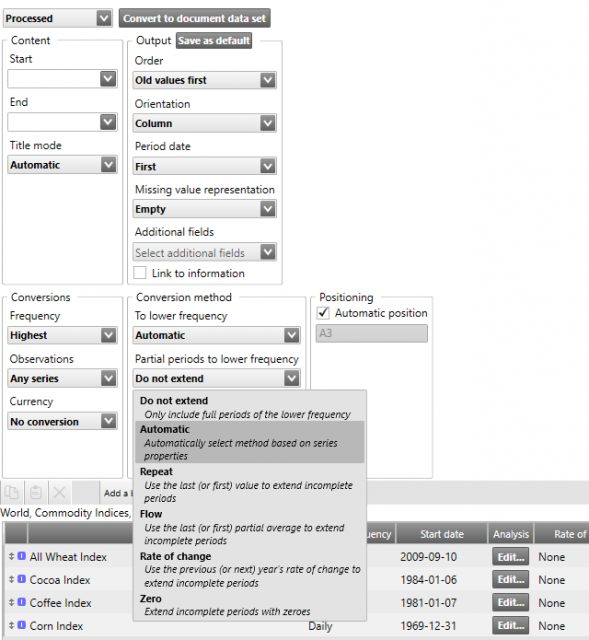
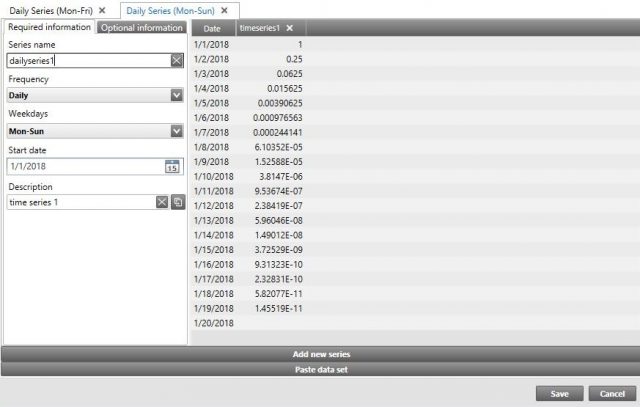
Labels with time period in the Slice analysis for daily data when slice period is Yearly
When you have daily data, select “Match by date” and slice by year in the Slice analysis, there will be value labels containing the dates that can be shown on the x-axis of a chart.

This works best if the series have one observation for each day of the week. You can configure in the Series list that the series should be converted to Monday-Sunday if it is not already in that frequency.
Select a different presentation for embedded chart
If you double click in a chart embedded in an Office document, it will open for editing in the Macrobond application. Here you can now select another chart in the document to be the one that is visible in the Office document by marking it as the primary presentation.
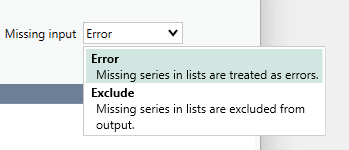
Missing series input mode for lists in Series list
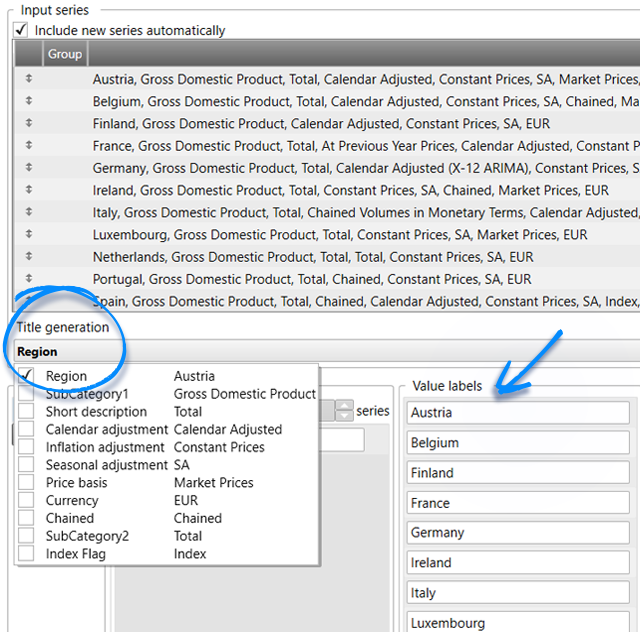
We have added an option to select how to treat series that are missing when using lists of series in the formula expressions.
Other
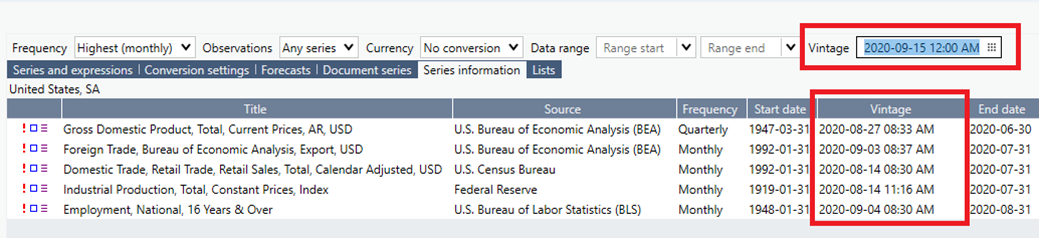
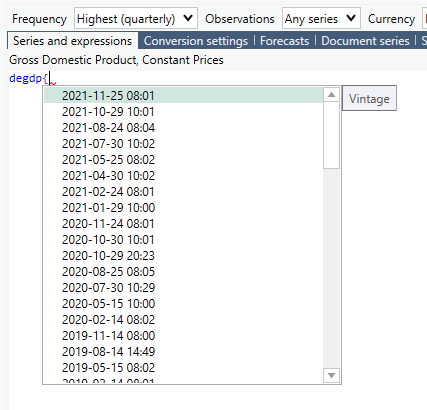
Vintage property on ISeriesExpression in desktop API
By setting the Vintage property of an ISeriesExpression object, you can use vintage versions of series that stores revision history in Unified requests. Unified requests allow you to convert a set of series to a common frequency and calendar. See our API documentation.
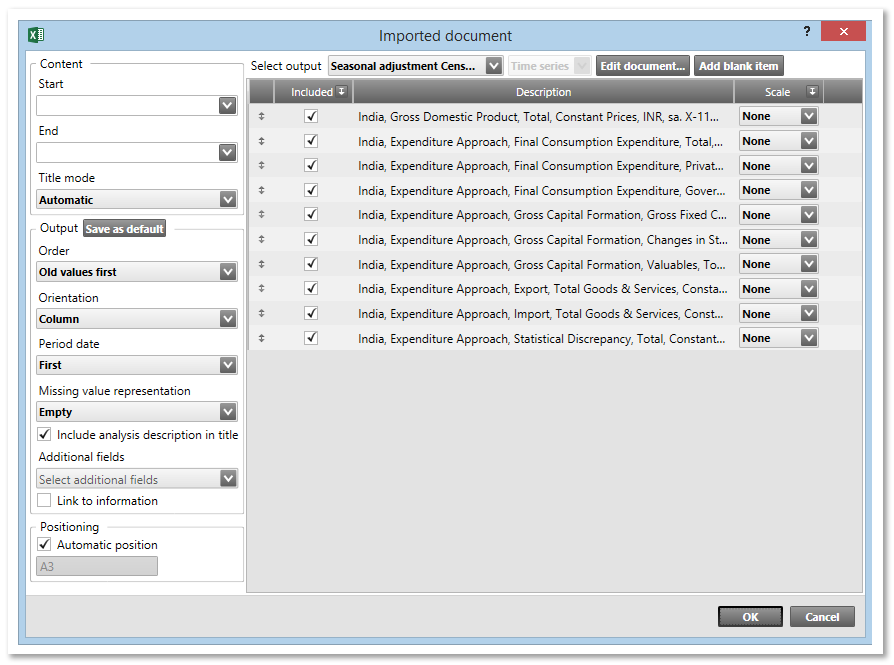
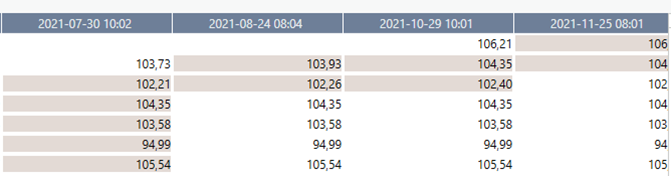
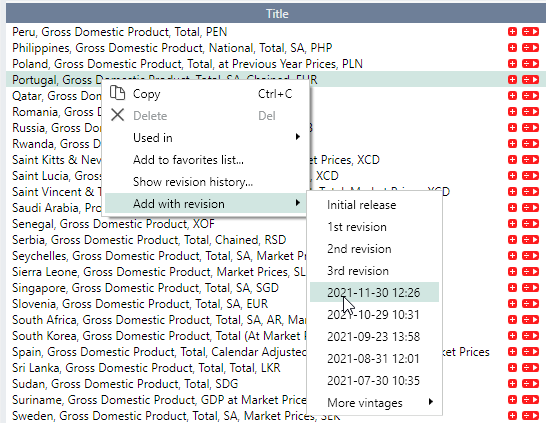
Support for Vintage in the Excel add-in All series
There is now support for time series vintages in the Excel add-in. You can select a vintage timestamp for the whole data set, or you can select a revision for specific series in the basket.
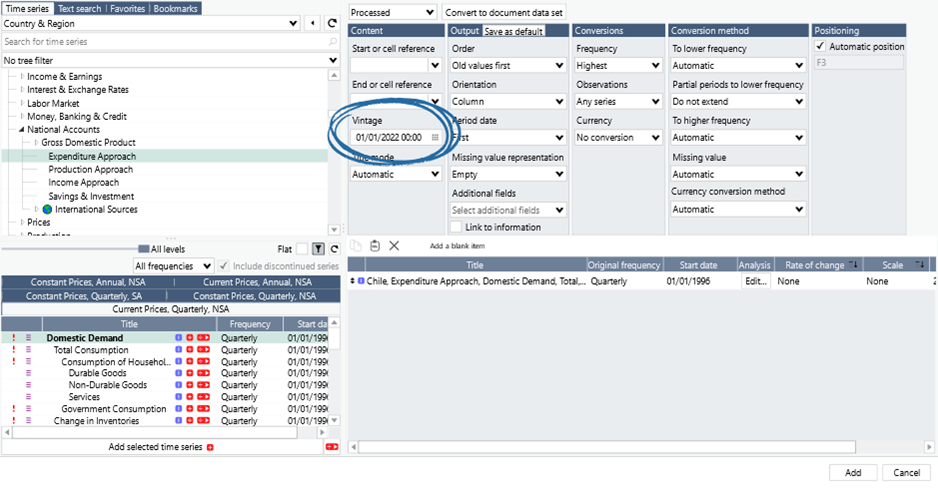
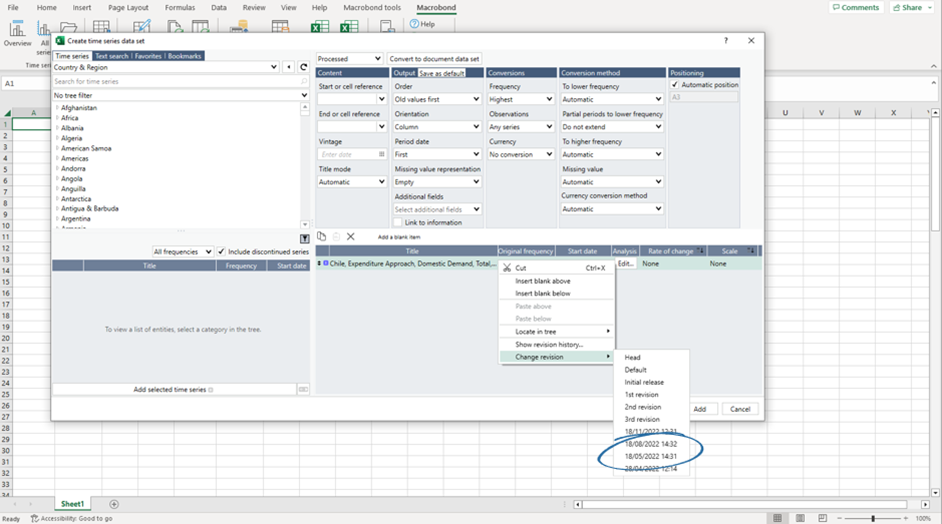
A new column called “Revision” will show what revision that will be downloaded for each series in the basket.

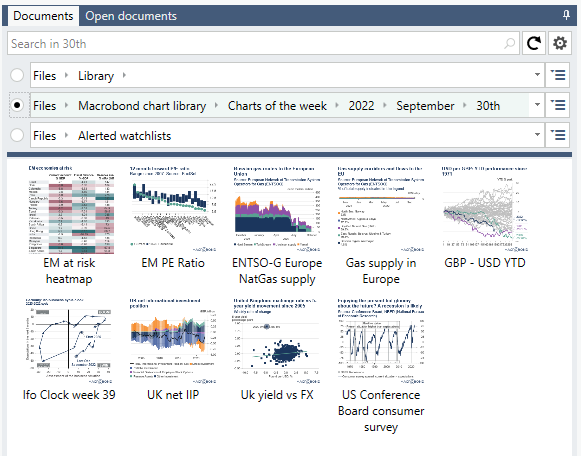
View the Macrobond chart library in the Viewer
The new crumb bars and list of open documents have been added to the Viewer product too. Another addition is that the Macrobond chart library can be accessed directly from the Viewer.
Installation
You can begin installation directly from within the application. Either by clicking on the yellow banner that appears in the application, or by going to Help|Check for update in the menu of the Macrobond application. If you have a version older than 1.24, the automatic update feature will ask you to update to 1.24.2 before it offers you to update to later versions.
If updating requires involvement from your IT department, please see the instructions provided here.
If you have asked us to contact your IT department directly for these upgrades, an email with information about upgrading to the latest version will be sent to your IT contact person. You are always welcome to contact the Macrobond team if you have any questions.
Changed requirements
- This version of the Macrobond application requires .NET Framework 4.6.2 or later. Version 4.6.2 is the oldest version supported by Microsoft.
- The application need access to communicate with three additional servers: sse.app1.macrobondfinancial.com, sse.app2.macrobondfinancial.com, sse.app3.macrobondfinancial.com. See Deploying the Macrobond application.


.png)