- Introduction
- Basic commands & functions
- Organizing your work
- Navigating
- Style & layout settings
- Change region for Presentation documents
Introduction
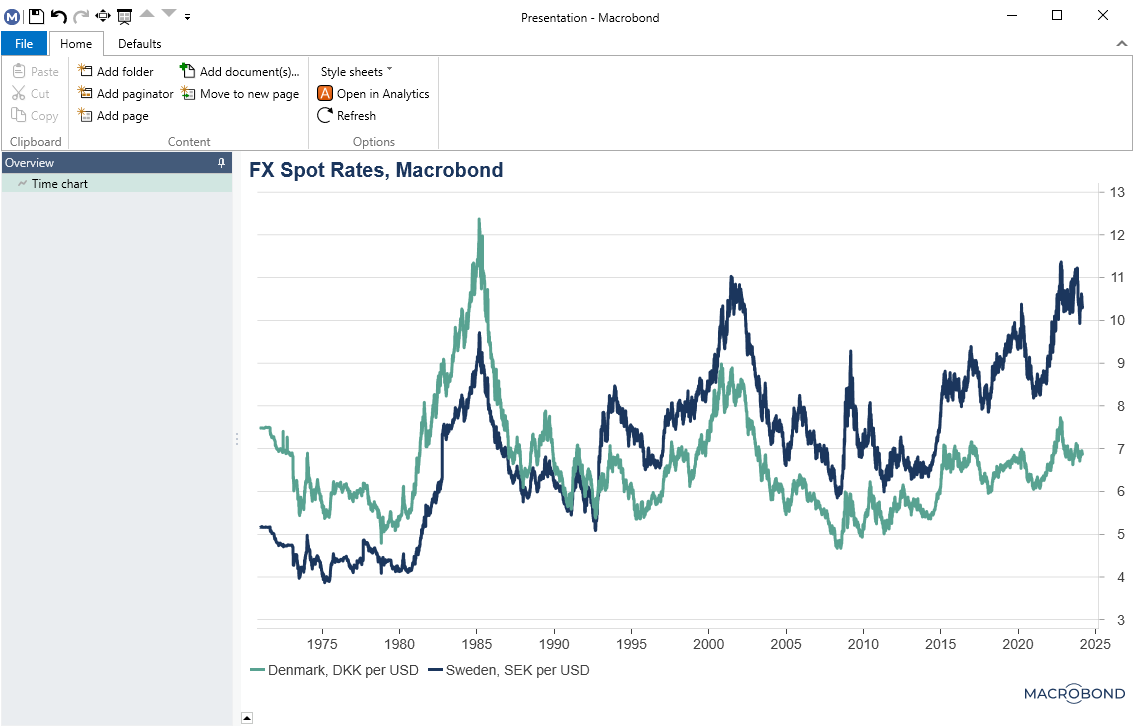
As the name suggests, Presentation documents are used to organize charts and tables so that you can easily and professionally showcase an overview of your work. The Presentation documents window opens outside the application to give you more flexibility for working with, sharing, and presenting charts. Charts can be organized by pages and in folders.
Benefits of Presentation documents
- Get an overview of multiple charts at once. You can make changes to the charts in the application and see this reflected in the Presentation document in real-time. The Presentation document window can be viewed on a second monitor to enhance your ability to work with multiple charts efficiently.
- Add and organize an unlimited number of charts from different documents in one place. Save Presentation documents for your personal use or for sharing with others. You can browse through the pages using the Page Down and Page Up keys on your keyboard.
- Print or export a Presentation document with a number of charts. This will then work as an alternative to PowerPoint.
Basic commands & functions
Create a new document
Right click on the analysis tree to open the context menu.
Click on Live chart preview (new Presentation) (before MB Analysis 1.31 In new Presentation document.)
 See here pre-1.31 version view
or, since MB Analysis 1.31 press this icon next to chart in Analysis tree:

Creating from Open documents tab
This feature is available in Macrobond Analysis 1.29 and later.
In Analytics tab > Open document you can now use multiselect. Right-click on selected charts and use Create presentation document.
Add to an existing document
Right click on the analysis tree to open the context menu. Click on Add to Presentation document.

An alternative to using the previous command is Add to documents. Using this command will allow you to add multiple presentations (charts or tables) at once. However, the default presentation for that document will always be used. You can identify which chart or table is the default by looking at what is displayed in the thumbnail.
To add a new presentation from the application select Add document(s) in the Home view of the menu bar. If there are no presentations in a document, the document will not be added, nor will this result in an error message being displayed.

Saving
To save a Presentation document, click on File, and Save, in the top menu bar.
You can save Presentation documents in your Personal account store or Company account store, just like other Macrobond documents.
Saving to the Company account store will allow you to share Presentation documents. If you share your Presentation document and it contains references to documents in your personal store, you will get a warning that other users might not be able to see all documents in your presentation.
Opening
To open a Presentation document, click on File, and Open in the top menu bar.
Select the Presentation document you would like to open from the dialogue box that appears.
You can distinguish them from other documents by the P in the lower right corner of the thumbnail, or by looking at the information in the tooltip.
Exporting your work
Printing
Click on File, and Print, from the top bar menu. In the print dialog there are options for selecting printer, paper orientation, margins, and page range.

Creating a PDF
In Windows 10 there is a built-in printer called Microsoft Print to PDF that can be used to create PDF files.
Exporting to Power Point
If you have prepared your Presentation in Macrobond but want to use it later in Power Point you can export it. To do this go to File > Export to Power Point.
To link together original charts and your presentation check last option 'Embed links to document instead of embedding a copy'. If you won't mark this, charts in presentation will be treated as a separate entity (they still can be edited).

Exporting images
With this feature you can export all (or some) charts from Presentation as an image, i.e.; as SVG. There are two important settings here:
- Pages/Individual charts - export whole pages or each chart as their own image.
- Keep file structure in export - if exporting 'Pages' this option will create a folder for each paginator, while with 'Individual charts' it will create a new folder for each paginator and page.

Updating or editing charts
To make changes to the charts in your presentation document simply edit them in the application as you normally would. The changes will be automatically reflected in any presentation the edited chart is in.
If you have linked the charts to presentation first, you will see first Referenced document information panel. Click on Open document to see the original file.

Organizing your work
Changing the order of your charts
There is a list of the charts, like a table of contents, on the left-hand side of the presentation. You can change the order of the charts by dragging them with the mouse.
Adding a page
A page is used when you want to collect several charts in one view.
In the menu bar at the top of the window, select Add page. Drag the charts in the table of contents, on the left, to the page you want to add them to.

Adding a folder
If you have many charts or pages in a single presentation document, you might want to organize them further into folders. In the menu bar at the top of the window select Add folder. Then drag charts and pages into that folder.

Adding a paginator
Adding a paginator will create a layout which will be applied to all pages below. By changing paginator layout you change, in one move, layout to all pages.
You can change the column setting under the 'table' icon.

Renaming
You can rename charts, pages, and folders in the table of contents by selecting Rename in the context menu, or by pressing F2 on your keyboard.
Navigating
Moving between pages
Using the Page Down or Page Up keys on the keyboard will take you to the next/previous page or chart that is not on a page.
Zooming in/zooming out
If you double click on a chart on a page, the chart will be displayed in full size. Backspace on the keyboard or the back button on the mouse will take you back to the page view. This is convenient if you have created a page with many small charts (using a low zoom factor). You can then double click on charts you want to take a closer look easily returning to the previous view.
Minimizing/maximizing the toolbar and Overview pane
To view the Presentation documents window with a minimized toolbar and Overview pane, press Ctrl+M on your keyboard.
Alternatively, you can select the View tab of the menu bar, and then click on the button on the left to minimize or maximize the toolbar.
Opening a chart in the application
On the context menu of a chart, you can select Open in analytics or Ctrl+Double Click, to open the linked document in the main application window.
Using embedded charts
You can use charts opened from charts embedded in Office documents or from a historic document revision in a presentation document but note that these charts can only be displayed as a single chart, and used until the window is closed. They cannot be combined with other charts, in a folder or page, and they cannot be saved.
Style & layout settings
Chart layout
The way your charts are displayed can be adjusted in the Home view of the menu bar, using the Layout, Zoom and Scale to fit options.

Layout options include:
- Single column
- Two columns
- Three columns
- Square
Selecting a zoom factor for all charts on a page will adjust the scale of the charts. For example, by setting a zoom factor below 100, such as 75 or 50, the charts will be displayed as thumbnails in the page.
To see all bar charts in the provided space, select Scale to fit, by clicking on the square icon (highlighted in blue above). This setting is also available from the Defaults view in the tool bar and can be set in a stylesheet.
Text notes
For each page you can enable Presentation notes – short text note for each chart on the page. To write one just change the option from 'Hide' to anything else and double-click on the area which will appear in presentation document.

Notes can be located above, below or on one side of the chart (either left or right). Application will adjust charts’ sizes accordingly to the chosen method (by shortening or narrowing the chart area).


To edit the text note, please click on the note and input text. After clicking on the text note, the text formatting tab will appear on the Menu bar.
Style sheet
The Style sheet settings for your Presentation documents are defined in the Macrobond application, under the activity Style sheets. You can define settings for the pages of your presentation documents, such as text styles and background color. To apply these settings, click on Style sheet in the Presentation documents toolbar.
Note: This refers to the settings of a given Presentation document and not the charts in the presentations, which have their own stylesheet settings.
Default style settings

You can define a standard layout for an entire presentation by using the Defaults tab. Settings defined here will be applied to all pages and folders of the current Presentation document.
In contrast to Style sheet, which can be reused across multiple Presentation documents, the default settings are specific to each Presentation document you create. As such, if you wish to use a default style across all pages and folders of a document, you will have to set up default settings every time you create a new document.
Pin/un-pin

Use the pin button to override the default style settings. This allows you to use a standard style across an entire document but change the settings for specific pages where needed.
To make use of this function, type the relevant values into the fields you would like to change. Then click on the 'pin' to lock the settings and override the default. 'Pin' buttons are located both in the Home view and Defaults view of the tool bar.
Change region for Presentation documents
If you go to upper menu’s File > Open document and open a Presentation document, you can use Change region and duplicate on it. It will create new Presentation with new underlying documents in the indicated place.
Note, it will change all series in Presentation into chosen country equivalents (if they are available).