Introduction
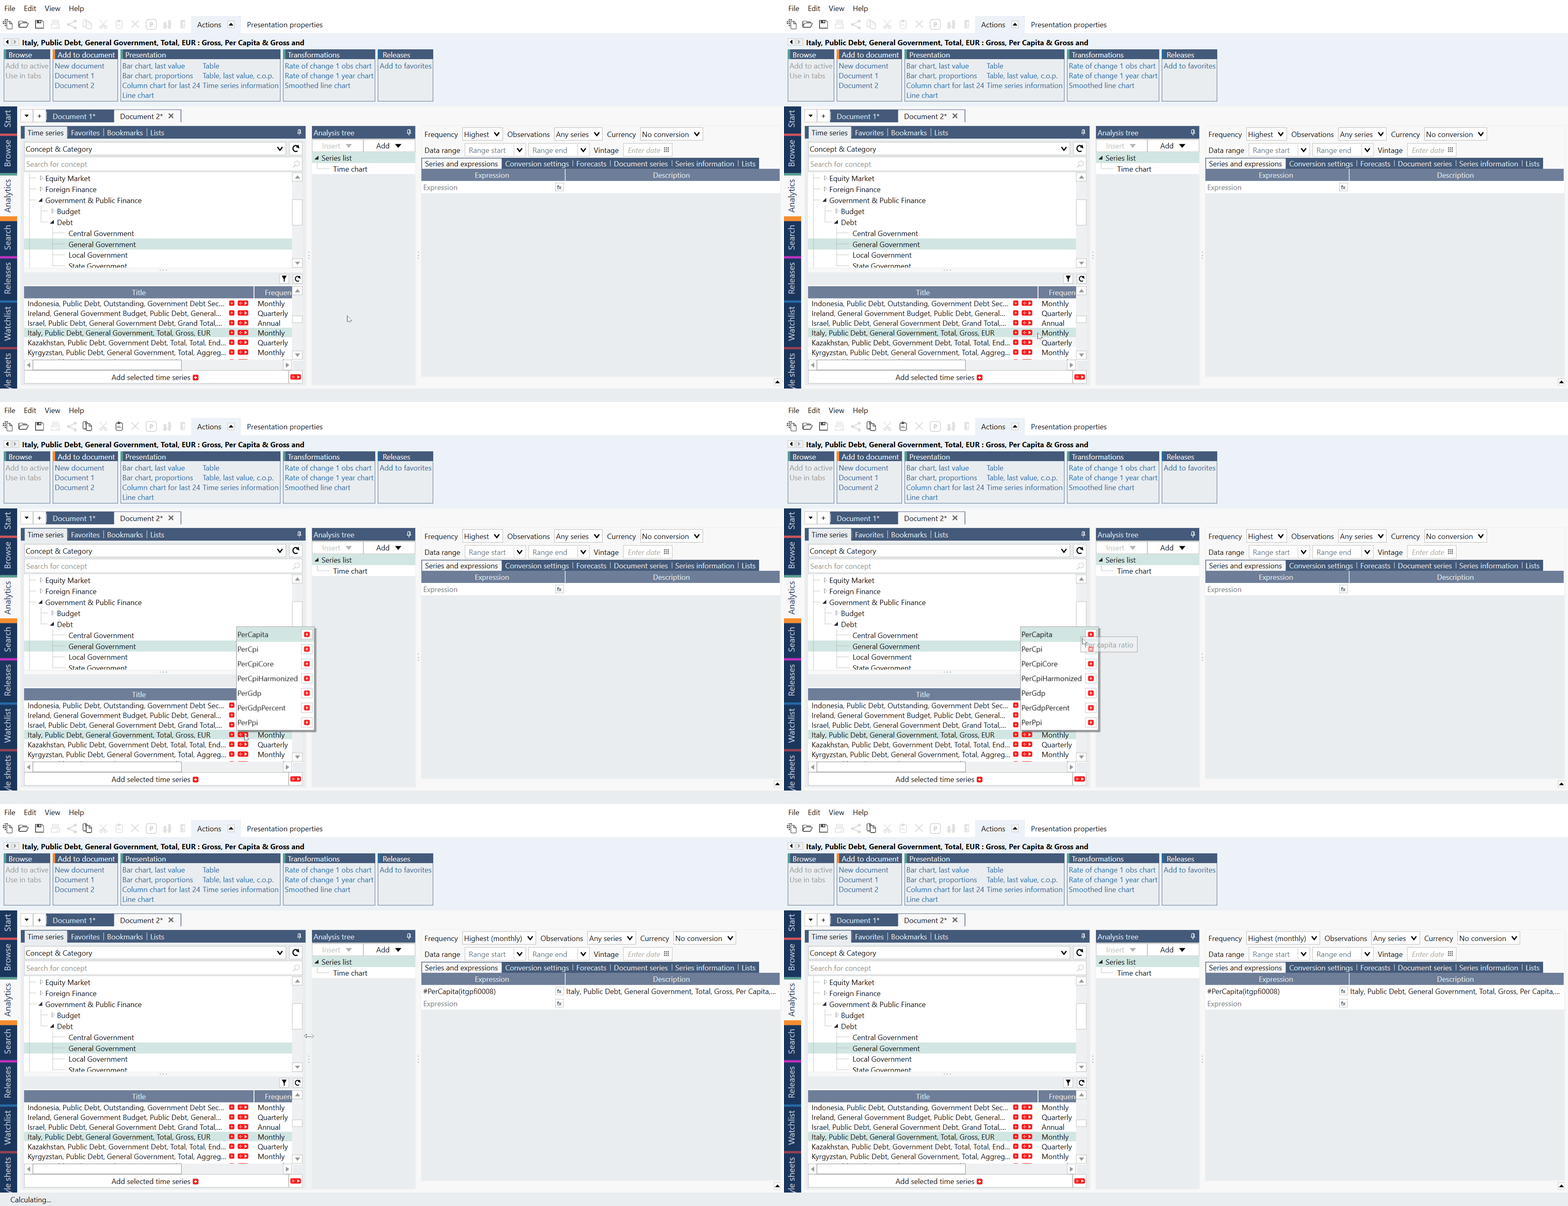
With the Ratios feature, you can have most series as divided by common rations such as GDP or population in your Series list by a simple click of a button. This feature works for regions where Macrobond have identified the required key series for the denominator. You can select it from within Search tab or Browse tab:
You can also add the expression in the Series list - it is represented with a series expression like:
#PerGdp(series)
If you want to see underlying calculation behind the ratio, go to the Series information tab in Series list, right click on the series and select 'View calculations'. This will open a new tab in Analytics with a snapshot of the calculated series document containing the calculation. You have the option to save this as a real calculated in-house series if you like.
Ratio behaves like a time series, they have fixed frequency and attributes.
Benefits of using Ratios
Using the Ratio feature has several advantages:
- It can happen that sources do not calculate such ratios themselves (example: Current Account as % of GDP). Therefore, such series are not available in Macrobond and need to be calculated by you. Ratios allow you to perform this calculation with one click.
- Ratios can be performed on multiple series at once.
- You save a lot of time on deciding on the best possible combination of the underlying series.
Types of ratios
Using the Ratio feature, with one click you can create a ratio expressing the relation of a series of your choice to one of the following, predefined indicators:
#PerCapita(series)
It divides the selected series by the population of this series’ Region.
#PerGdp(series)
It divides the series by the GDP value, in current prices, of this series’ Region.
#PerGdpPercent(series)
It divides the series by the GDP value, in current prices, of this series’ Region and sets the result as a percentage.
#PerCpi(series)
It deflates the selected series by the headline CPI of this series’ Region.
#PerCpiCore(series)
It deflates the selected series by the core CPI of this series’ Region.
#PerCpiHarmonized(series)
It deflates the selected series by the harmonized CPI of this series’ Region.
#PerPpi(series)
It deflates the selected series by the PPI of this series’ Region.
How it works?
PerCapita
- Macrobond uses the series of the variable that has the same frequency as the nominator, where the source is indicated. If there is no match, it uses a series with the closest higher frequency. If there is no match neither, as a last resort, it uses a series with the closest lower frequency.
- If the series from point 1) has shorter history than the numerator, Macrobond looks for all the series with longer history. If any of them can be found, Macrobond uses the one closest in frequency (higher frequency is preferred) and extends the series from point 1) using the formula function JoinMoreHistoryScaled().
- If the series from point 1) covers more future observations than the numerator, Macrobond looks for all series that covers more future observations. If any of them can be found, Macrobond uses the one closest in frequency (higher frequency is preferred) and extends the series from point 2) using the formula function JoinScaledAppend().
- For the denominator, Macrobond sets the frequency conversion to Interpolate and sets the Partial period method to Rate of change.
PerGDP & PerGDPPercent
- First, Macrobond tries to find a series that has the same or higher frequency from the source. If this is not available, a lower frequency is used.
- Macrobond tries to match the seasonality of the numerator from the database. If the numerator is seasonally adjusted, but there is no adjusted series from the source, it seasonally adjusts the denominator. If the numerator is not seasonally adjusted, but the source only offers adjusted series, Macrobond seasonally adjust the numerator.
- If the numerator is a flow series, Macrobond converts it from annual rate in case they are of different frequency or if only one of them is expressed in this way.
- If the numerator is not a flow series, Macrobond annualizes the denominator, if it is not already in annual rate, by multiplying by the number of observations per year.
- When doing seasonal adjustments, the Seasonal adjustment Census X-13 analysis is used if the series is quarterly or monthly. If the series is annual, Macrobond does not add any seasonal adjustment. In all other cases the Moving Average version of the seasonal adjustment is used.
- If the GDP series ends earlier than the numerator, the formula function ExtendLastYoYForecast() is used to extend the series.
- Finally, the numerator is converted to the same currency as the denominator.
- The PerGDPPercent version follows the same methodology, but the result is then multiplied by 100 and the unit is set to “percent”.
PerCPI, PerCPICore, PerCPIHarmonized, PerPPI
- First, Macrobond tries to find a series that has the same or higher frequency from the source. If this is not available, a lower frequency is used.
- Macrobond tries to match the seasonality of the numerator from the database. If the numerator is seasonally adjusted, but there is no adjusted series from the source, it seasonally adjusts the denominator. If the numerator is not seasonally adjusted, but the source only offers adjusted series, Macrobond seasonally adjust the numerator.
- When doing seasonal adjustments, the Seasonal adjustment Census X-13 analysis is used if the series is quarterly or monthly. If the series is annual, Macrobond does not add any seasonal adjustment. In all other cases the Moving Average version of the seasonal adjustment is used.
- When the price index series is chosen and seasonally adjusted (if applicable), the price index series is divided by ‘100’.
- There are no limitations to what series that can be divided by the price denominators, even data published in real, volume, terms can be divided by these ratios.
- If the frequency of the numerator is lower, the price index series is averaged. If the frequency is higher, the price index series is linearly interpolated.
Other macros
#Annual(series)
It turns series into Annual frequency with last value in a year and extends last, incomplete year. It doesn't change frequency of the document.
#DeAnnualRate(series)
It divides the series by the observation count per year and sets the result as a Flow series.
#SA(series)
It applies seasonal adjustment from Census board X-13. It truncates the data to fit it into model so output is limited to 82 years.
You can combine macros:
#PerGdpPercent(#Annual(debopa0256))
Settings
Frequency conversion
Like any Macrobond document, all series used in the Ratio will be expressed in the same frequency. By default, the document will use the frequency of the series of your choice for which you would like to create a Ratio.
For example, if you want to calculate a ratio of GDP Per Capita with quarterly frequency, you can select a quarterly GDP flow series and divide it by an annual population stock series (using the PerCapita ratio).
By default, Flows series are converted to a higher frequency by aggregating their data points, and stock series by interpolation.
Missing Data
Sometimes, when selected series have different frequencies or one of them is lagging towards the other, the application extends the shorter series by using the ExtendLastYoYForecast() formula function.
Seasonal adjustment
This choice depends on your chosen series for which you want to create a ratio. If you choose a seasonally adjusted series the application matches it with an existing (official) seasonally adjusted series, where it is possible. If not, seasonal adjustments are calculated in the application.
Currency conversion
By design, the ratio follows the currency of the denominator.
Additional settings
- Extend partial periods setting is always set to automatic for the denominator series.
- The frequency of the calculation is set to that of the numerator.
- Annual rate is removed in case series are of different frequency or if only one of them is expressed in this way.
- The result should not be associated with any currency.
How to apply a ratio?
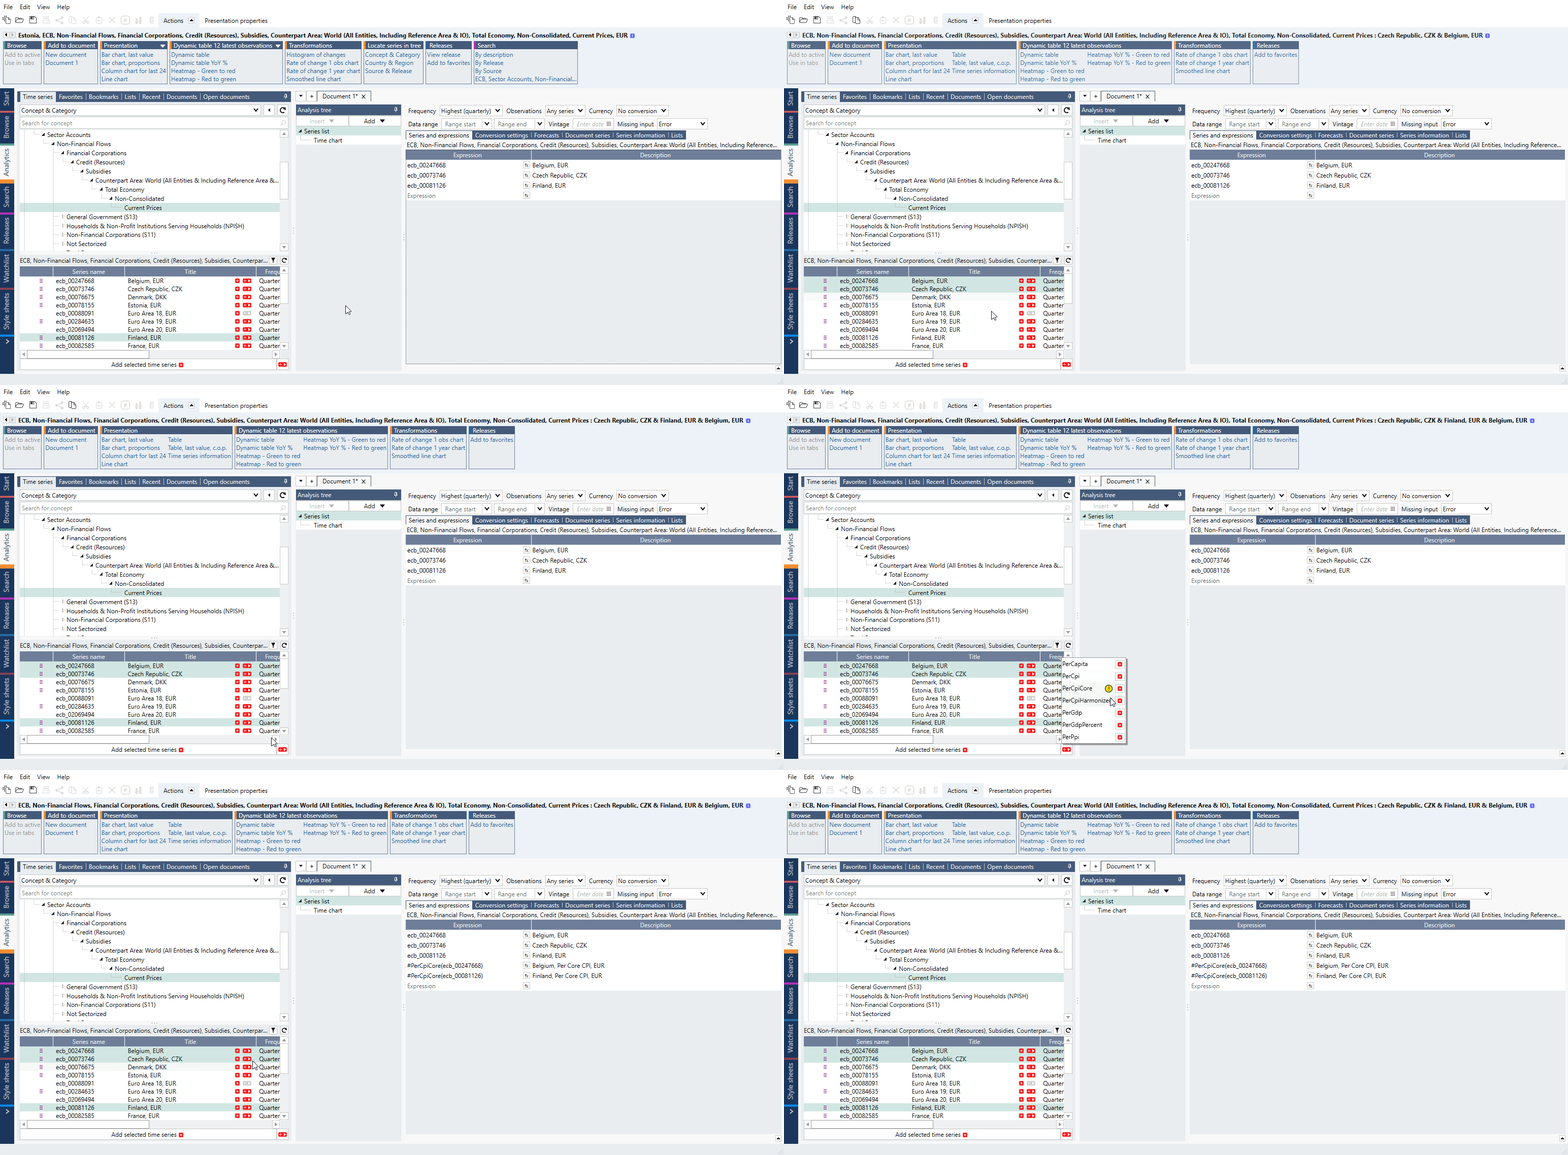
Find series in data-tree, select second red button next to it and from drop-down menu choose one of the ratios. Press on '÷ >' sign and a ratio will be added to your chart.

When you have more than one series use the '÷ >' sign next to 'Add selected time series'. If some series do not have option for particular Ratio you will be informed with exclamation sign on yellow dot.

You can also type it in manually. For more information about types see Types of ratios.
Checking calculation behind a ratio
Behind each ratio there is a calculation with predefined series as denominator and additional formulas. To see the calculation, go to Series information tab on Series list. Right-click on series and select View calculation. New file will open and you will see full formula for selected ratio.

If you want to change the calculation and use it elsewhere, type in changes and save calculation as Calculated in-house series.