Overview
Example of general use of Sorting analysis (also Lists, data Concepts and Cross sampling) to show how to sort two data set by values of one of them:
The Sorting analysis ranks the values of a series in an ascending or descending order. It’s most useful after calculating output series using another analysis such as Scalar or Cross section. You can then use sorting to rank categories and for arranging output series order.
Settings

Direction
Here, set the order in which values of the series are sorted. When you have one input series, you have the options of Ascending and Descending.
When working with multiple series, you can select a main series to rank, and sort the other series by the sorting off the main series. You can do so by selecting 'by [series name]' under direction.
Observation limit
This sets the limit for the number of 'items' (i.e., observations or categories) to which the sorting should be applied.
This is very useful when you only want to display a smaller number of observations / categories than you have in the document.
Example: In a document containing 50 series, you would set the observation limit to 10 if you only want to display the top ten observations.
Missing values
You can choose to exclude values that are missing values in the master series by selecting this option.
Examples
Here, we created two category series using the scalar analysis, one with the last available values and one with the values at 2015. We sorted the last available values series in descending order and sorted the second series by the order set for the first series.
See solutions for getting top X categories while using Descending order in Sorting analysis.
Questions
- Why I see numbers instead of categories?
- How to show the top 10 highest values in Descending order?
- I set Observation limit number but it doesn't work?
Why I see numbers instead of categories?
Sorting analysis needs to have all data sets pointed in some way, it can't be left with 'None'. If one data set has Direction set to Ascending/Descending, then the other(s) data set must follow that one:

How to show the top 10 highest values in Descending order?
For Category chart 'Limit' is always calculated from the right, and for Bar chart from the bottom.
There are three solutions:
- Sorting after Sorting (recommended) - use first analysis with Ascending order to filter out top 10, and second analysis to reverse the order to Descending.
- Flip sorting - change the presentation's order in the chart from Descending to Ascending.
- Display range (only Category chart) - sort without the limit and set display range on axis.
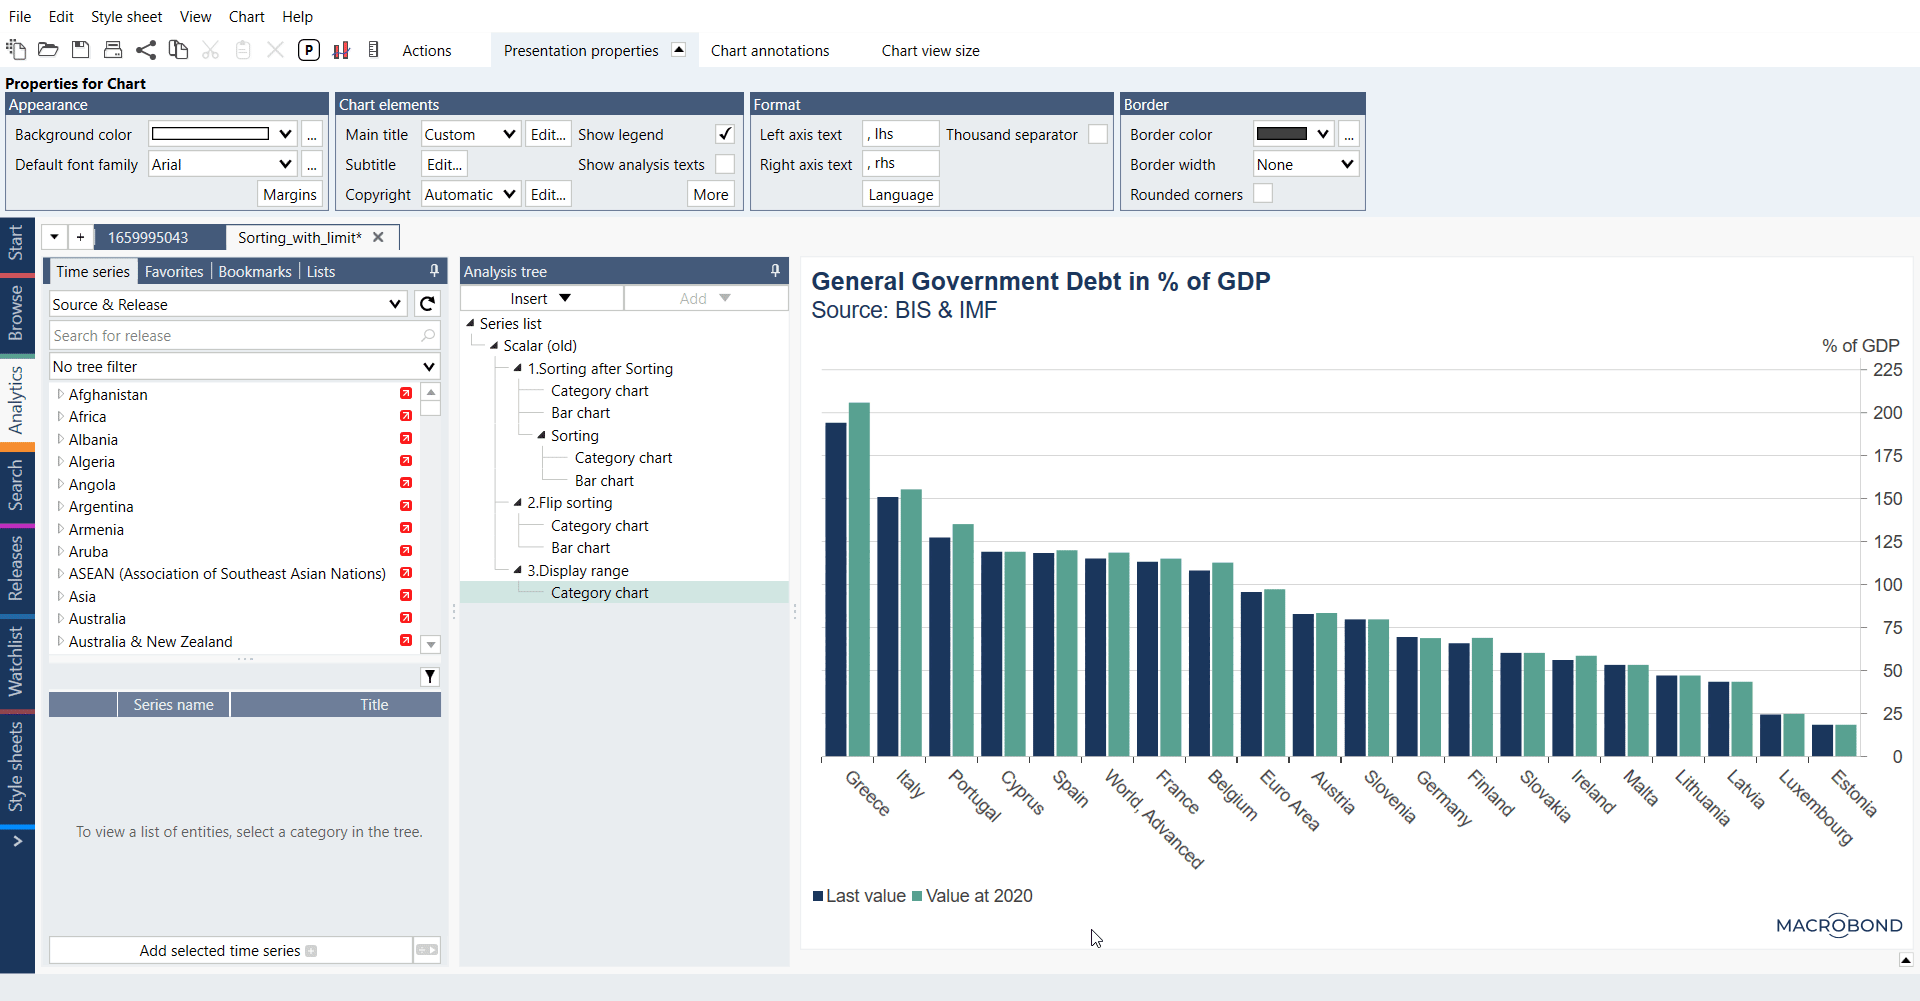
See these examples in a file Sorting with limit.
I set Observation limit number but it doesn't work?
You need to set Observation limit to all data sets:

Please use down arrow next to column's name to apply value to all fields below.