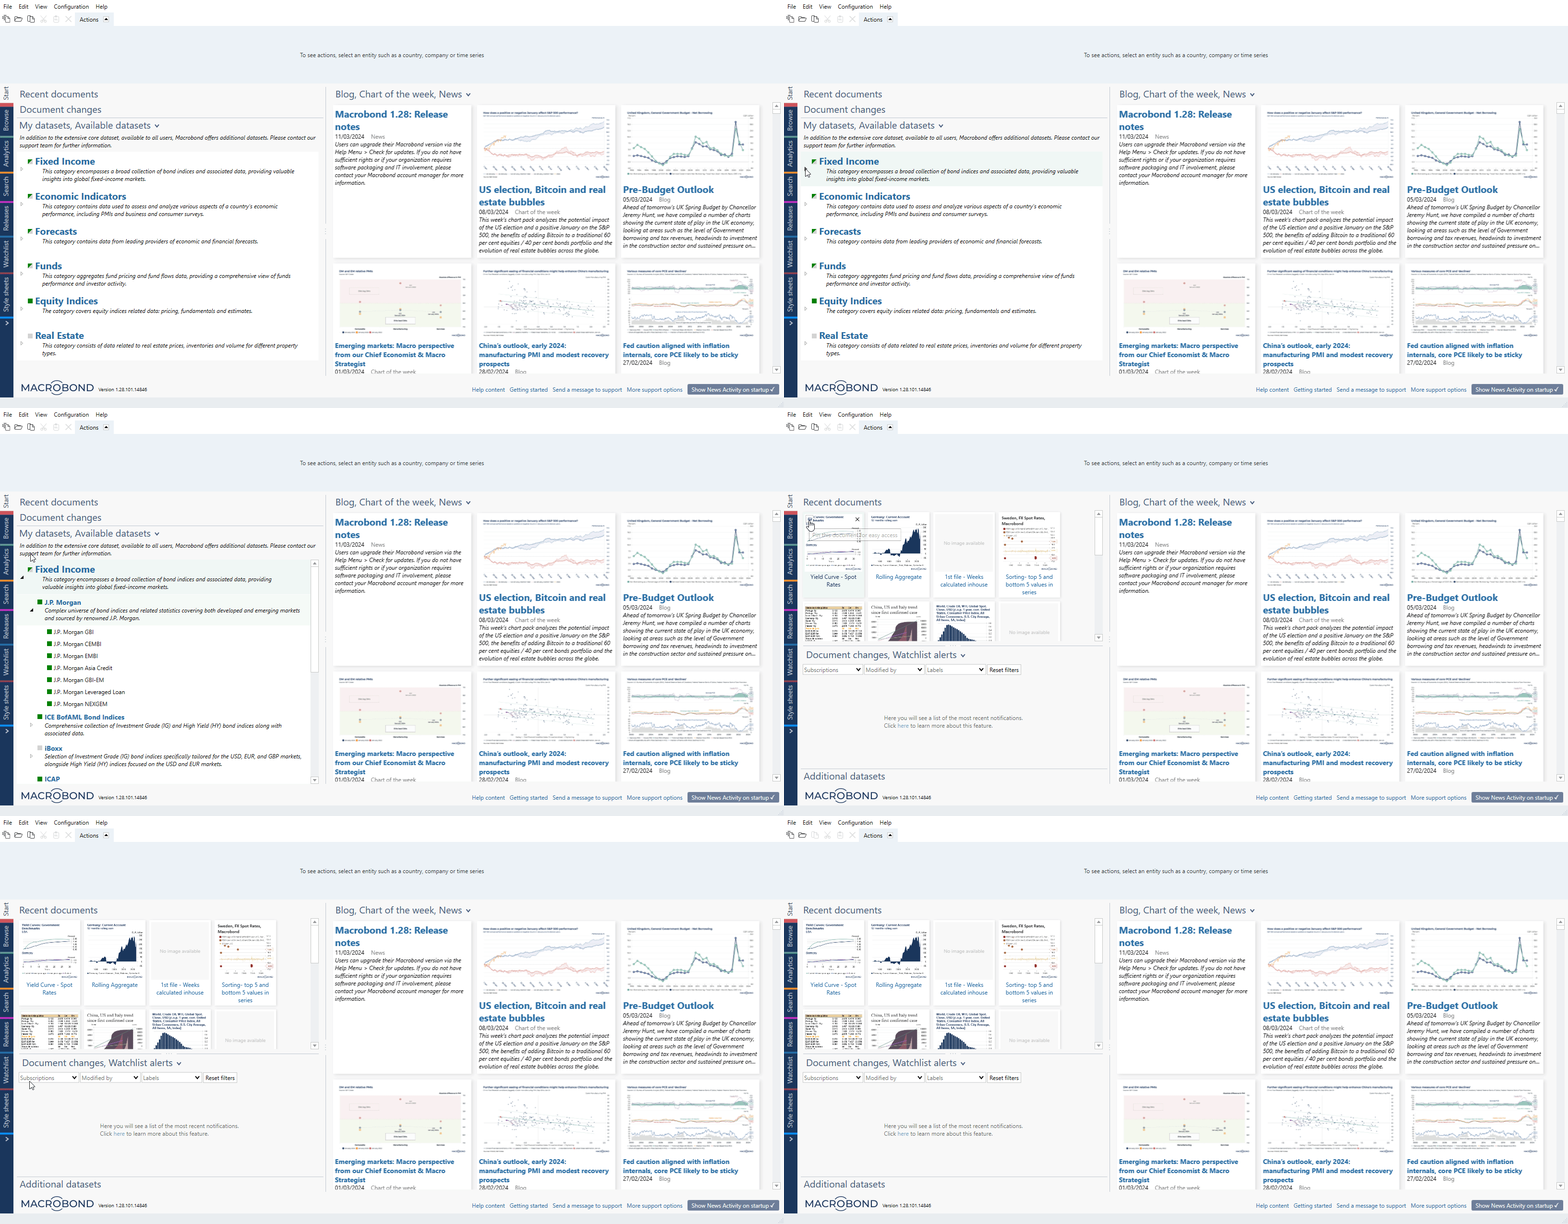
To make working in the application as easy as possible, we created activities. You can find the activity tabs on the left side of the screen. Consider each activity tab to be the ideal space to complete specific types of tasks.
When you select one of these activity tabs, you open the tools you need for that task. We like the activities because they keep things simple and save space required to work in the application. So, what does each activity do?
Start
The Start activity page is divided into three sections, 'Recent documents', 'Document changes, Watchlist alerts', 'Additional datasets' and 'Blog, Chart of the week, News' areas. After clicking on 'Blog, Chart of the week, News' you can select which topics you want to see in this section. In the right bottom corner you may find links to user guides and support. For more see Start – overview .
Analytics
The Analytics activity is the powerhouse of the application. In Analytics, you can find and add time series to a document, create and apply calculations and analyses, and generate different charts and tables. We call these presentations. You can also use the editing tools here - to customize the layout and formatting of your presentations. For more see Analytics – overview, Finding data, Analyzing data and Charting.
Releases
Use the Releases tab to stay up to date on data release events from the different sources in the database. For more see Releases – overview and In Releases activity tab.
Watchlist
This activity can be used to create a customized list of documents you want to monitor, to see when the data within the document is updated or is scheduled to be updated. For more see Watchlist – overview and Watchlist.
Flexi tab
The seventh and final activity tab allows you define a default activity for that tab yourself. The activity is defined by selecting one of the four options from the pop-up menu below the tab, which are referred to as secondary activities. For more see Flexi Tab – overview.
Browse
Selecting the Browse activity allows you to easily find, compare and visualize time series from the database. Browse is particularly effective in making quick and easy comparisons of the same indicators between countries. For more see Browse activity tab.
Browsing through time series is integrated into Analytics tab.
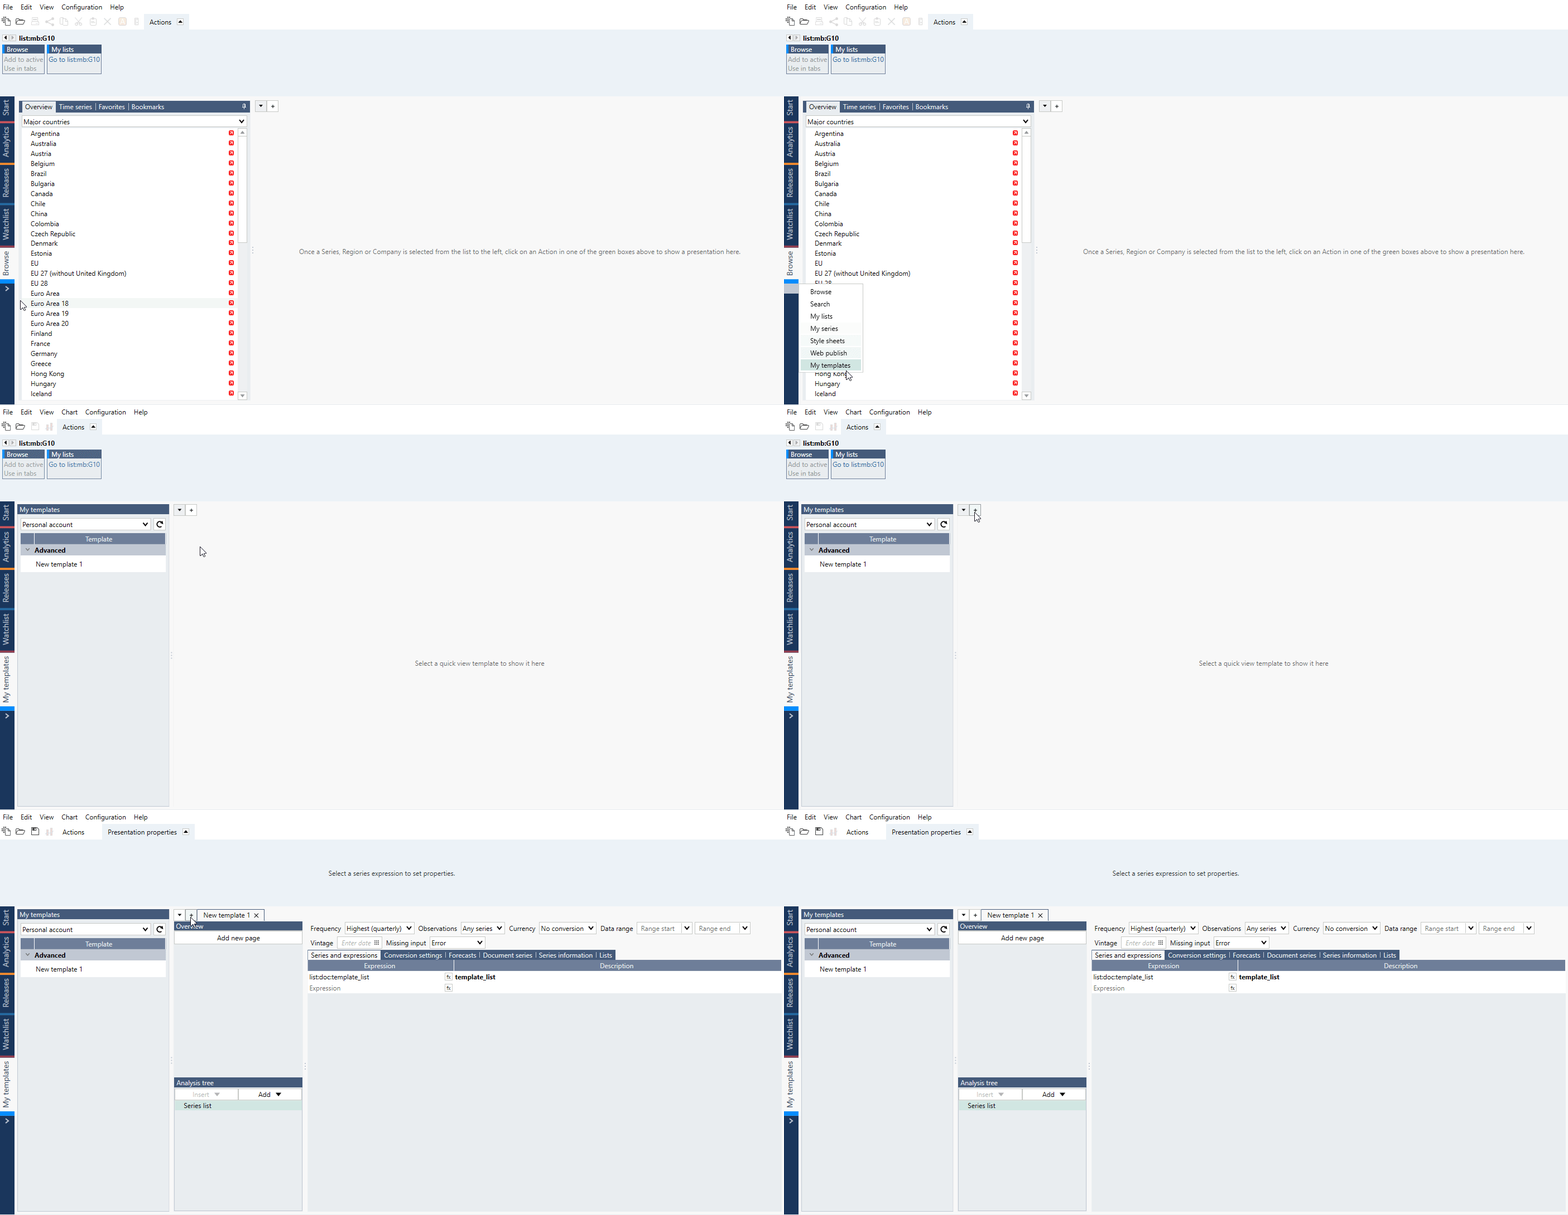
Since version 1.30 Browse tab’s Overview functions were overtaken by Quick View functionality with addition of My templates tab in 1.31.
Search
In Search, you can use keywords or our metadata to find time series across all the databases in the application. Search is available as a separate tab and and as a panel in Analytics tab. For more see In Search activity tab.
My lists
In this tab you can create list of series or list of regions the use them in analyses or to search for indicators. You can store your lists just like your in-house series - on Personal, Department or Company account. List can then be used in other documents and be shared with your colleagues. For more see My lists activity tab.
My series
You'll find the secondary activities from the pop up menu below the tab. Select this activity to upload external data to create and edit your own time series. These time series can be used in all the same ways as the Macrobond time series, as well as being combined with them. For more see Integrating and using external data (My series activity tab).
Style sheet
In the Style sheets activity, you can predefine settings for the layout and formatting of your charts. Applying a style sheet creates a consistent look for charts and tables as per your specifications. For more see Style sheet.
Web publish
The Web publish tab provides you with a simple way of publishing Macrobond charts online, for example to blogs, websites or social media channels. Charts can either be published as static or dynamic. For more see Web Publish.
My templates
This feature is available in Macrobond 1.31 and later.
A dedicated activity, called My templates is now available to create your own Quick Views. Quick View was designed to enhance reviewing and comparing series. With My template you can now create your own combinations of calculations, charts and tables. For more information see: Quick view & My templates tab.

