Skip to content

Macrobond Help

  • Application Overview
  • Q&A
  • User Guide
  • Test your skills
  • Analyses
  • Charts
  • APIs/Feeds/Connectors
  • Technical information
  • Legal
  • Support

Pictograms

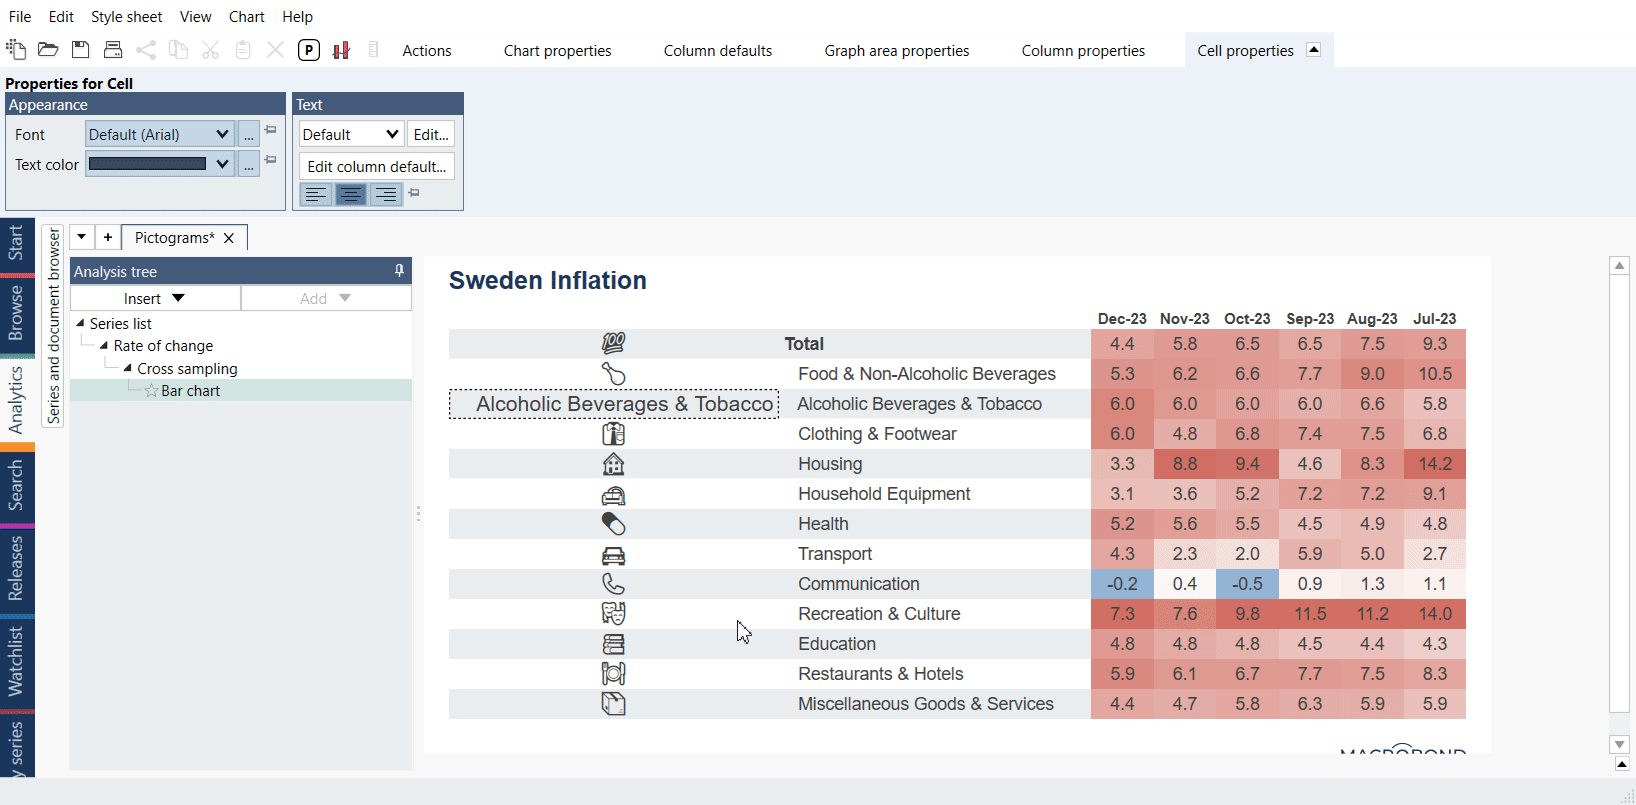
If you have ever seen Wingdings fonts you know that in text fields you can also add pictures/glyphs. In Macrobond files you can also copy-paste monochromatic Unicode symbols and pictograms.

How to add a pictogram to chart?

Find a webpage or even pdf file with Unicode pictograms. For example see UTF8icons.com or unicode.com charts section with PDFs. Copy the image and paste it in a chart.

Example - Heatmap with pictograms

Tags: pictogramsymbol

Contents

  • Finding data
  • Analyzing data
  • Charting
    • Charting – overview
    • Displaying data on a chart
    • Types of charts
    • Elements of the chart
      • Editing text parts of chart
      • Annotations
      • Axis & Scale
      • Border, Grid & Margin
      • Colors & Patterns
      • Dynamic text
      • Font
      • Labels
      • Language on chart
      • Legend
      • Logo & Copyright
      • Pictograms
      • Recession bands (Fill range)
      • Tooltip
    • Style sheet
    • Chart view size
  • Publishing & saving your work

Related material

  • Symbol chart from bar chart (mini pie charts) 1 tag related Chart types
  • Application Overview
  • Q&A
  • User Guide
  • Test your skills
  • Analyses
  • Charts
  • APIs/Feeds/Connectors
  • Technical information
  • Legal
  • Support
Macrobond Help © Macrobond Financial AB