Improved Series Search
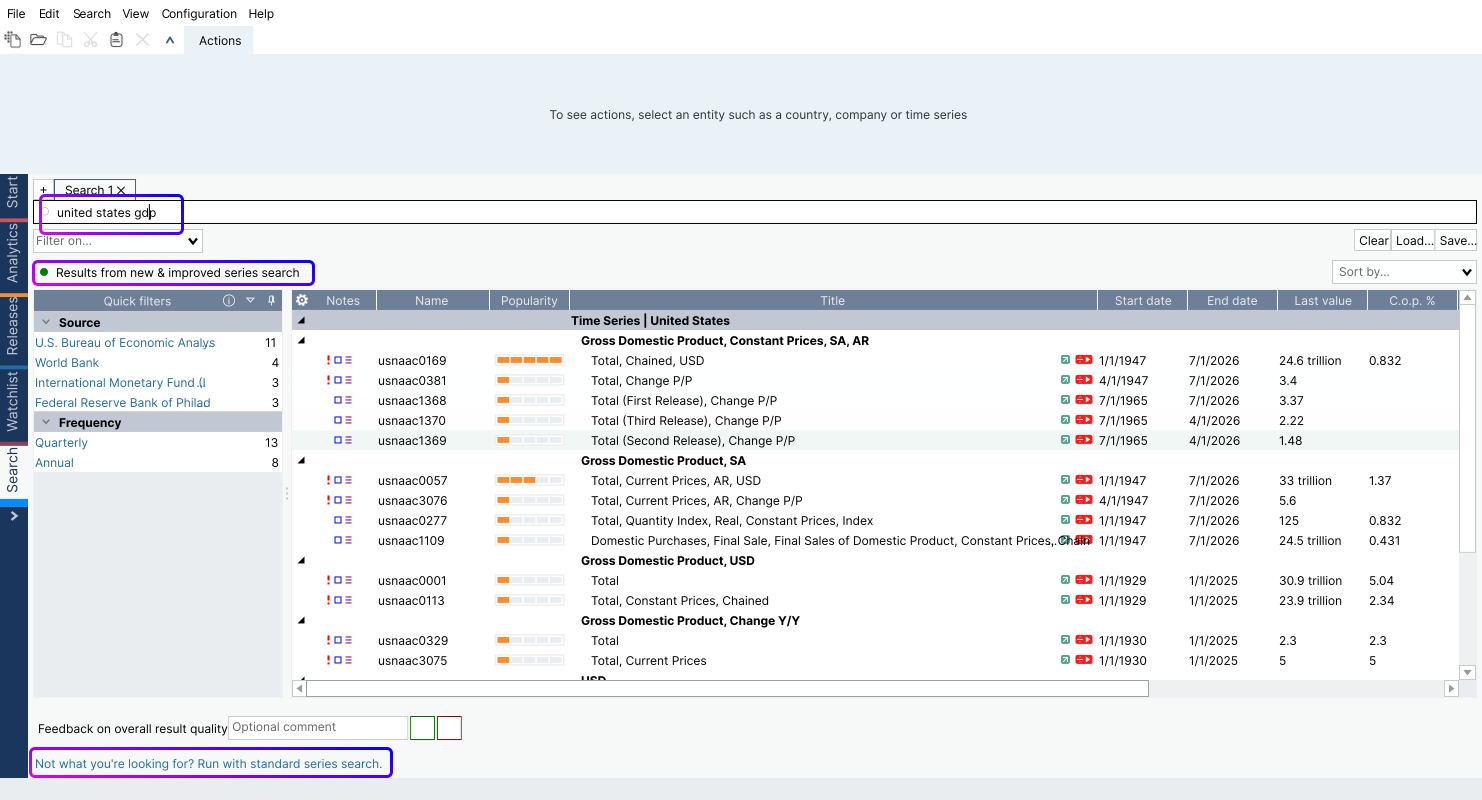
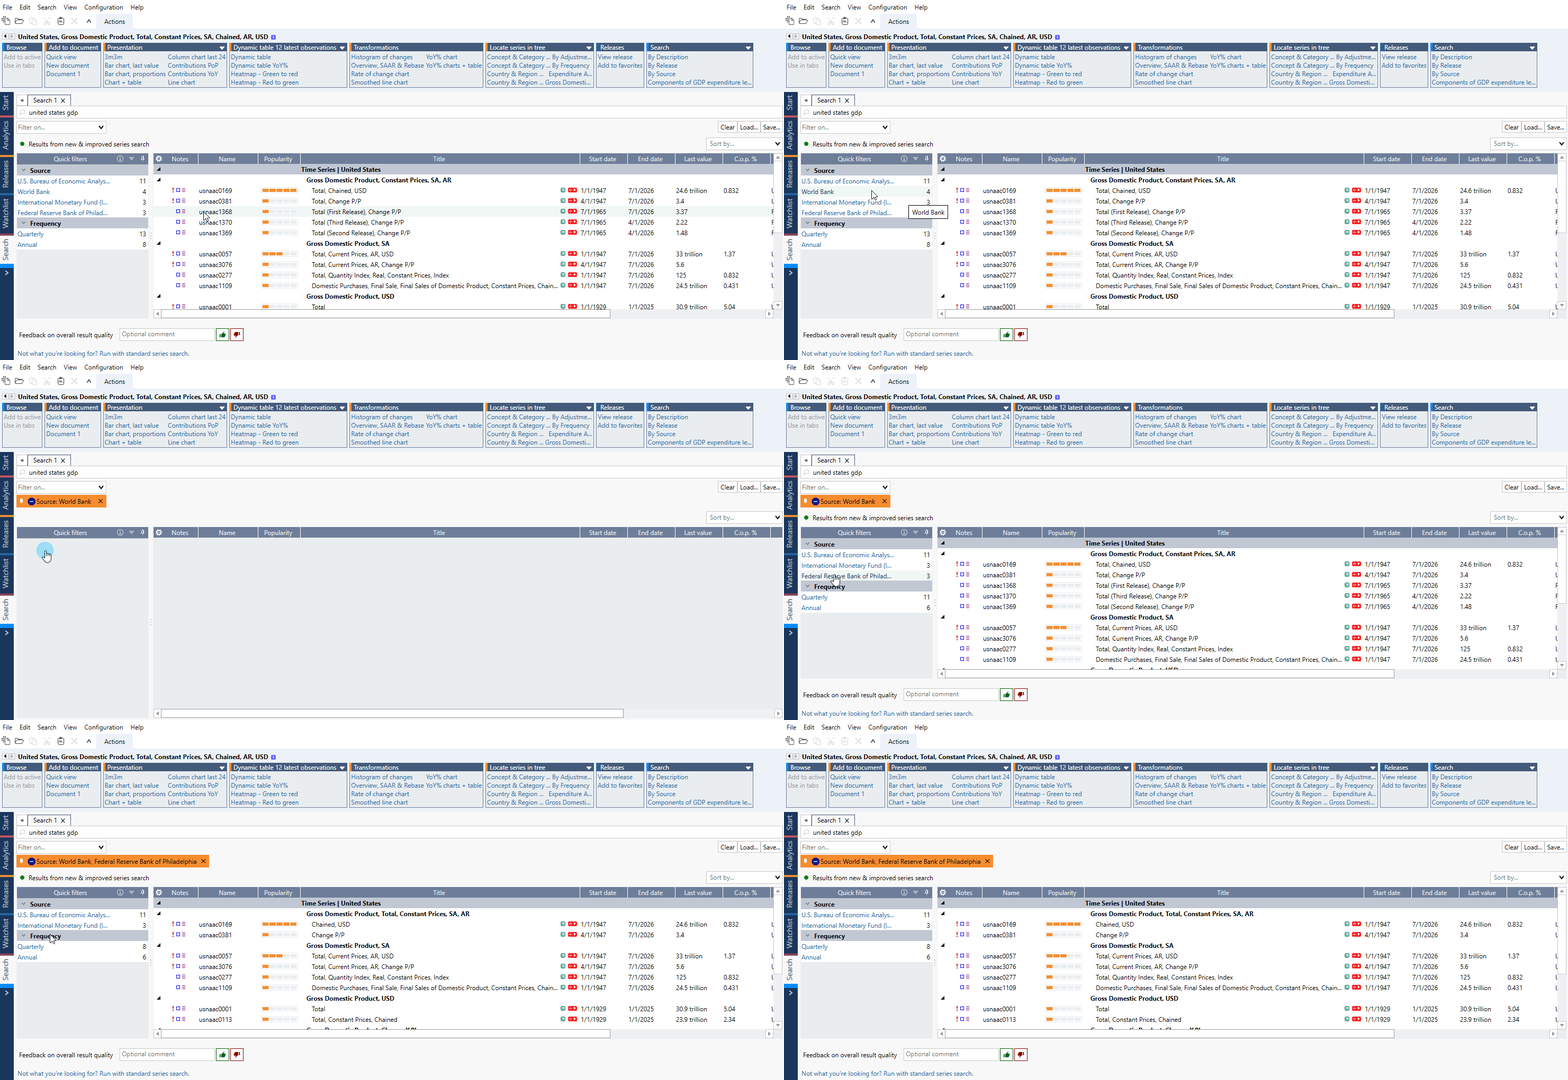
Macrobond Analysis 1.35 provides an improved series search for the most common indicators. Users can now search using Country + Indicator, making it easier to find relevant economic data.
The economic indicators currently in scope include:
- GDP
- Industrial Production Index
- Unemployment Rate
- Current Account Balance
- Policy Rate
- Core CPI
- CPI
- External Trade Balance
- Consumer Confidence Index
- Business Confidence Index
- PMIs
- Housing Price Index
Coming Soon: over time we will collect feedback from users in the new in-app form to ensure we continue to expand the coverage and improve the experience.
Improvements to Series Lifecycle Management
Office Add-in discontinued-series transparency
Users have greater visibility of discontinued series in Microsoft Office, helping them identify charts and datasets that may contain outdated data.
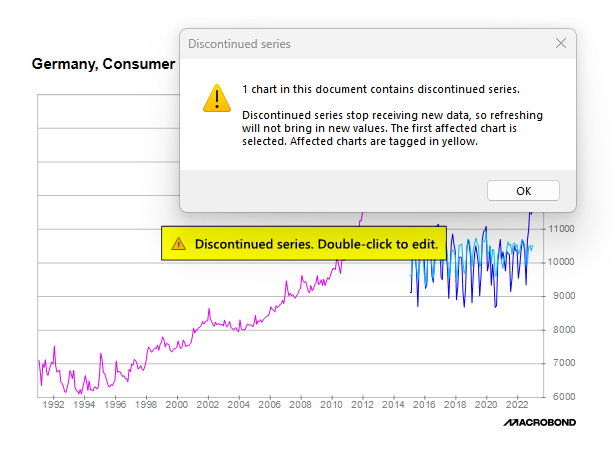
Under the Macrobond tab, there is a new button that allows you to check for discontinued series. After clicking the button, if there are impacted charts you will see a pop up warning and each impacted chart will show a yellow warning.

Double click the yellow warning to be brought into Analysis where you can review further by clicking the yellow banner above the chart:
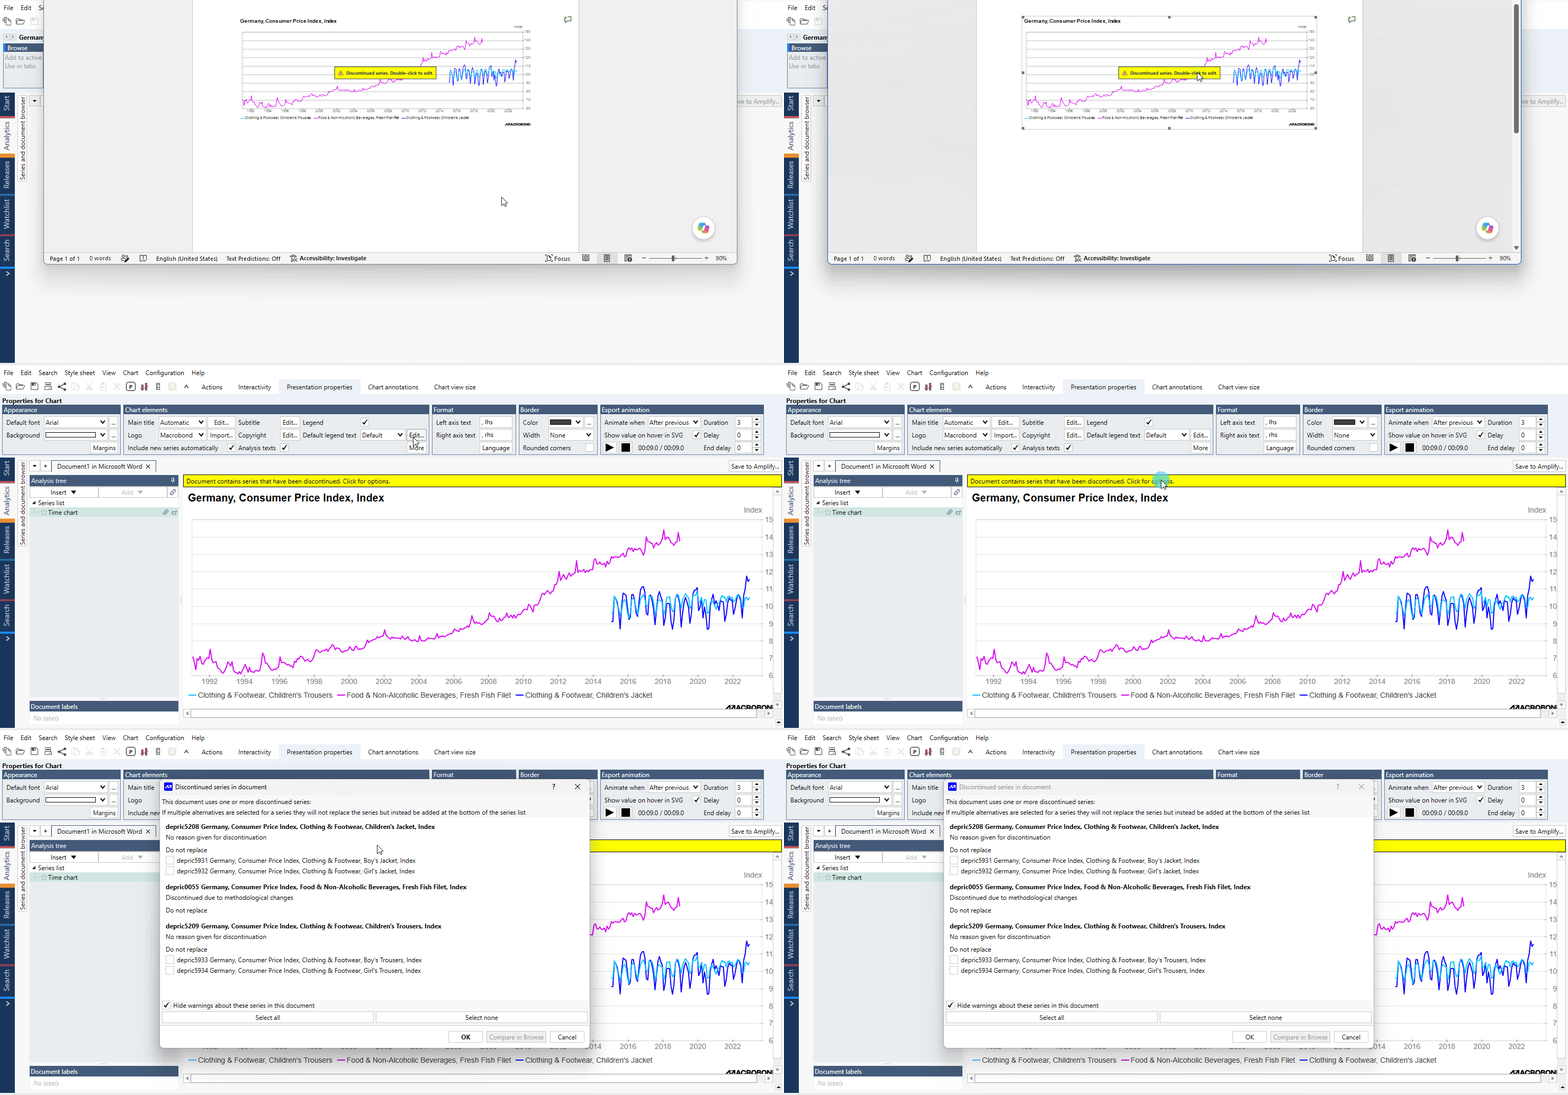
If you would rather spend time on reviewing the affected series later and want to revert the view to remove the warnings, simply click “refresh charts” and all warnings will be removed.
Multi-link series replacement
Multiple replacement series can now be selected for a discontinued series. When multiple series are selected, they are added to the series list without replacing the original series. The option to select a single replacement series remains available.
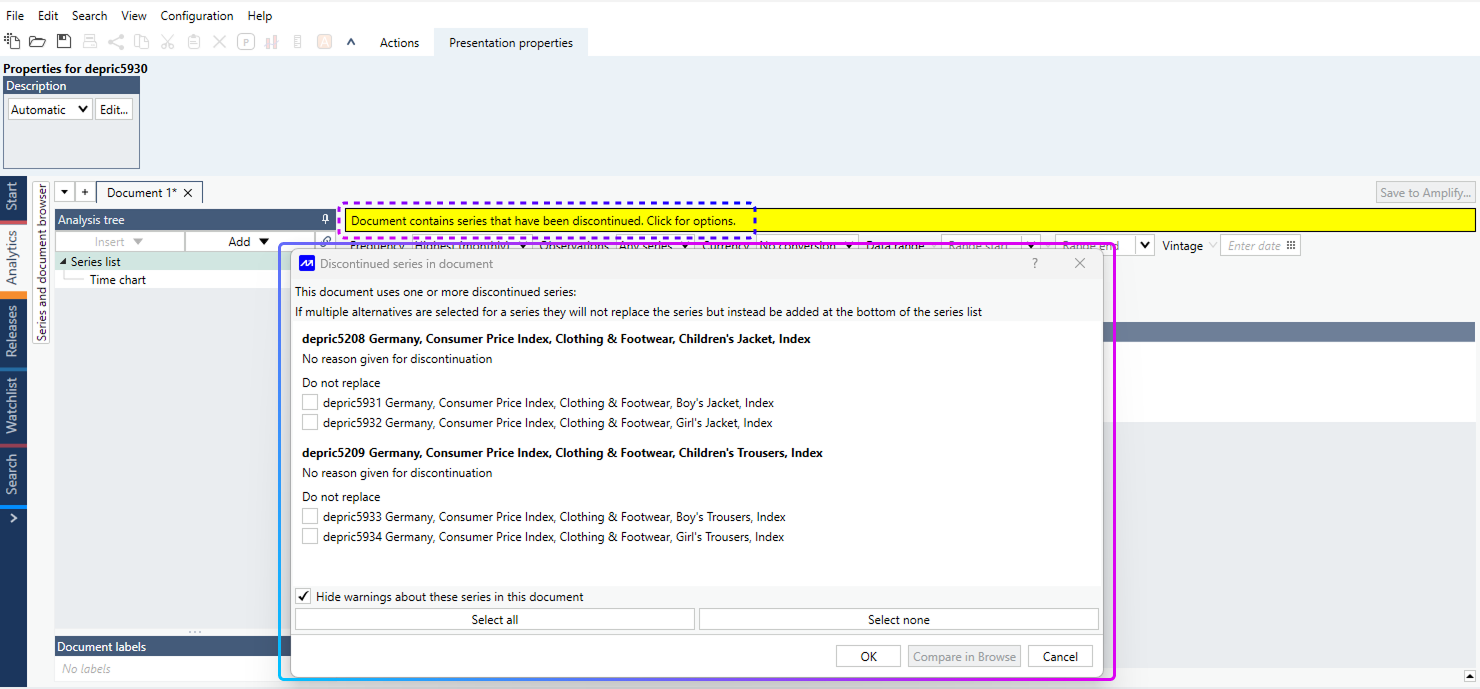
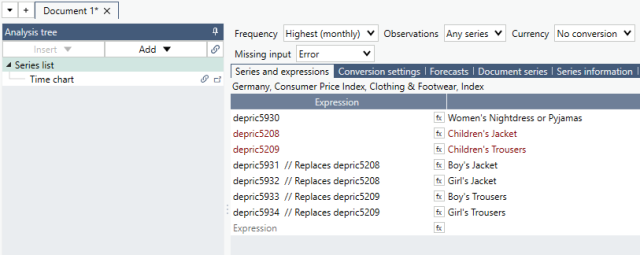
In the series list, discontinued series are in red and replacement series include a reference to the discontinued series for full transparency:
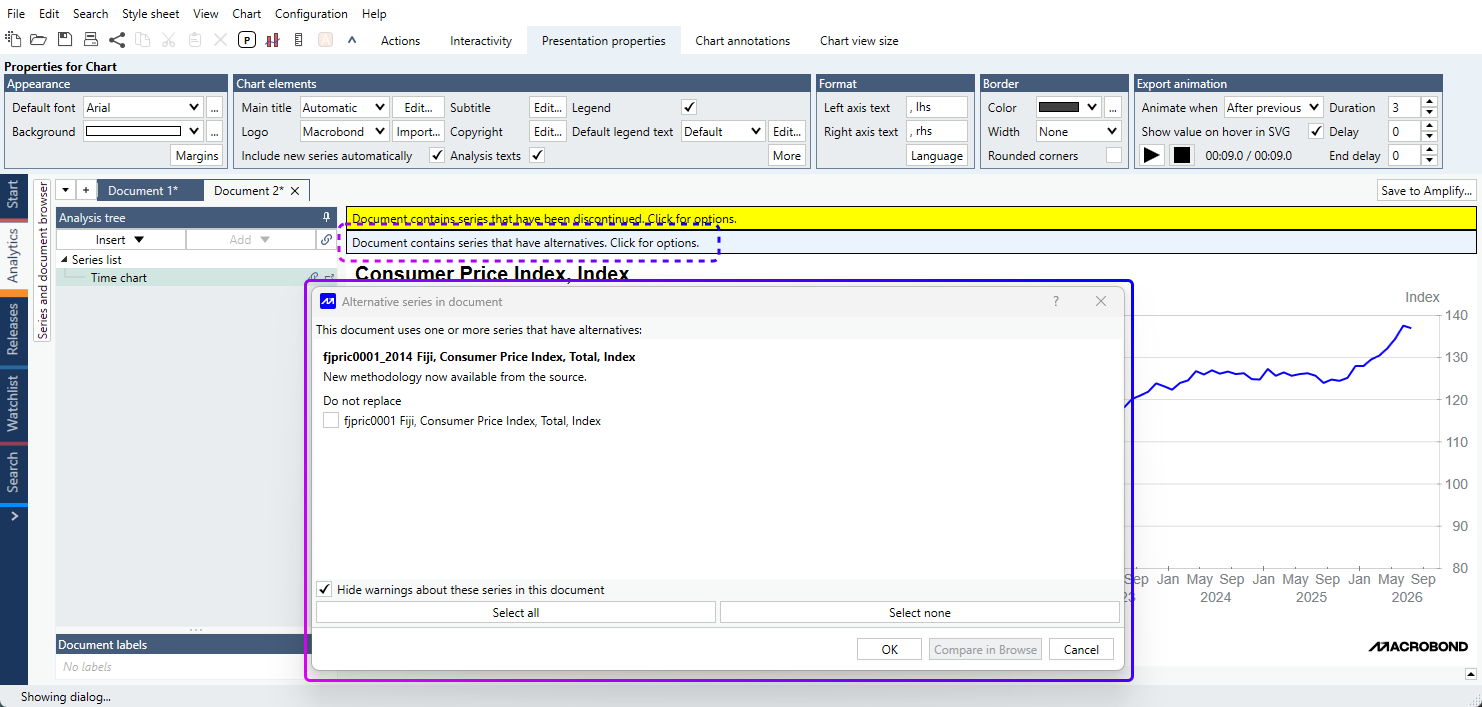
Alternatives for active series
Active series can now display available alternatives, making it easier to identify and select another relevant series.
Simplified User Experience
Add to a presentation
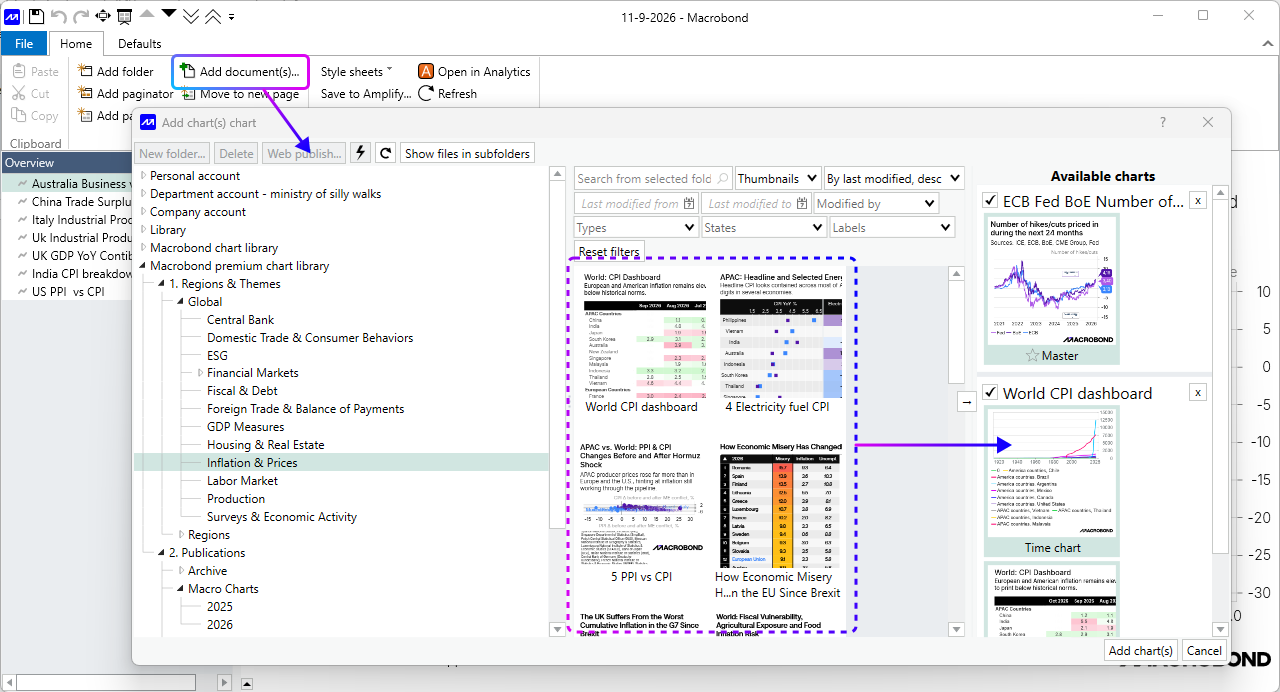
The document picker now allows users to select one or more charts when adding content to a presentation. Double-click a document to select it, then select the charts you want to add to the presentation.
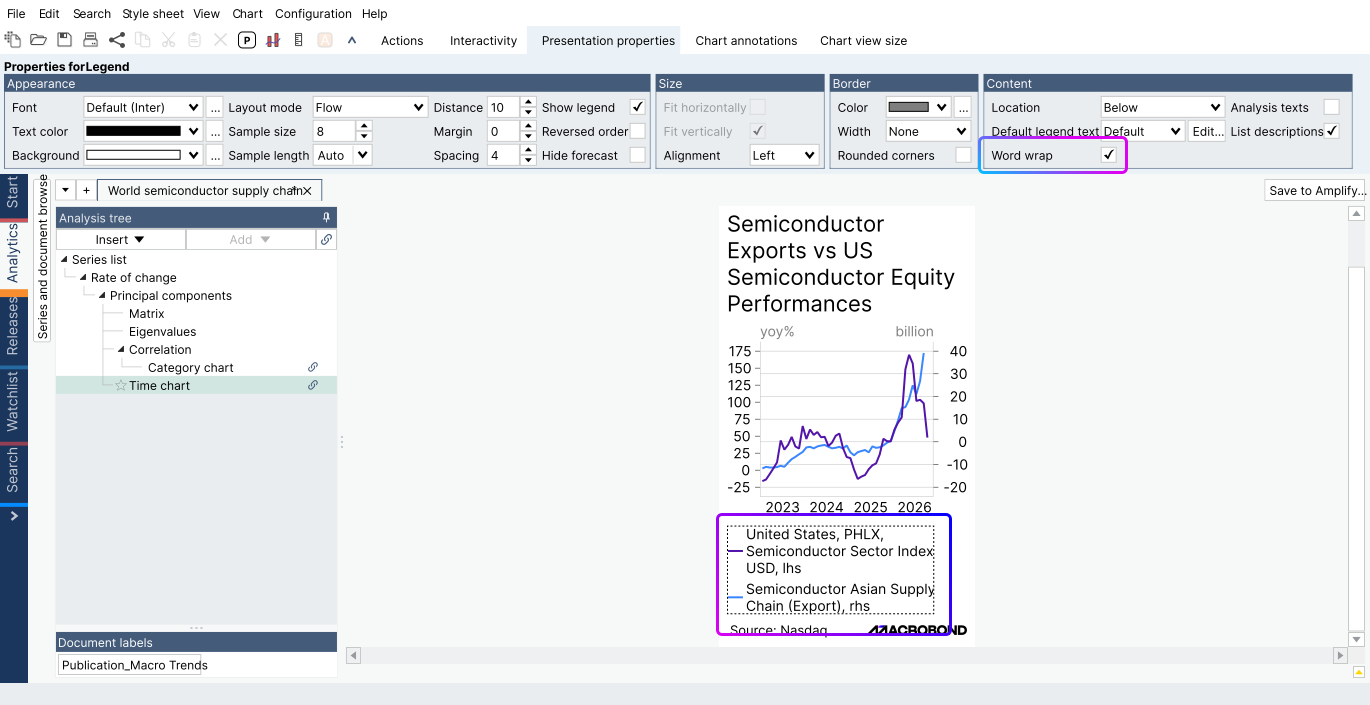
Legend word wrap
A “Word Wrap” option allows legend text to break onto multiple lines when space is limited.
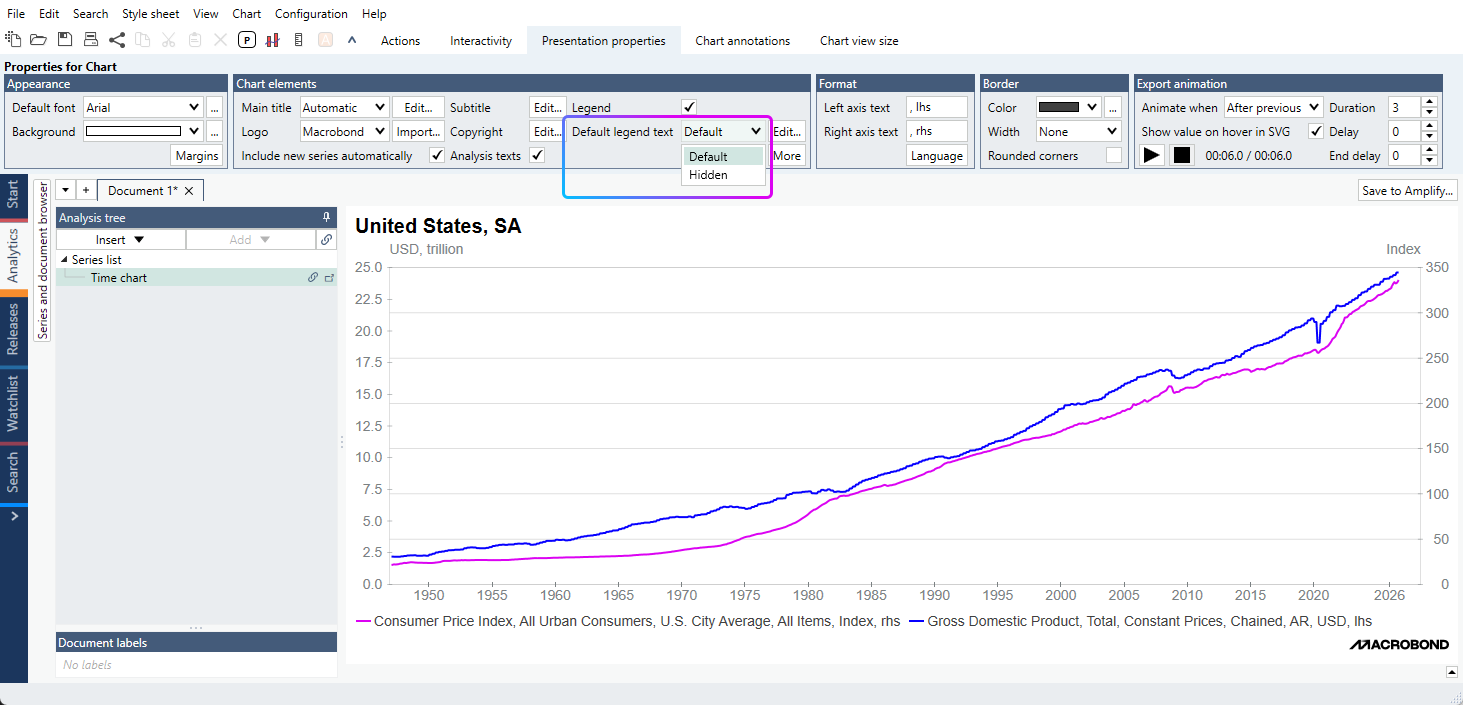
Hidden legend by default
Legends can now be hidden by default, giving users more control over how legends are displayed in charts. The setting is preserved when the document is closed and reopened.
Click Esc on the keyboard to bring back the properties settings.
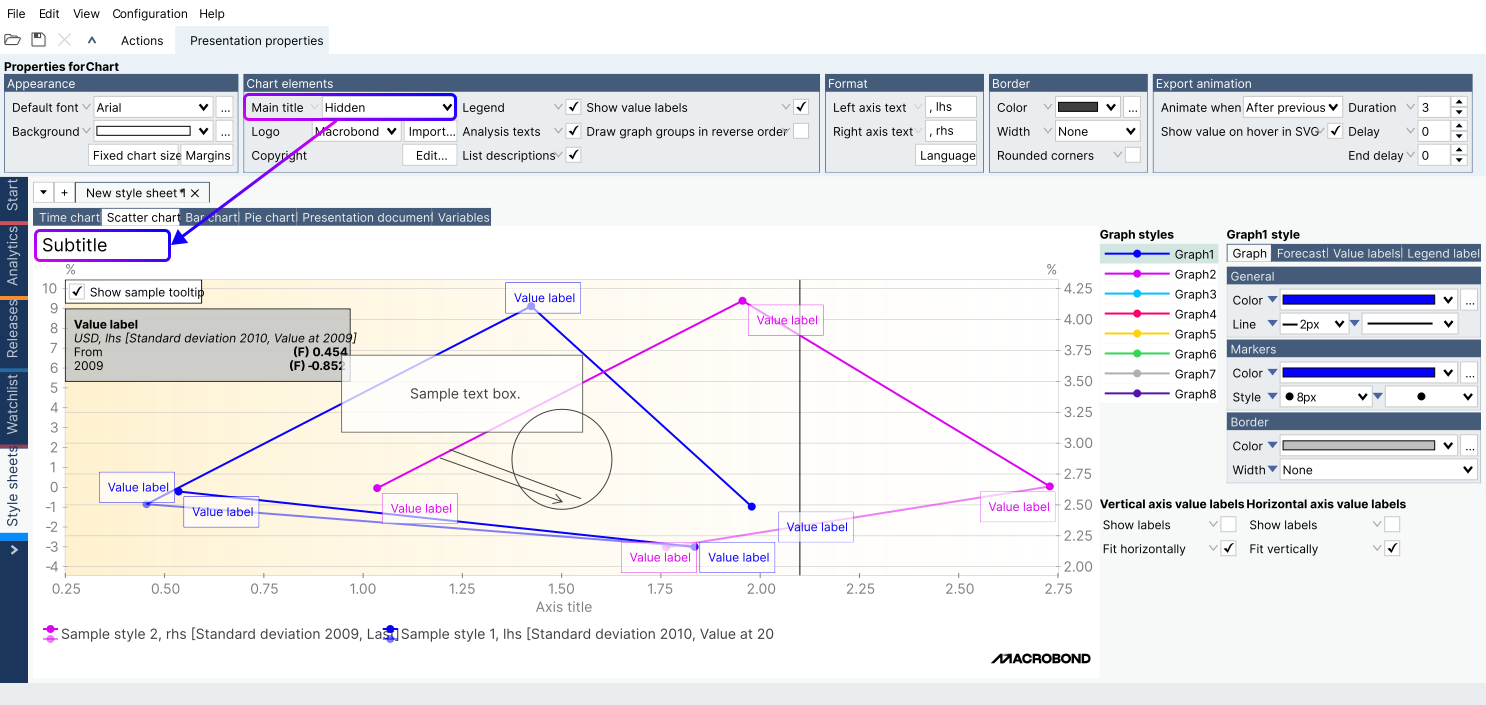
Main and axis titles hidden via stylesheet
Main and axis titles can be hidden by default through a stylesheet. This applies to main titles across all chart types and to axis titles in Time and Scatter charts.
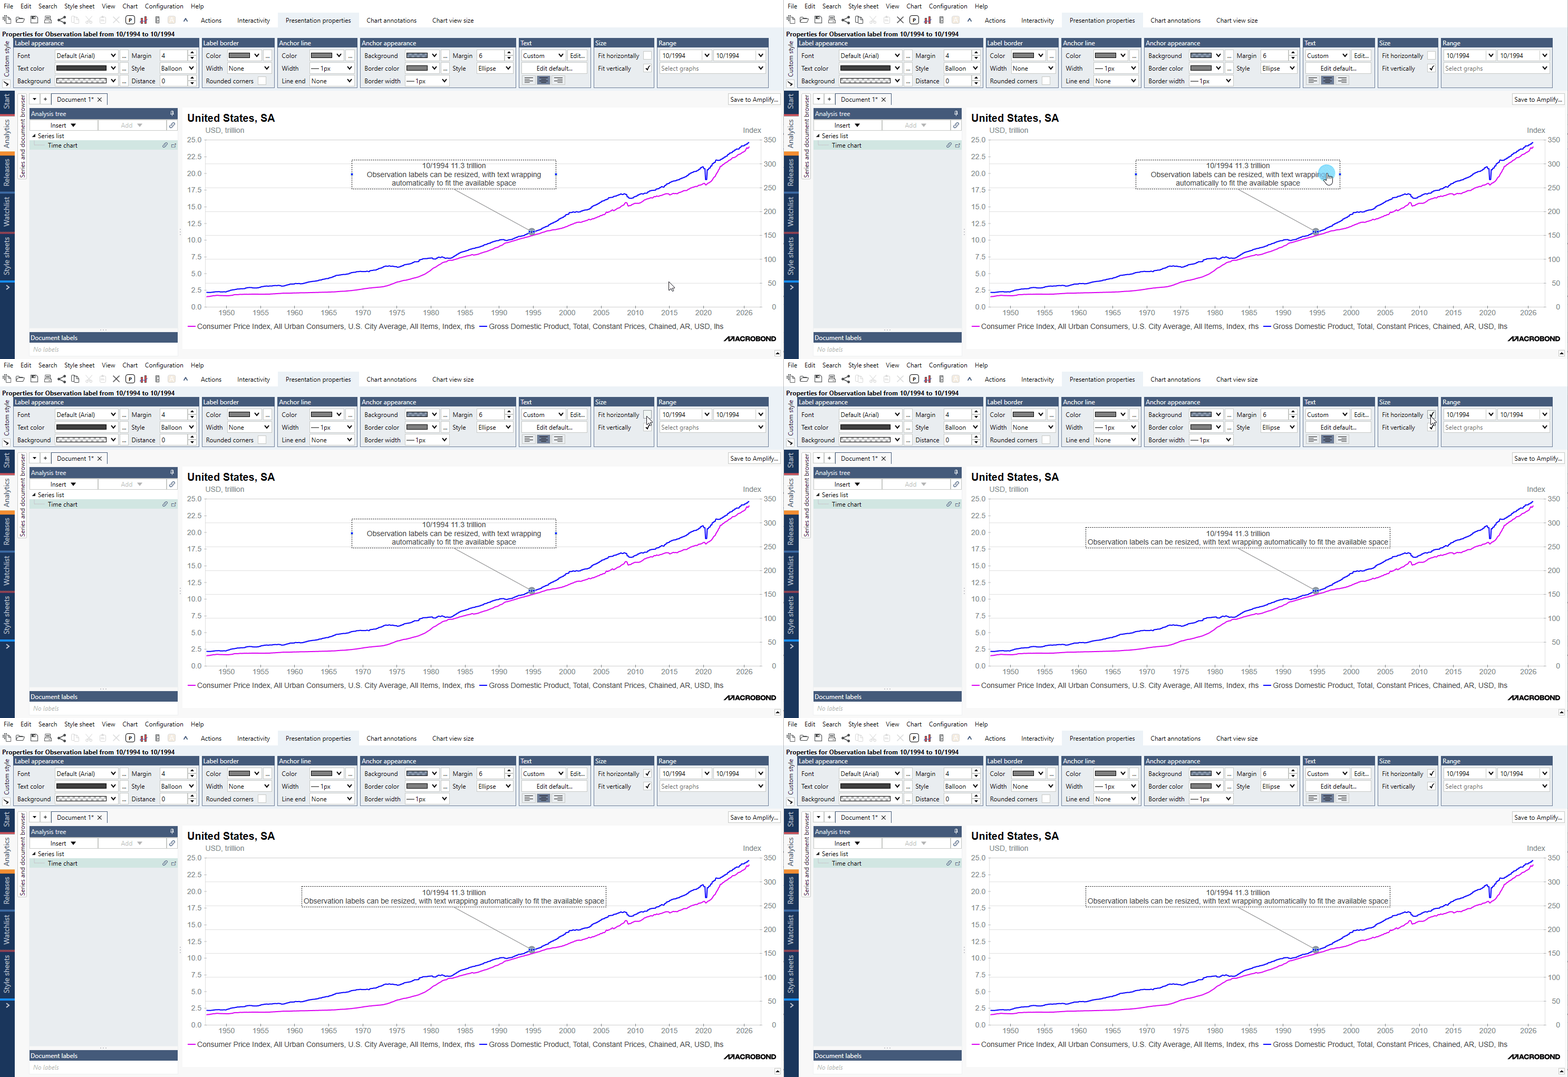
Observation labels resize
Observation labels can be resized, with text wrapping automatically to fit the available space, making labels easier to adjust and read. Deselect the “Fit” options to resize the label freely.
Exclude Quick Filter
Individual filters can be excluded when using Quick Filters, giving users more control over which filters are applied.
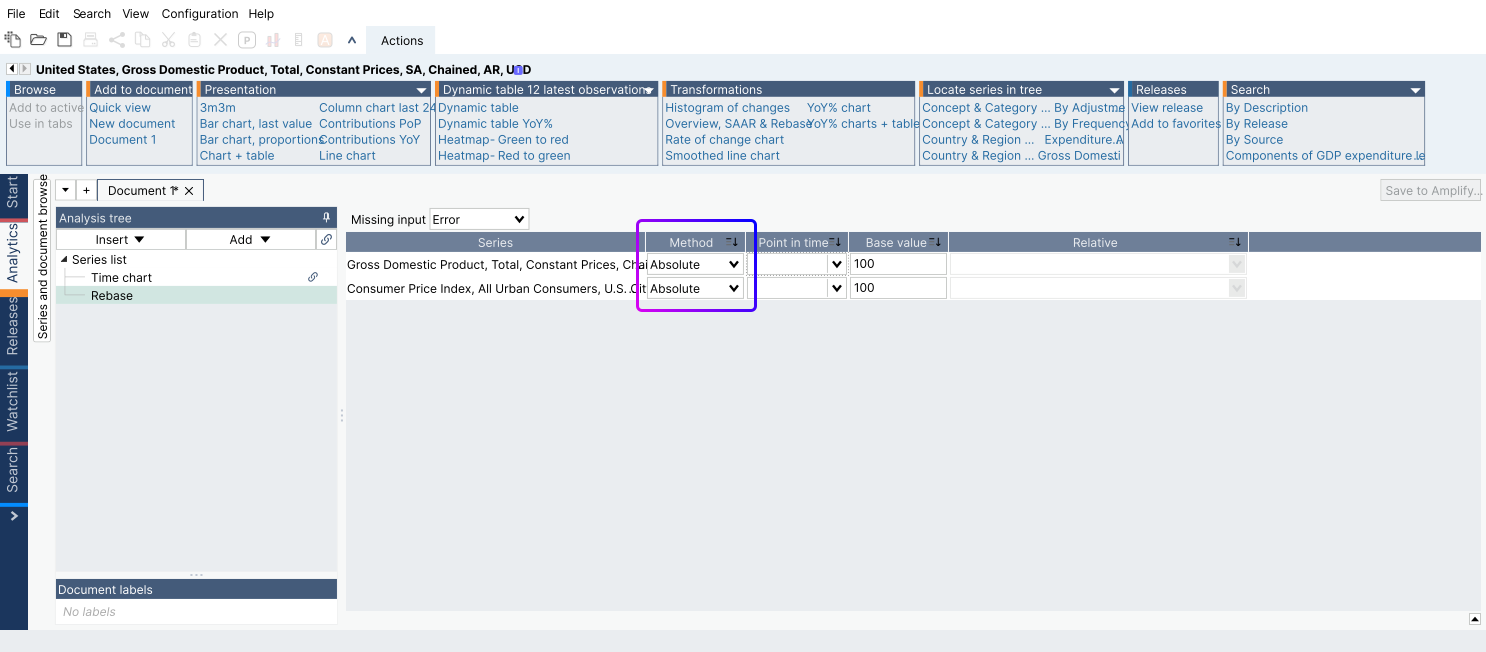
Additive rebase
The Rebase analysis now includes an additive option, using a base value of 0 for greater flexibility when comparing changes over time.
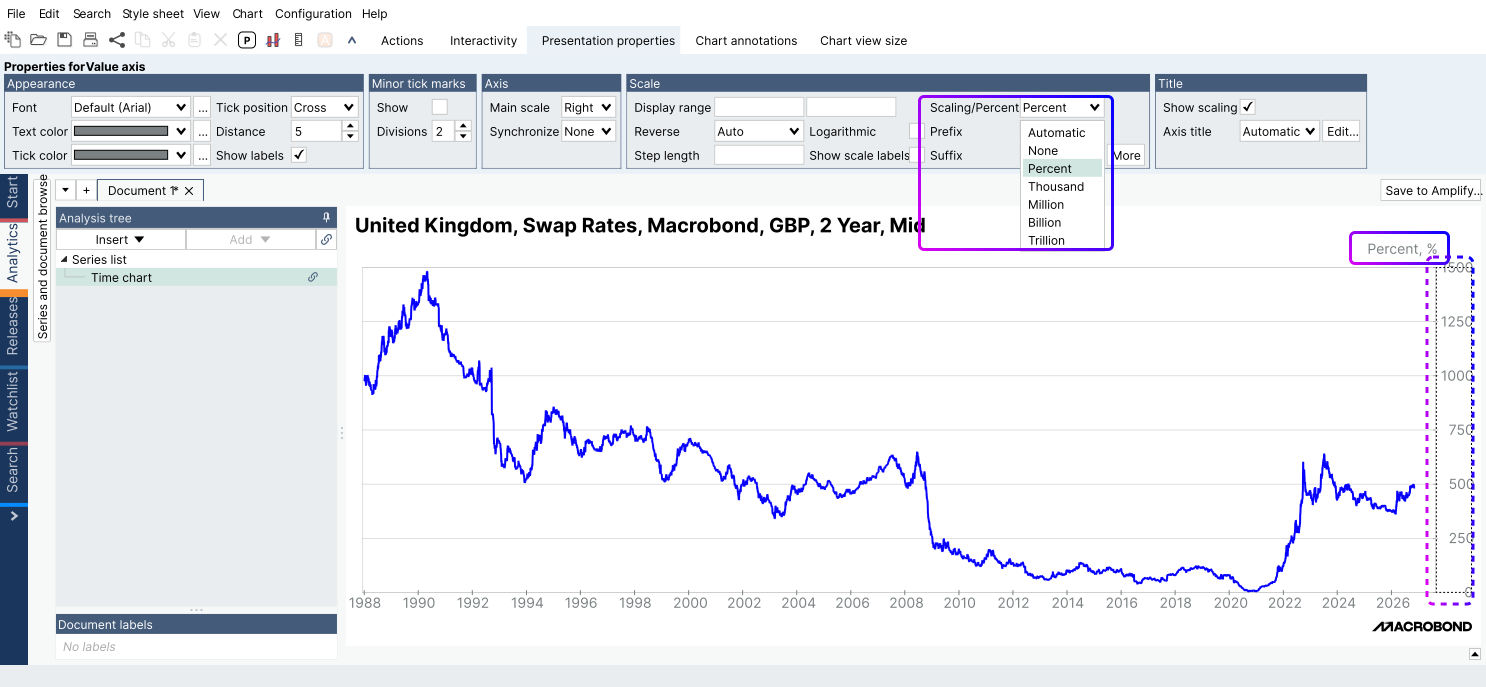
Scale value axis to %
Values on the axis can now be displayed as percentages using the new “Percent” scale option. Only the axis is scaled, while value labels and hover effects continue to display the raw values.
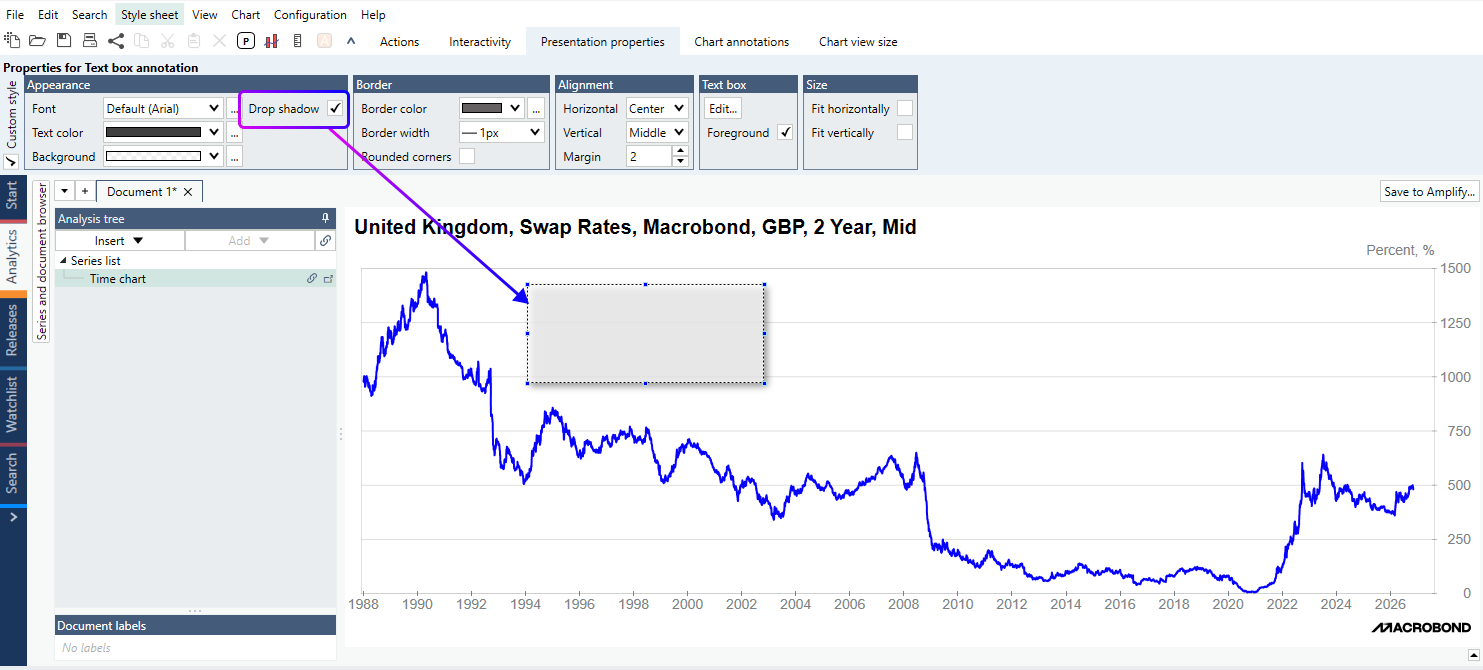
TextBox drop shadow
Text boxes can be displayed with a drop shadow, providing more flexibility when styling chart annotations.
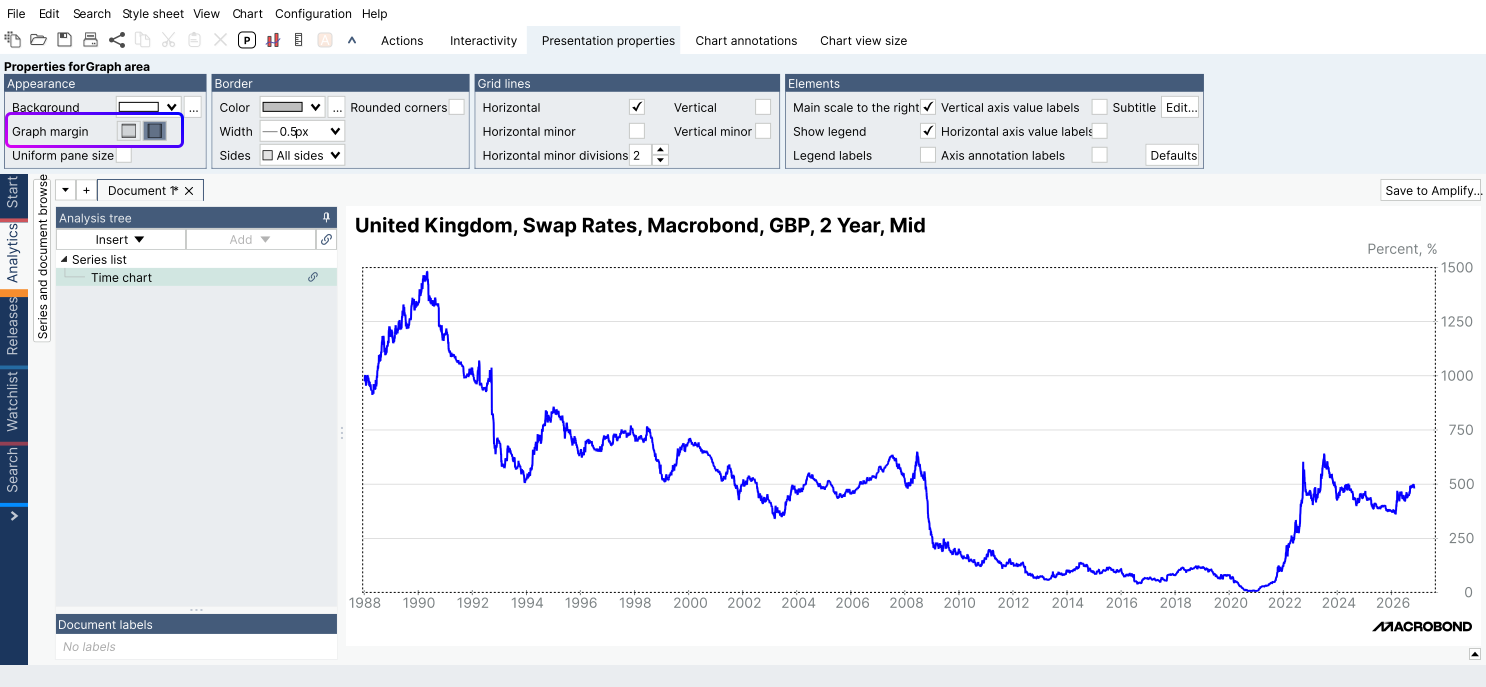
Disable graph margins
Users can now disable the horizontal graph margin, allowing grid lines to align with the vertical axis for greater control over chart layout.
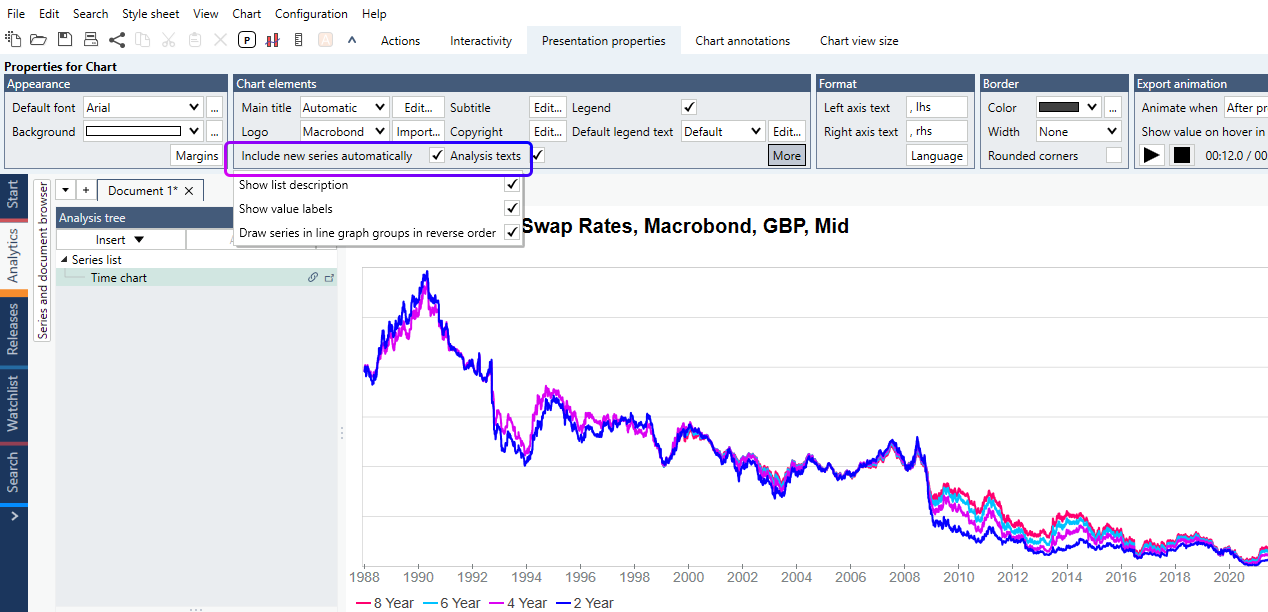
Draw chart groups in reverse order
Series can be displayed in reverse order, giving users more control over which series appear on top. For scatter charts, this also applies to line graph groups.
Dynamic Text variables
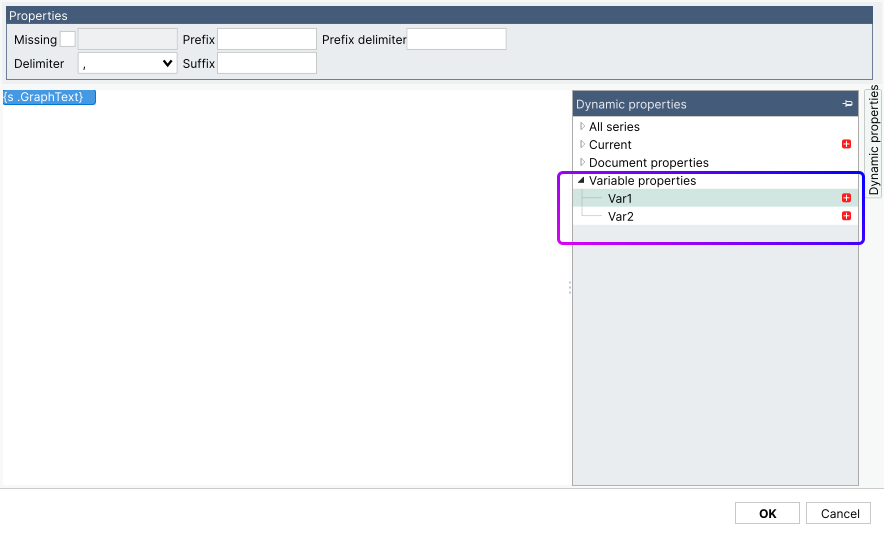
Variable values can be used as dynamic text on charts, making it easier to include variable information directly in chart text.