This document describes how you can test Macrobond Analysis application and make sure is working properly
- Start menu
- Start Macrobond Analysis
- Create a chart
- Save the chart to the Local computer and then open
- Copy chart to Microsoft Office
- Access the Help portal
- Checking for program updates
- The Excel add-in
- Bloomberg as data source
Start menu
Check if Macrobond Analysis is available in the start menu. By default it is found in 'Macrobond Financial/Macrobond'.
Start Macrobond Analysis
Start Macrobond Analysis from the Start menu.
If no user account has been configured, which is typically the case during a new installation, you will be prompted for a username and password. Fill in the username and password.
Please note that if you enter a username and password and successfully log in, that user account will be associated with the current Windows user profile on the computer. You then need to contact Macrobond support to use that user account with another user profile or on another computer.
When a correct username and password has been configured and the application can log on to the Macrobond server, the main screen will be displayed and will look like this:

If you come this far without any errors, it means that you have access to the Macrobond servers and that your credentials are correct.
The first time the application is started, it will download something called the 'attribute database', and this may take 10-60s depending on your internet connection. During this time you will see a text at the status bar of the bottom of the application. During this time you will get an 'hourglass' if you try to access some functions in the application.
Create a chart
In order to create a chart, click on the tab Browse to the left of the application. Then select Overview, Major Countries and click on Denmark.

You will then see that the list of Actions at the top of the application is updated. Click on the Action 'CPI'.
On the right-hand side of the application, you will now see a chart:

Save the chart to the Local computer and then open
Create test document, save it locally and make sure the Macrobond file type is correctly registered.
- With the chart open, select File > Save as Analytics document. Select 'My computer' and enter a document name. The chart will now be saved to your local computer.
- Open Windows Explorer and navigate to 'My Documents/Macrobond'. The name of the folder 'My documents' may vary depending on the language of your Windows installation.
- You should find the file that you saved in this folder.
- Double click on the file and it should open in Macrobond Analysis .
Copy chart to Microsoft Office
Test if OLE integration with Office works properly.
- Open the chart that you have created from File > Recent documents in the application
- Right click on the chart and select Copy
- Open Microsoft Word
- Select Paste (Ctrl+V)
- You should now see the chart in your Word document
- Leave Word running, but close the Macrobond Analysis application
- Double click on the chart in Word
- The Macrobond Analysis application should now be started and should show the chart that you double clicked on in your Word document
- Select different line color for the chart in Macrobond Analysis:

- Close the document in Macrobond Analysis:

- Switch to Word and verify that the line was also changed in the Word document
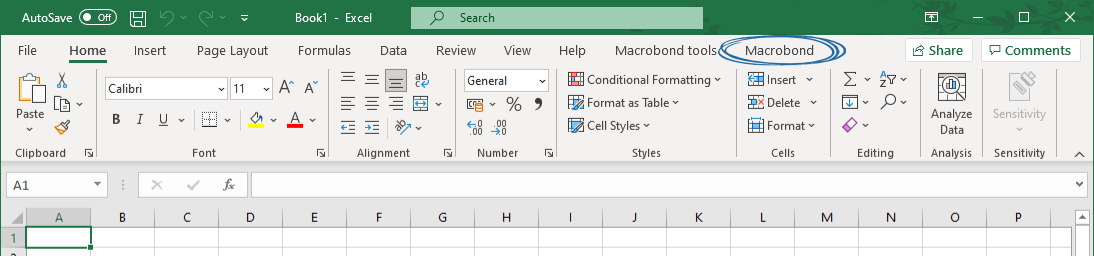
- Verify that there is a menu/ribbon tab called Macrobond in Word where you can find the command 'Refresh charts'
Access the Help portal
Select Help > Getting started in the Macrobond Analysis application. This should bring up your web browser to the Macrobond 'Getting started' web page. This verifies that you have access to Macrobond web server.
Checking for program updates
Select Help > Check for update. This will check if you have the latest version. You should either get a message that tells you that you have the latest version or tell you that there is a later version. You should not get any error messages. This verifies that the application has access to access to the web server www.macrobond.com.
The Excel add-in
- Start Microsoft Excel
- There should be a Macrobond tab or menu (older versions of Office).
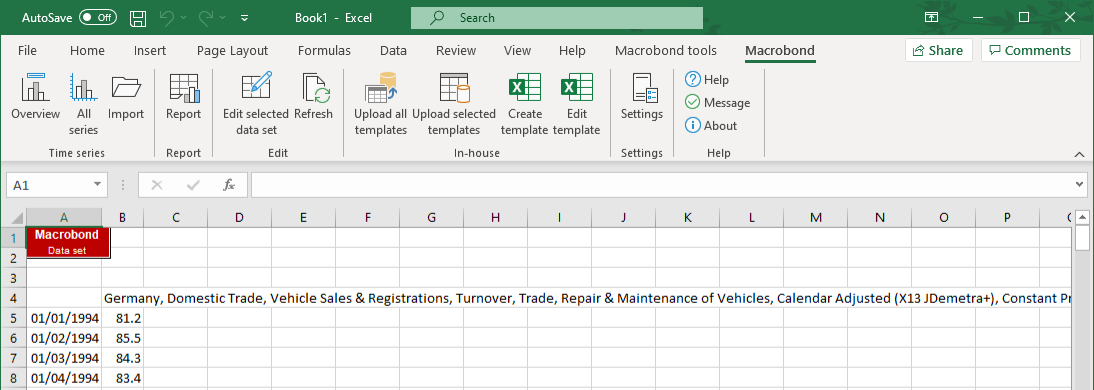
- Select the 'Macrobond > All series' command. This will bring up the dialog 'Create time series data set'.
- Switch to Text search tab, enter 'Germany car sales' and press Enter:

- This will search for such series in the database.
- Add the series 'Production Sales, Turnover (...) X-12 ARIMA' to the data set by pressing the red '+' button.

- The selected series should be added to the list at the bottom right. Press the 'Add' button:
 The dialog should now be closed, and the data should be imported into the sheet together with a red 'Macrobond Data set' object:
Bloomberg as data source
The Macrobond Analysis application can communicate with the Bloomberg Terminal if it is installed and running on the same computer and retrieve historical time series. Please note that Bloomberg Anywhere cannot be used for this purpose.
Start by enabling support for Bloomberg data in the Macrobond Analysis application. This is done on the Configuration (in upper menu) > Settings > tab 'My series':

Then go to the Analytics Activity by clicking on the tab Analytics on the tab strip to the left of the application. Create a new document by selecting File > New in the menu. In the list of data sources you should now find a source called Bloomberg as shown in the picture below. Enter the Bloomberg symbol "ibm us" and press Enter.

You should now see 'International Business Machines Corp' in the list. Click on the red '+' next to the title and you should see a line added to the graph in the document to the right.