- Core databases
- Searching & filtering
- Organizing results
- Shortcuts to access data - Bookmarks & Favorites
Core databases
You can navigate our data via three points of entry:
- Country & Region
- Source & Release
- Concept & Category
Time series browsers are located in Browse and Analytics activity tabs (they work same way). The first step to navigating the data is selecting an entry-point to look at from the drop-down menu. Selecting an entity from the tree will generate a list of data in the pane below.
Country & Region
Here the data is organized primarily by country and regions, and then by economic categories. Data categories and subcategories are only shown if data is available for the selected country. The region 'World' also contains data that does not belong to any country. For instance, Commodity Indices or Emissions data can be found there.
In this view, you can apply filters to only display specific countries and regions in the list. See on Using the tree filter how to do this.
Special nodes
In this view you can see special nodes:
- International Sources - located in nodes covered by the National sources, it gathers data from International sources regarding particular topic
- High-Frequency Indicators - with various data which has Daily or Weekly frequency
Source & Release
Source & Release is structured similarly to Country & Region, but beneath each node you will find the sources corresponding to that country or region. In this view, you will find national sources by accessing each country, and international sources by accessing regions, such as 'World'. Note that it is the country, or region, of the source that you should select, and not the country that the data references.
For certain releases, we categorize and organize the data in accordance with the source.
You can apply filters to only display specific countries and regions in the list. This means that only sources associated with these countries will be displayed in the tree.
Concept & Category
This view is an easy way to access similar key data, or concepts, for several countries. The data is organized using the standard Macrobond economic categories and key concept sub-categories.
The National sources category only includes indicators from local or primary sources. Because of methodological differences, granular data can’t be compared across local sources, which means that only a limited selection of indicators are provided for this view. All sources include harmonized data provided by international sources like IMF, Eurostat, ECB or OECD.
Searching & filtering
You can quickly get to the country by pressing a key with letter. You will be sent to the first country which starts with this letter.
Clicking once on the arrow to expand a data node will keep it where it was and will not automatically adjust the view in the series browser.
If you double-click or press Enter to open a node of the data tree, the selected node will be moved to the top of the window to facilitate the navigation within it.
Importance of data (the red exclamation mark)
In the application, we use red exclamation marks to indicate when a time series is a key series for that category. These series can be one of two types:
- the headline series of a given publication
- the key series of a given country, which we’ve defined to facilitate cross country comparison
The Notes column will also display the following information:
- the series is used in a document (the blue square)
- has been marked as favorite (the yellow star)
- has a revision (the three violet lines)
To see which type of series is being indicated, hover your cursor over the time series in question, as shown in the images below.
Enabling the exclamation marks column
To enable this column, please make sure that the Notes column is selected to be displayed.
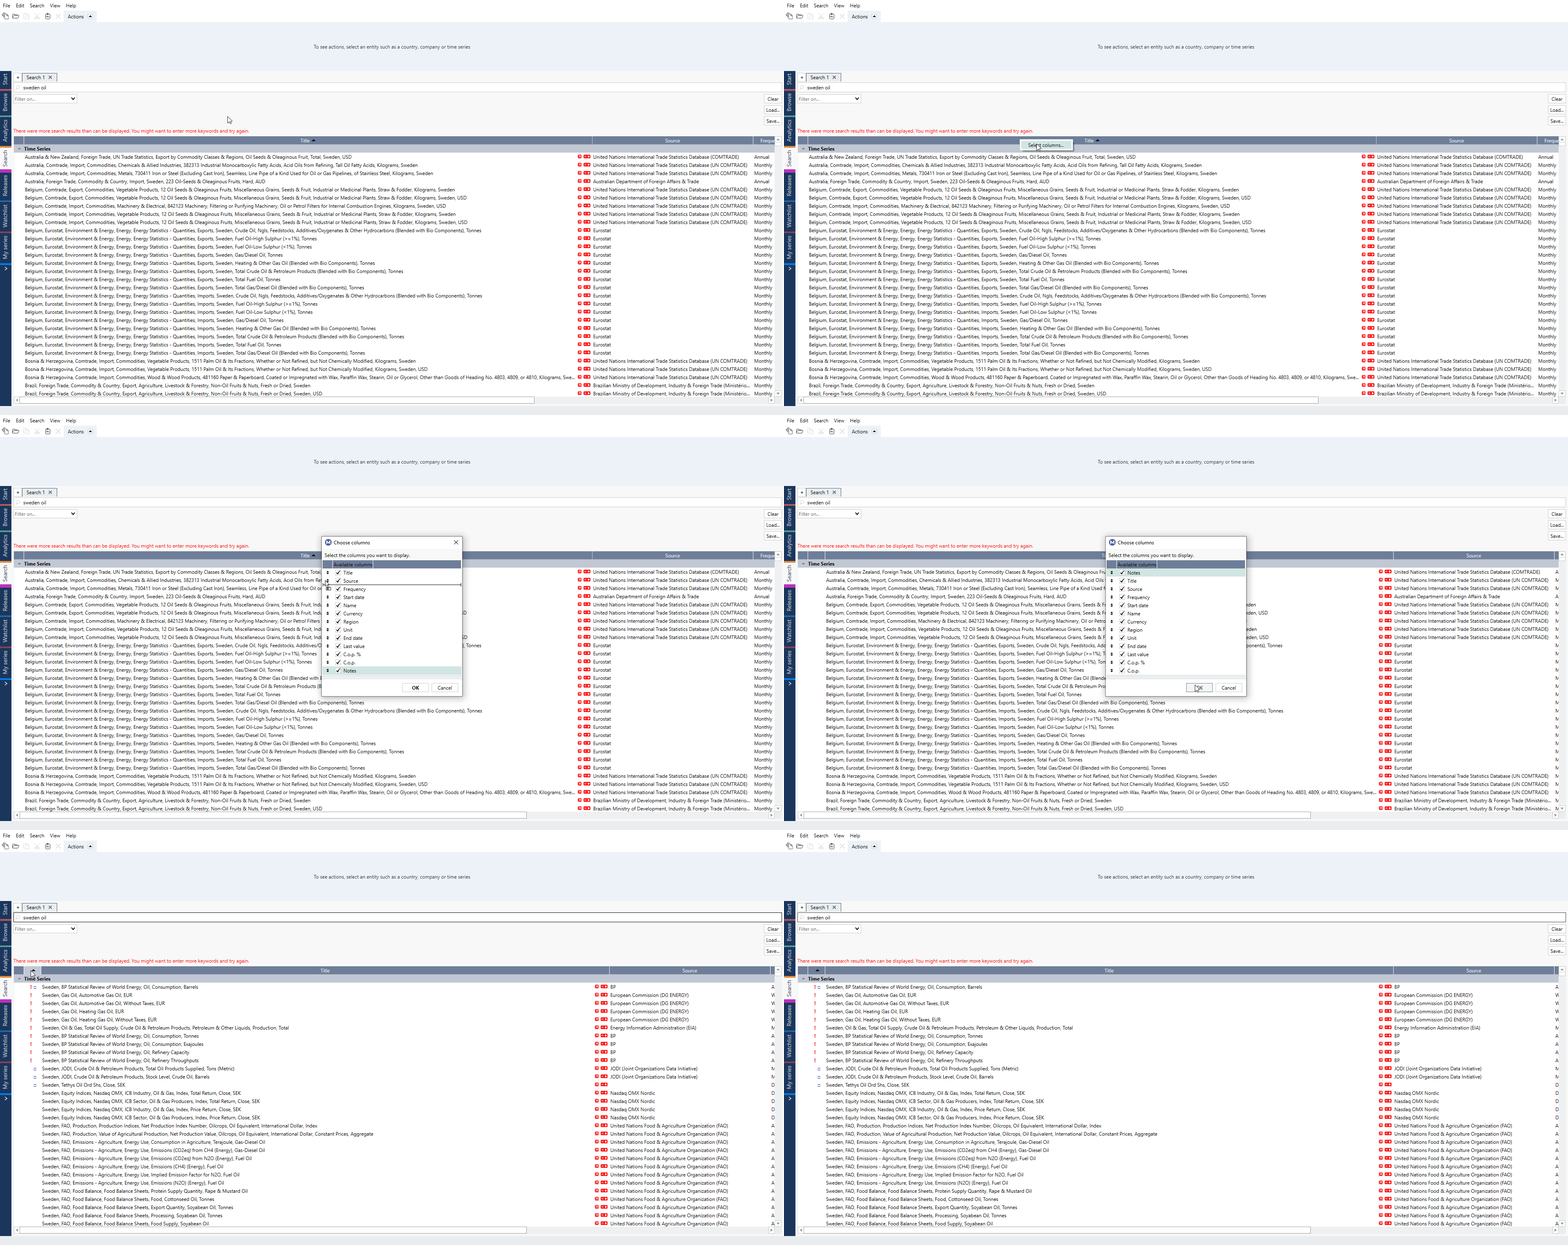
Using search bar
You can manually navigate the data-tree, or you can use search bar.
Use the search bar to search for the names of sources or releases. Then select a result to see the data. Here the series are listed alphabetically. If you want to see a series in relation to the rest of the data set, use the Actions ribbon > Locate in tree function.
If you’re unsure of the name of the release you’re looking for or you want to see the data in an organized structure, you'll be better off navigating the tree by hand.
Using the tree filter
Tree filter can save you time on finding data by eliminating the need to scroll though a long list of countries to find those you’re interested in.
The advantage of using a country filter is that the filter is automatically applied across all databases. In the pictures below, for example, we’ve applied a Euro Area filter. You can see that both the Country & Region view of the economics database and the IMF database only include the filtered countries.
The filtering countries feature is not available under Concept & Category view since the data tree is not based on geographical attributes.
How to filter?
Tree filters are applied in the series browser under the search bar and above the data tree. Click on it to open the drop-down menu.
Available options
- No tree filter - this option disables the filters and makes the entire data tree available.
- List of available filters - all the filters you’ve loaded are listed here so they can quickly be applied.
- Edit - this appears when a filter is set and allows you to edit the countries included in the selected filter.
- Load - use this to load filters that are saved but not available in the quick list. You can load region filters that have been saved in your company or department accounts.
- New - you can create a new filter directly from the series browser with this option.
Creating a filter
There are two ways in which you can create a new region filter: using the “new” option in the filter list drop-down menu or creating and saving a region filter in the search activity. All filters are saved together, so filters you create in the Search activity are also available in the Analytics activity and vice versa.
- Create a filter directly from the series browser in the analytics activity.
- Select New from the filter list drop-down menu
- Select an account to save the filter in
- Name the filter
- Search for and select countries to include in the filter
- Create and save a region filter in the search activity. See how to do this here.
Setting the default filter
To set a default filter, use the star button next to it. This filter will be applied automatically in every new document.
Clear your filter
Remember that the last filter you applied will stay active for all documents in the current Macrobond window. You should select No tree filter again if you want to remove it.
Organizing results
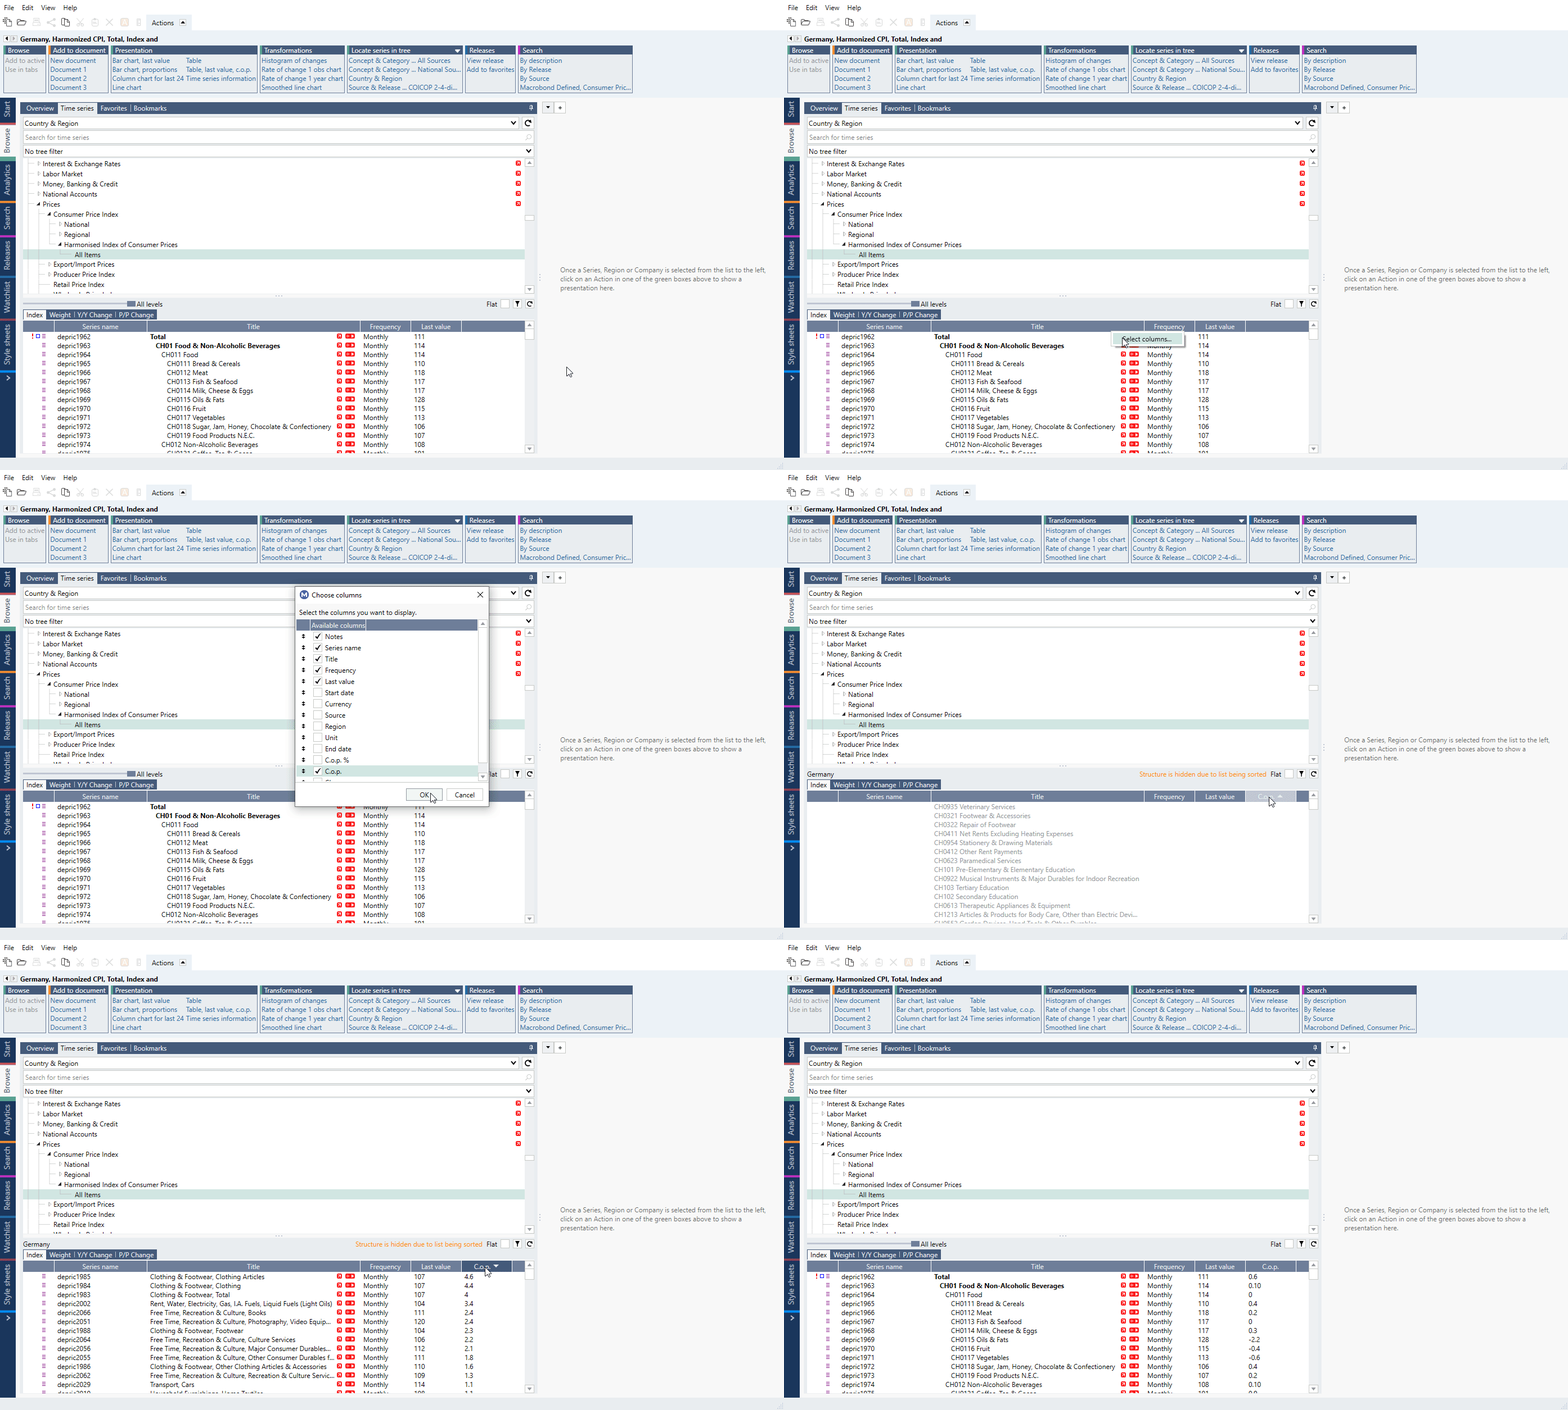
You can use columns to define the type of series information shown, as well as to sort the list of time series. If you haven’t made any changes to the columns yourself, you should have four basic categories in place.
By right-clicking on any column header, you can customize which columns should be displayed, and in which order. When selecting which categories to add, keep in mind that you’ll be using these parameters to sort the list of time series later on.
Structured view/Flat view
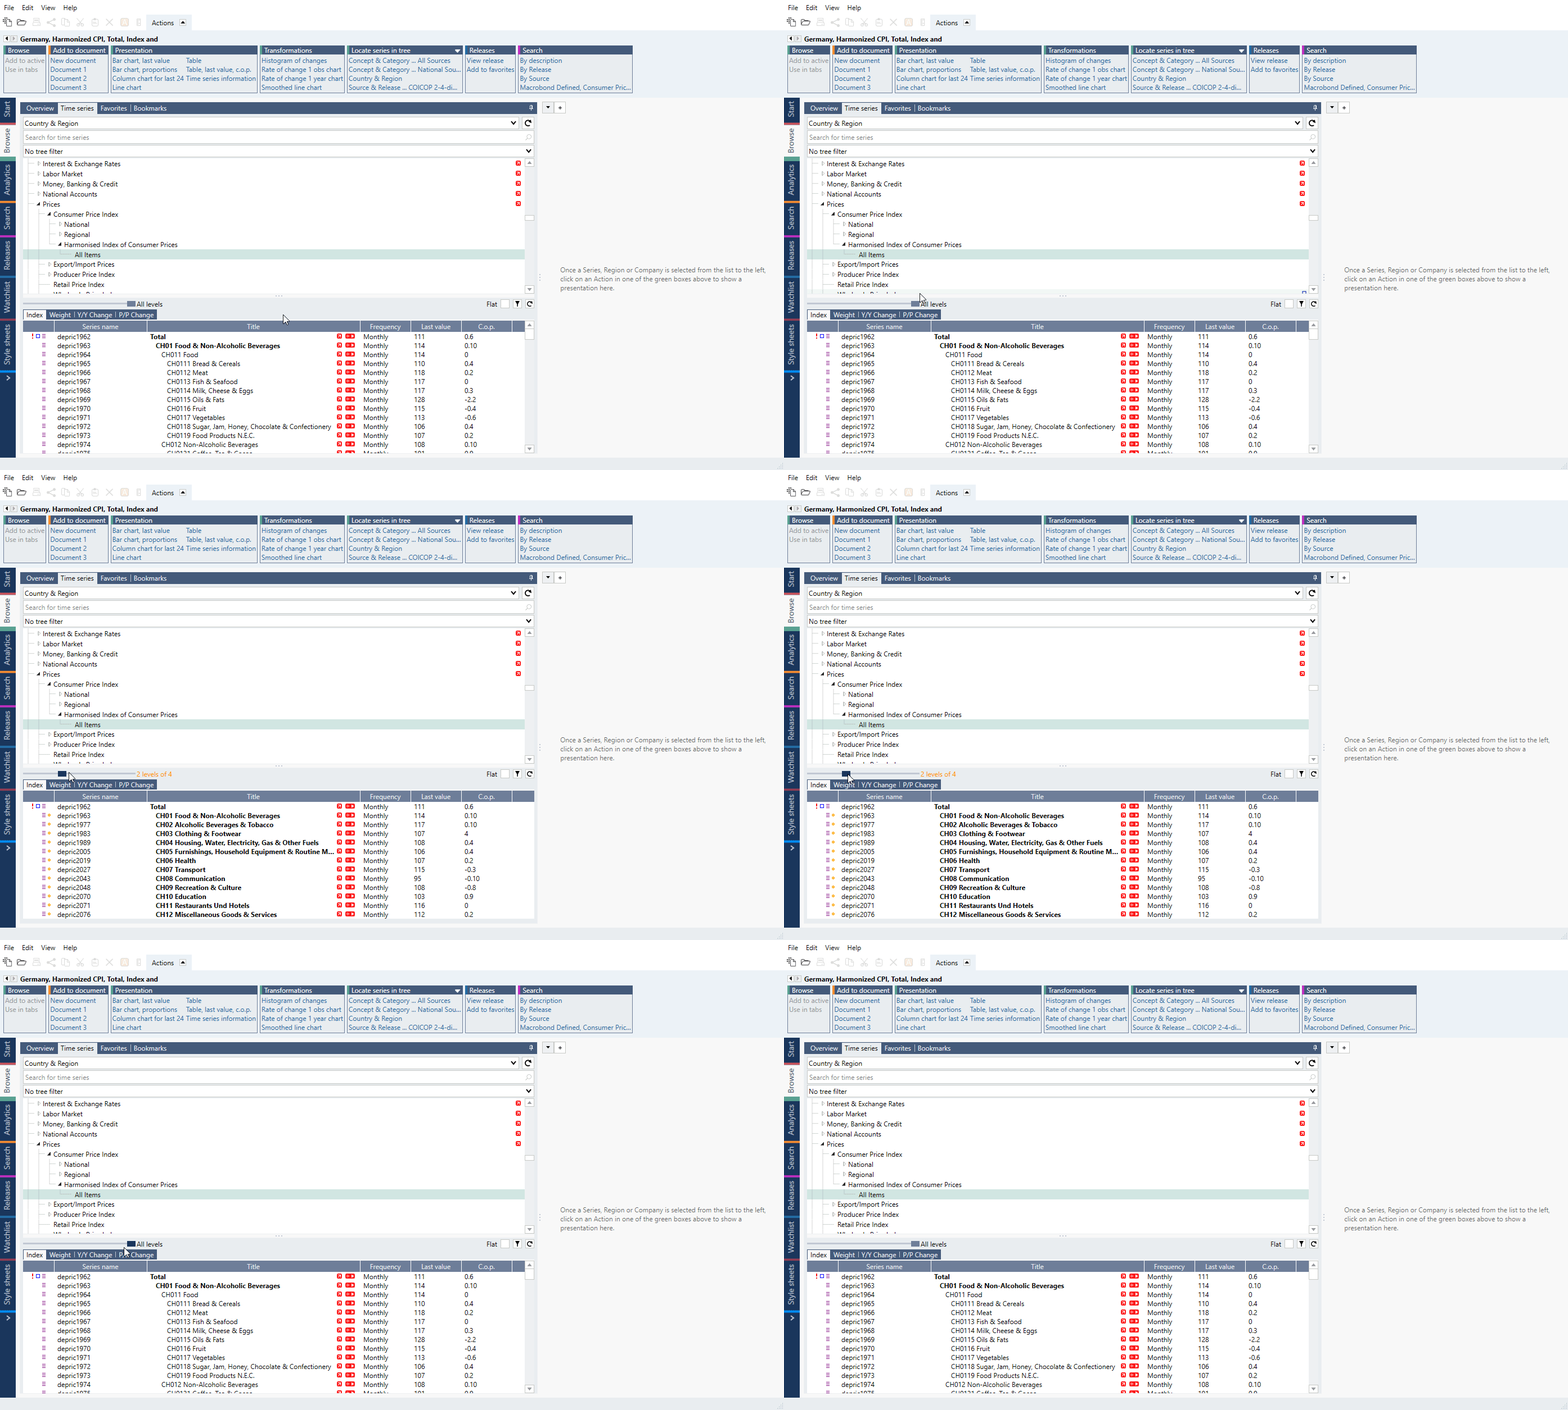
In some nodes if you look to the top left corner of the list, you’ll notice various tabs. Each tab groups series that share a common attribute. Tabs are only made available if there's a significant number of time series with common attributes.
Some nodes also have more structured view with levels.
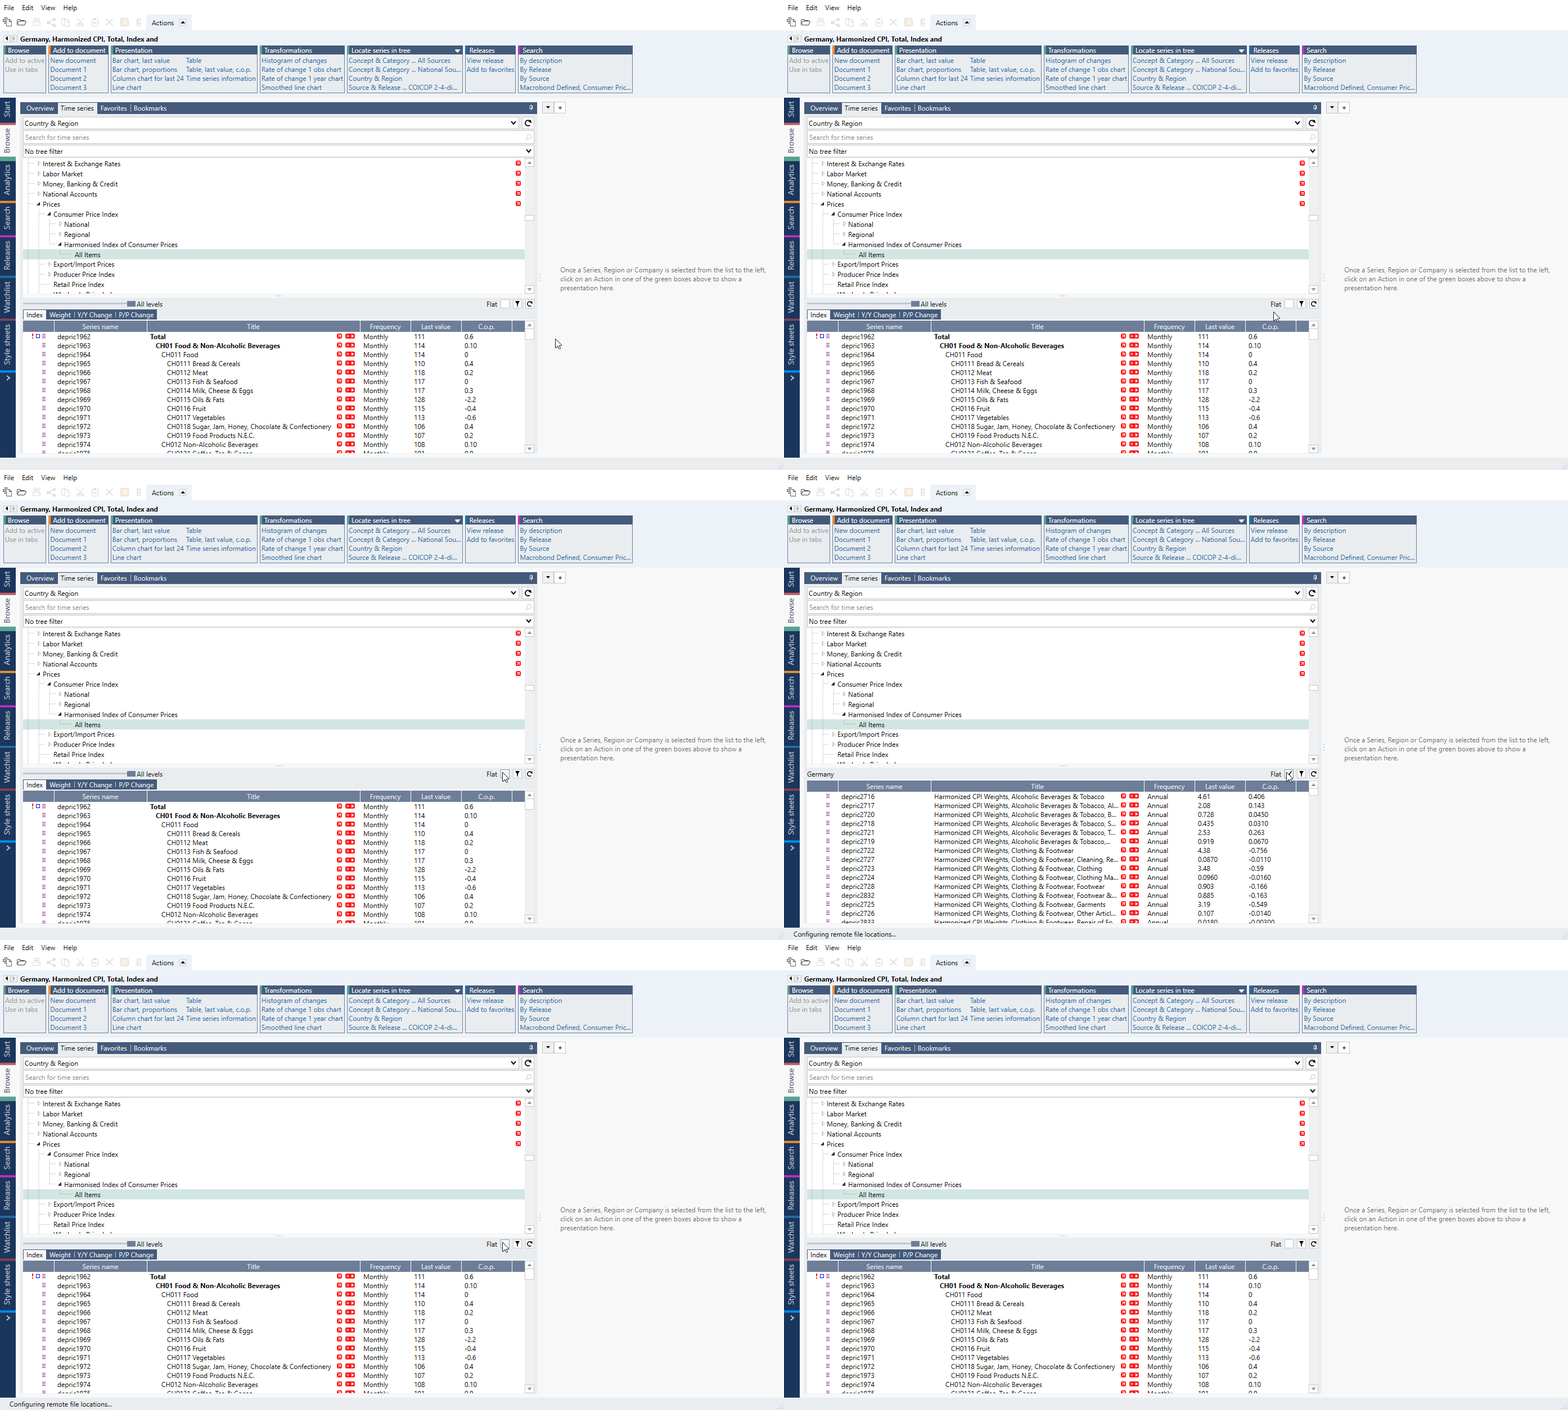
If you prefer not to use tabs and structured view, simply select Flat, to combine all the time series into a single list.
Filtering results
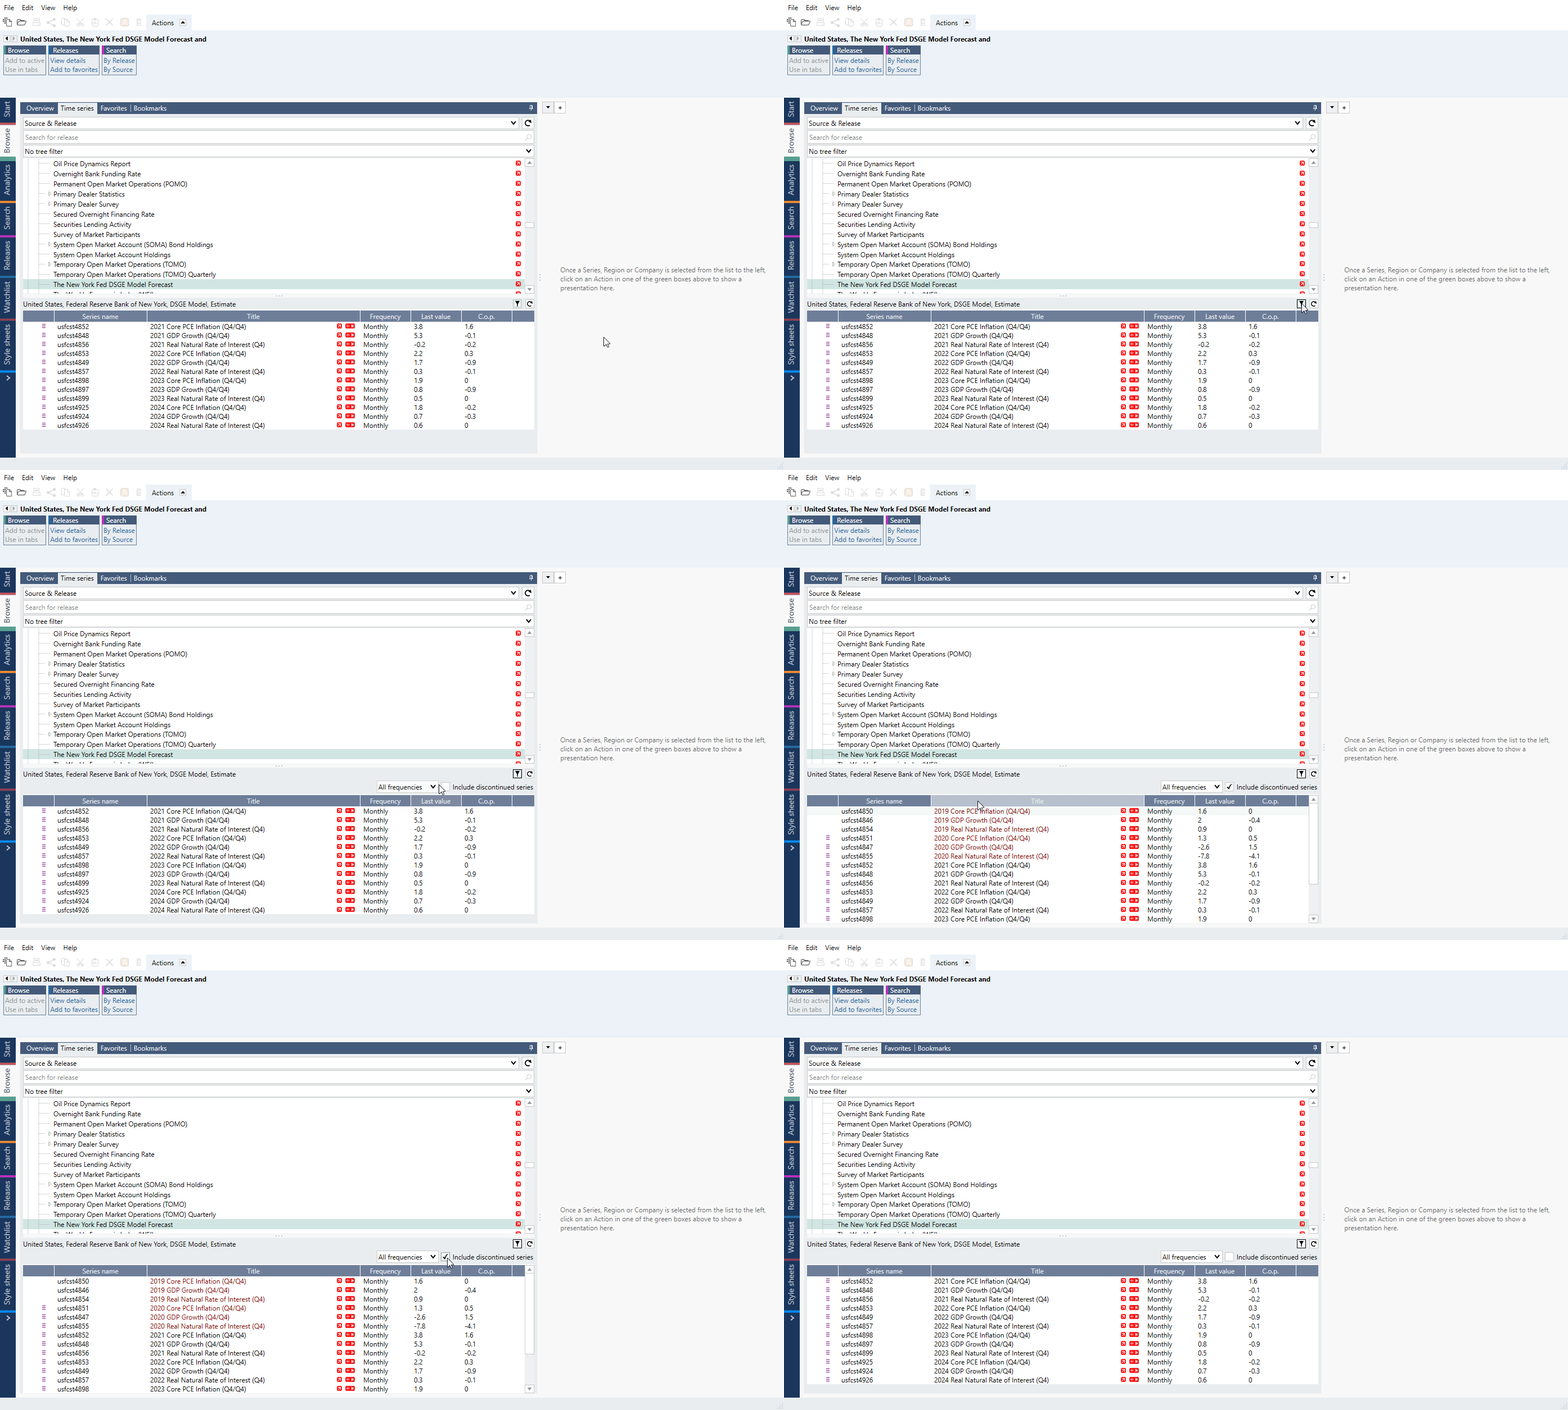
To activate the filter settings, click on the filter icon. You can narrow down the list by specifying which frequency the series should be in and also include or exclude discontinued series. All discontinued series are shown in red, to make them easy to distinguish.
Shortcuts to access data - Bookmarks & Favorites
When you find time series or node you would like to use more often you can create a shortcut to it. For individual time series you can use Favorites functionality (the yellow star icon) and for nodes there is a Bookmarks functionality. See them under Customized shortcuts to access data.