Once you've found and selected the data to work with, the next step is doing something with it in the Analytics tab. This is where you’ll be executing calculations, linking your workflow with external resources or tools, and applying customizable chart styles and tables.
Analytics
The workflow in Analytics is organized from the left to the right.

On the left side, you have the Series Browser. Use this to select and add time series to the document. In the middle, you have the Analysis Tree this is where you work with the data you have added. At the end on the right, you have the Presentation area where your work is visualized, either as a table or chart .
Series browser
Databases
Let's start with the Series browser, where you can select and view all available databases in Macrobond. At the top you have the Country & Region database, listed by countries and then by categories within. Country & Region database is primarily comprised of local and national sources of data, collected by Macrobond. After this there's Source & Release database which stores all data presented by the sources. Finally, we have Concept & Category where data is presented by concept. As you scroll down further, you’ll see third-party databases with wide array of data aggregators.
Structure
As you may notice, the data is organized using a tree structure, made up of primary and sub- categories of data. When you select the sub-category, the application will generate a list of the available series for that category below.
Series browser is the same mechanism as in the Browse activity tab, for more about this see Browse activity tab. You can also use Search field - here you can exclude and include relevant metadata and sort it in order of relevance. For more see In Search activity tab.

Series list
Opening the Series list allows you to review the series and, if needed, adjust different parameters. The available parameters are frequency, observations, currency, data range, conversions settings (including missing values) and forecasts. For more see Using the Series list.

Analysis tree
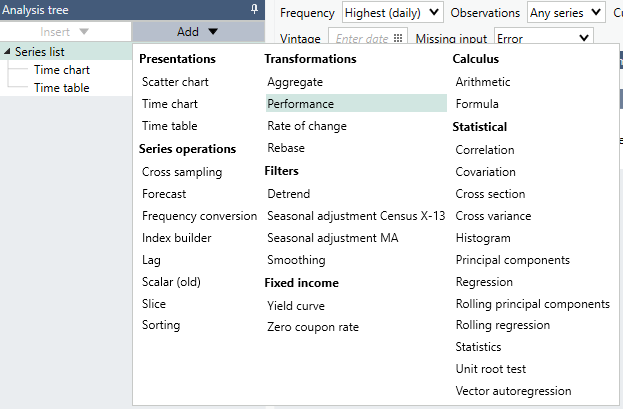
Add analysis
Once you've made the necessary adjustments in the Series list, you can go ahead and add analyses. For that you'll use the Add function which allows you to select from a range of different analyses and presentations. Every calculation or presentation that you select is then added as a new branch in the tree structure, which also means it'll define the output of the branches below it.

Insert analysis
While the add button always results in a new branch being added to the end of the tree, using Insert allows you to choose where in the tree you would like to insert a calculation.

Undo the changes
Easily undo changes with the standard Ctrl+Z key command or select Undo from the Edit menu.
Using the Analysis tree is a powerful tool to help you see and understand the effect of each new analysis on the sequence of calculations. For more see Analysis tree.
Analyses
Formula language
You can perform various calculations using the formula language and things that are not possible with built-in analyses. Use this if you want to have more flexibility to customize the calculations you apply. The formula language can either be applied to the start of the tree or to a particular section. For more see Formula.