Purpose
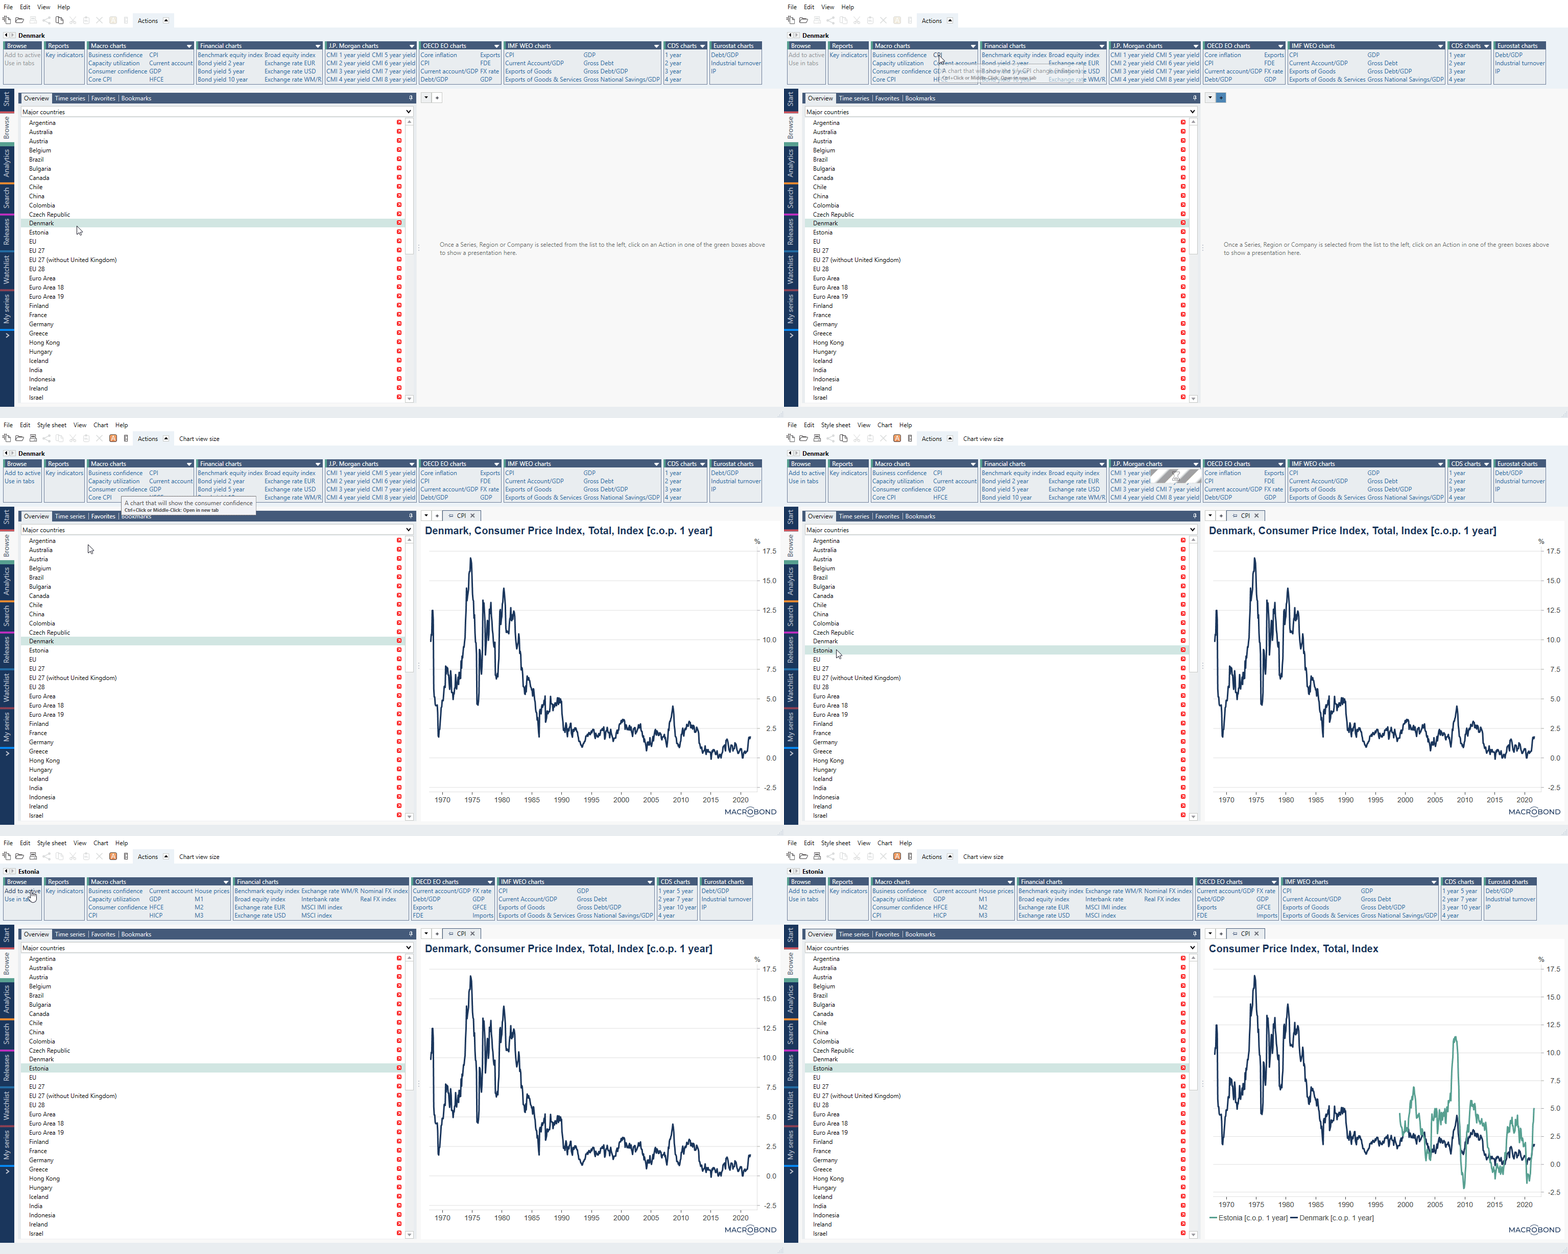
With Browse tab's Overview you can quickly find the same indicator for different countries. With just a few clicks you can visualize the data as a simple chart and, if necessary, move it to Analytics to develop further. The Overview gives you access to a collection of key indicators, generated per country.
How to use it?
Selection of key indicators is displayed by category in the Actions ribbon. Keep in mind that sources provide a varied offering of data, so you may not find the same indicators for every country you view. Note that some of the panels can be expanded.
Highlight a country and click on the indicator to generate a simple line chart. To compare the data to other countries, navigate back to the Actions ribbon, and click on 'Add to active'.

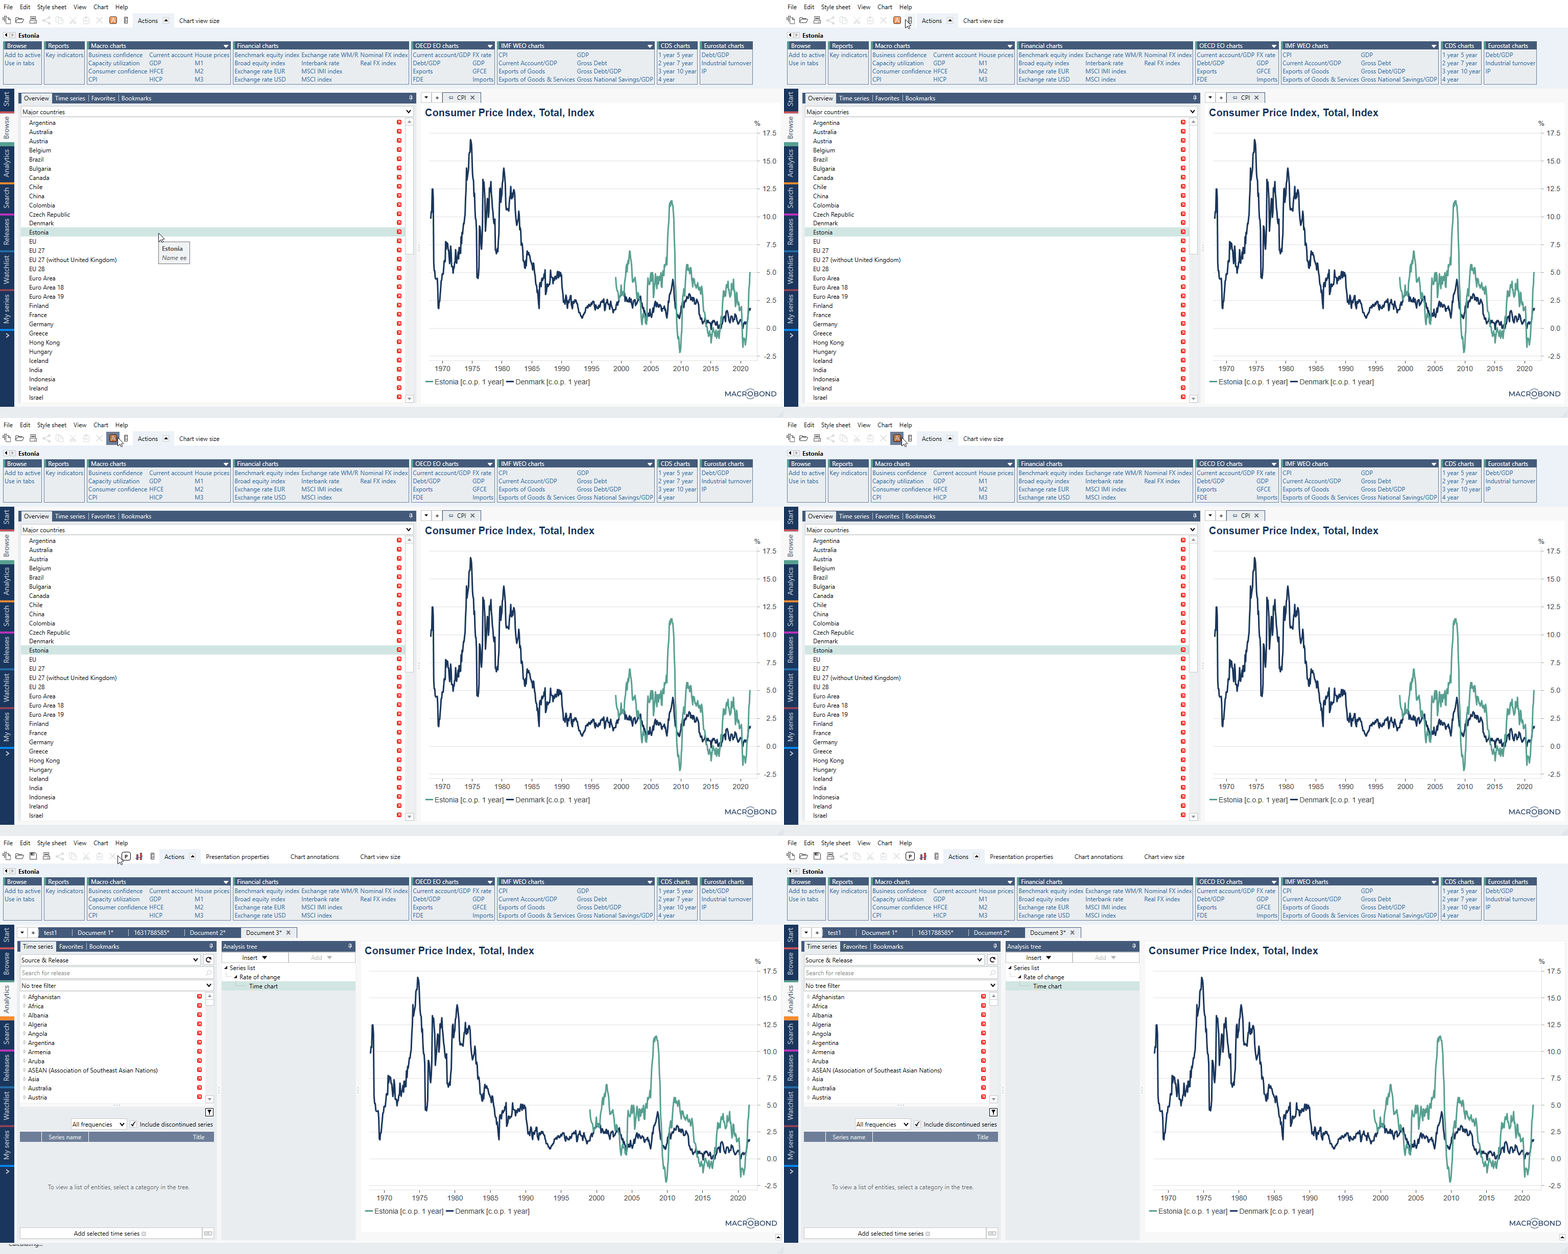
Moving data to a file
If you want to apply calculations to the data, or make changes to the chart, click on the orange A button. This will transfer the selected time series to a document in Analytics tab.
