In each Macrobond document that you create, the analyses and charting presentations that you apply to the data are added to a tree schema - called Analysis tree. What we are going to look at now is the first branch of the analysis tree, the Series list. Any changes you make to the series list will influence the analyses and presentations that follow.
Introduction
The Series list is the first node of the Analysis tree and opens to the right to show all the data. The purpose of the Series list is to prepare the series for further analysis and presentation by converting all series to a common calendar and filling in missing values. You can also convert series to a common currency, add forecasts, and set a data range.
Series list
Expression and Description
Series added to a document are listed in the Series List and are comprised of two components.
- Expression - the series name e.g., eubank0133
- Description - e.g., Euro Area, ECB Consolidated Balance Sheet & Flows of MFI Sector, Eurosystem, Total Assets & Liabilities, All, EUR
In the Series list you’ll see the time series described relative to data attributes, such as:
- Region
- Category
- Series title
- Inflation adjustment
- Seasonal Adjustment
- Unit
The series descriptions are automatically used in charts, either in the heading or in the chart legend. You may want to change these descriptions manually, especially if they are too long.
How to add/remove series from expressions
Unless you know exactly which series you want to look at, building a new document is often a trial-and-error process of finding the data that works best. Learning about the different options to add and remove time series from a document will ensure that this process is as quick and effective as possible.
Adding series
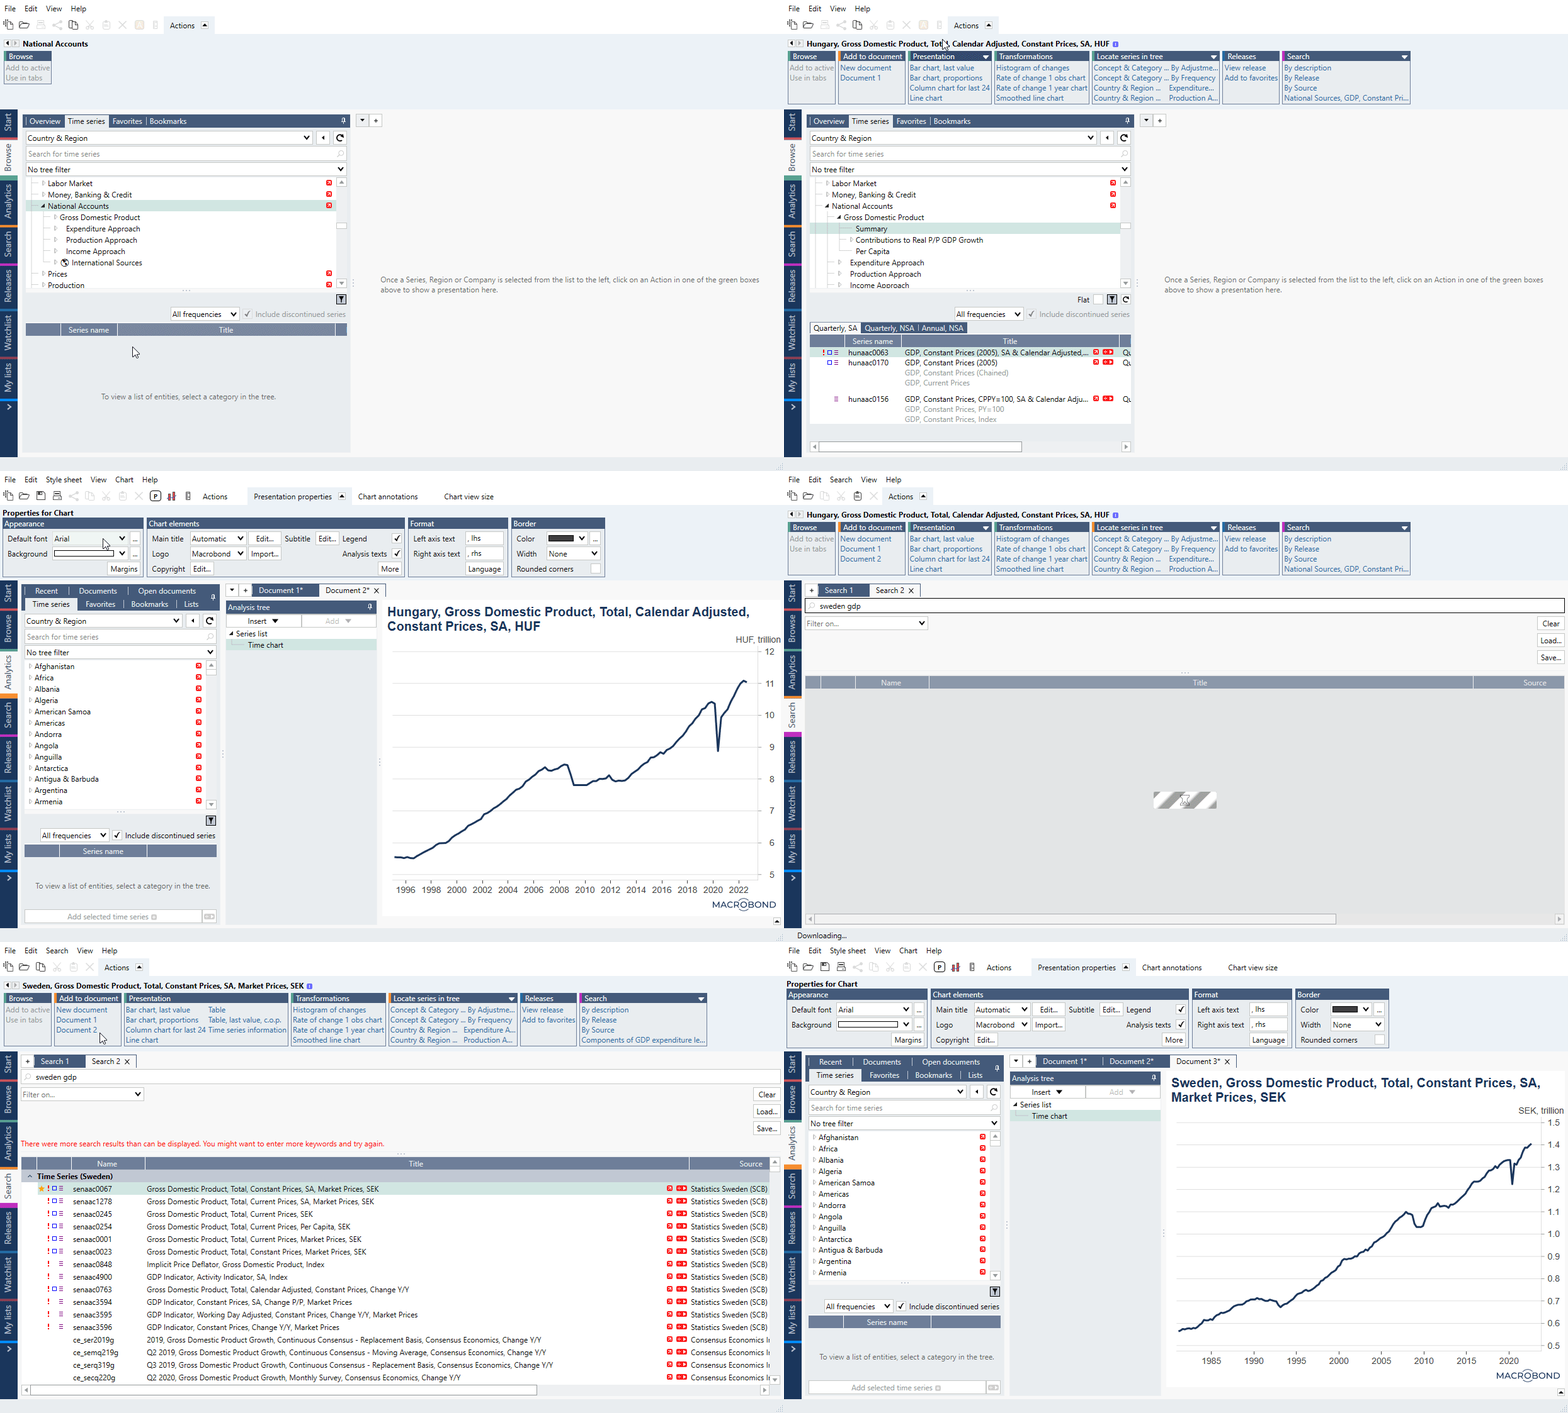
From Browse/Search
In both cases panel on Actions ribbon will do the trick. Simply click on series which you want to add, either from Browse tree or Search and next go to Actions ribbon > Add to document.

From Analytics Series browser
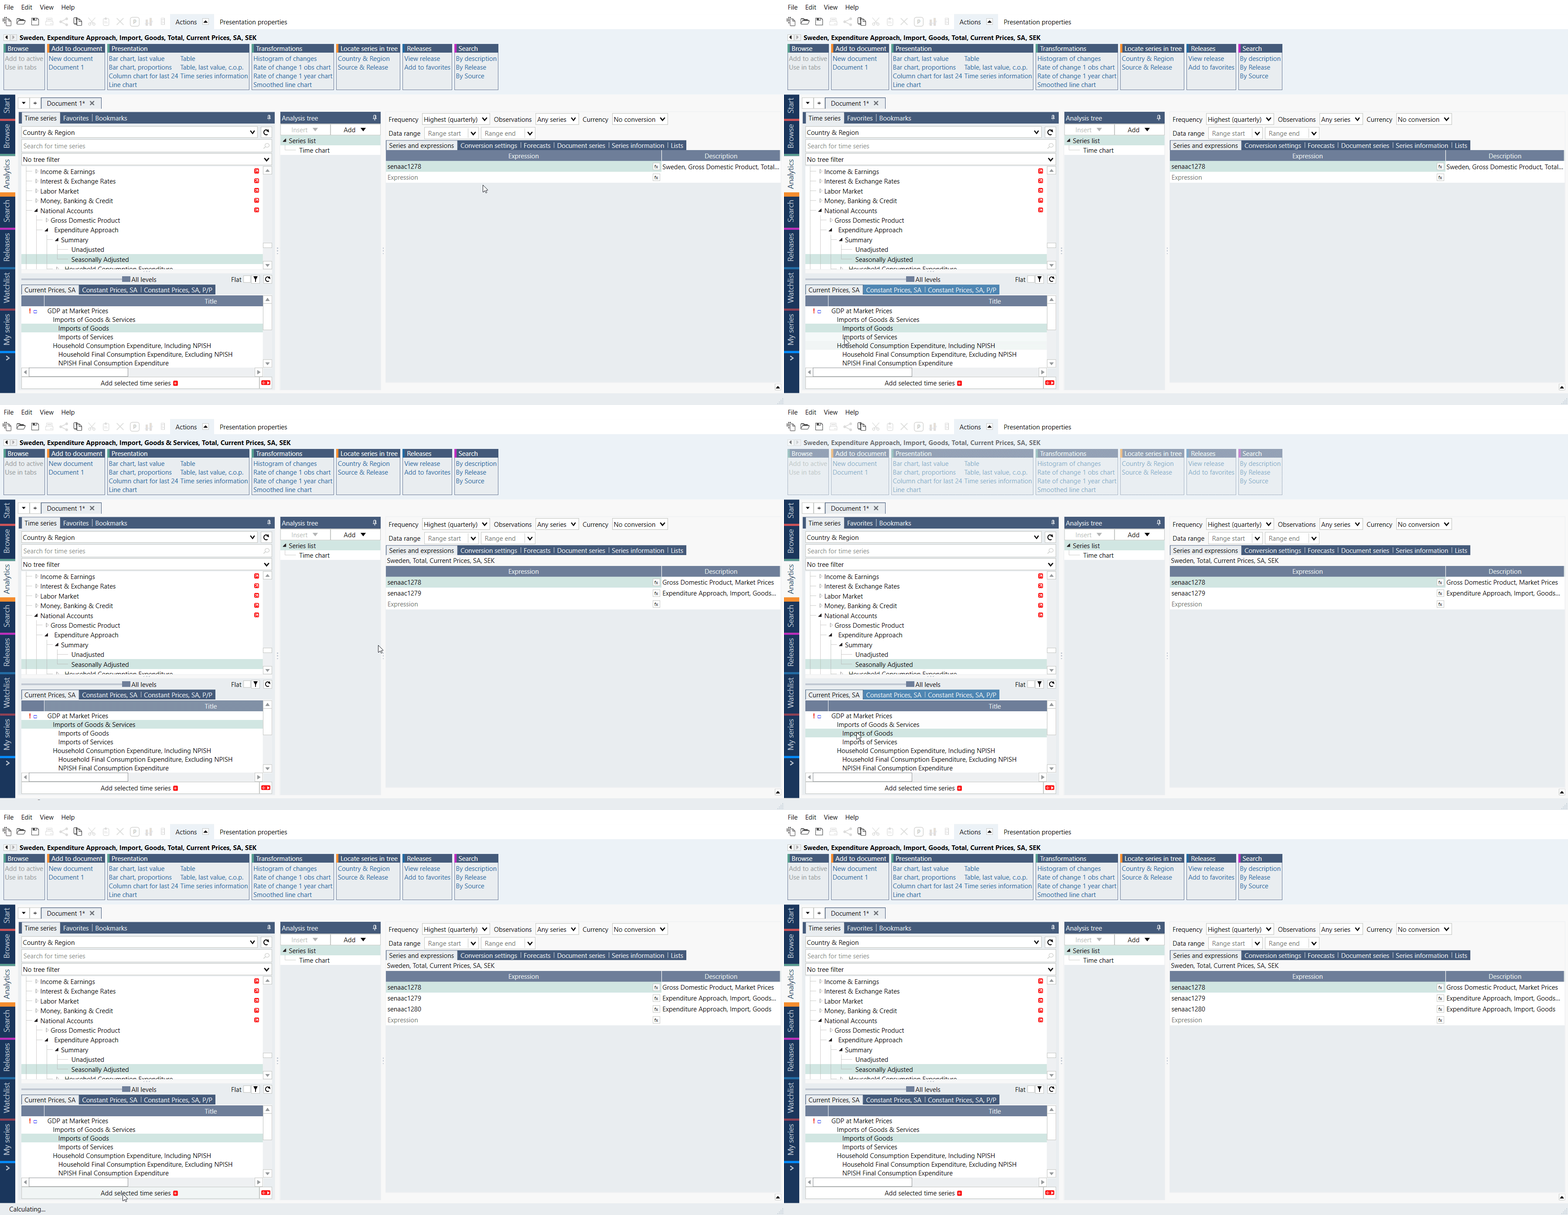
The situation looks a little different in case of Analytics tab. Here you can choose series from Series browser and double-click on it. You can also select series and click on 'Add selected time series' button. After both actions selected series will be included in Series list.

It's worth to remember that you can select more than one series by pressing Ctrl when clicking on these series or select all available series by pressing Ctrl+A on your keyboard.
Removing series
To permanently remove the series from the document, right-click on the series in the Series list and select Delete. You can also select series you want to remove, and press Delete key. This action will delete this time series from the document, including any analyses or charts it was used in.
To remove a series only from a chart, simply right click on it in the chart and select Delete or open Graph layout (Ctrl+L) and remove it from there.
How to edit the descriptions?
There are two options for editing descriptions: a simple edit and an advanced edit.
Simple edit
- Double click on the description in question, in the Series list
- Type in the desired description
- Hit 'Enter'.
Advanced edit
- Click once on the series description to highlight it
- Navigate to the presentation properties in the command bar, above
- Select an option from the drop-down menu
- Automatic – will use the default series description
- Custom – select this and click on edit to modify the text manually
- Expression – applies the Macrobond time series code
- Reference – will use the default series description, to which you can add custom text that will be used in the chart legend
Please bear in mind that the description entered in the Series List will later be used in the document across all its functionalities and in the chart titles and legends.
Formula editor
To use the formula language to customize your calculations beyond the options available via the Analysis tree click on the 'fx' button to open formula editor. It's located to the right of the series name in the Expression field. The name of the series in that field will automatically be added to the editor.
Formula language
You'll find a selection of formulas in a list to the right of the editor. These formulas can be used separately or be combined into larger formula. For further information how these work see Introduction to Formula, and The Macrobond formula language. For the complete list of formulas with descriptions and use cases see Built-in formula functions.
Vintage series
This feature requires Macrobond Data+ license.
This feature is available in Macrobond 1.29 and later.
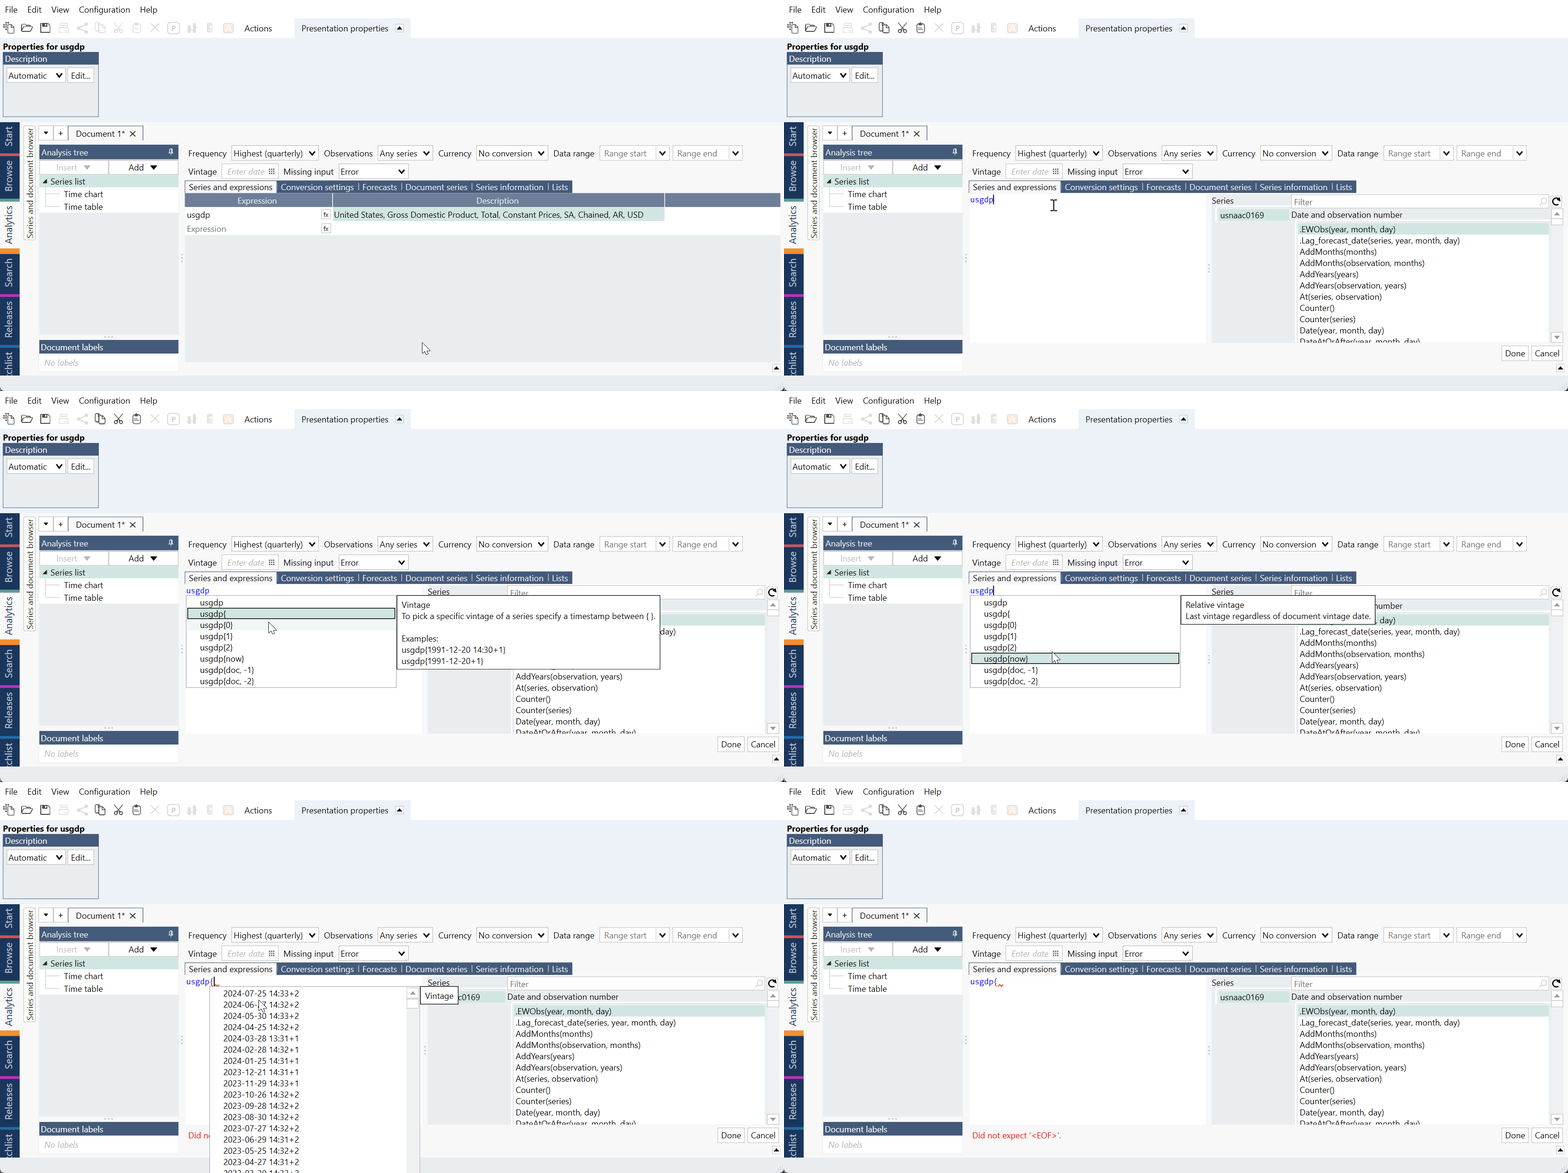
Since version 1.29 when you end typing series code you will see general hints about the possibilities of vintage data (revision history). If you type a { after code you will see all the specific vintages for that series. For more information about this feature see Vintage data (Revision history).

The order of calculations
When making modifications to the data in the Series list, certain operations are necessarily prior to others. Please bear this in mind as it will affect any further changes that are made. Vintage data (revision history) and ratios (i.e., #percapita(segdp) )are treated as standard series.
Whether you perform all, or only a few of the modifications available, you should proceed in the following order:
- Apply the data range, to limit all the time series to a specific range of time.
- Add forecasts to the relevant series in the list
- Select the currency conversion
- Select how to harmonize the observations, and how to treat missing values
- Select the frequency, and if necessary, a method for frequency conversion.
- Handle missing values that were introduced by the frequency conversion
- Apply formulas to the various series in the list (from the inner formula to outer formula).
Drop-downs
Frequency
Here you can choose frequency of the document. By default, it will position itself at the Highest frequency available from all series included in document.
This setting is related to Conversion settings tab. For more information see: Changing the frequency of a series.
Observations
Here you can choose how inconsistencies between different calendars should be handled. For more information see: Observations settings.
Currency
Here, you can select the currency in which all series in the Series list should be calculated. The Currency conversion feature will use an exchange rate series available in Macrobond, matching the original frequency of the series (before any changes made in the frequency of the document). If such series do not exist, Macrobond will either:
- Use the US Dollar to calculate a cross-currency rate (in case it doesn’t find a direct exchange rate series)
- Use an exchange rate series with a higher frequency (in case it doesn’t find an exchange rate series matching the original frequency of your series), using the first value of the period.
After activating this feature in Conversion settings tab option 'Currency conversion method' will become available. For more information about these methods see: Currency conversion.
Data range
Here you can quickly narrow time range of all series in Series list. It will be applied at the beginning of all further calculations and analyses.
Vintage
This feature requires Macrobond Data+ license.
You can download vintage versions (revision history) of time series through Macrobond. Note that not all time series may have vintage data, or they do not have data from the period you want. For more information see Vintage data.
Missing input
Here you can easily choose how Macrobond should treat missing series in lists. For more see Lists of series.
Tabs
Conversion settings
When you change frequency of the document you can control how program will handle the process. You can select same setting for all series or separately for each of them. Note that the lowest frequency is Annual and highest is Daily. Setting 'Partial periods to lower frequency method' will tell program what to do for example with not-full-year when changing frequency to Annual.
Beside frequency conversion you can select here what to do with missing values - this is the only place for this setting and method for currency conversion. For more information see: Changing the frequency of a series and Currency conversion.
Interface is very similar as in Frequency conversion analysis but this tab can only change frequency at the beginning of all calculations.
Forecasts
Here you can add forecast at the beginning of all calculations. For more information see: Adding forecast.
Interface is same as in Forecast analysis but this tab can only add forecast at the beginning of all calculations.
Document series
You can quickly add your own data by creating document in-house here. This in-house will be visible only in that and nowhere else. For more information see: Document Series – adding external data.
Series information
You can use the Series information tab to check metadata information for series you have selected in the Series list. This is an easy way to check series metadata without having to leave the analysis tree.
For more information about customization and things available through this feature see: Series information.
Lists
Here you can organize large numbers of series into handy lists on which you can then calculate. For more information see: Lists of series.