Overview
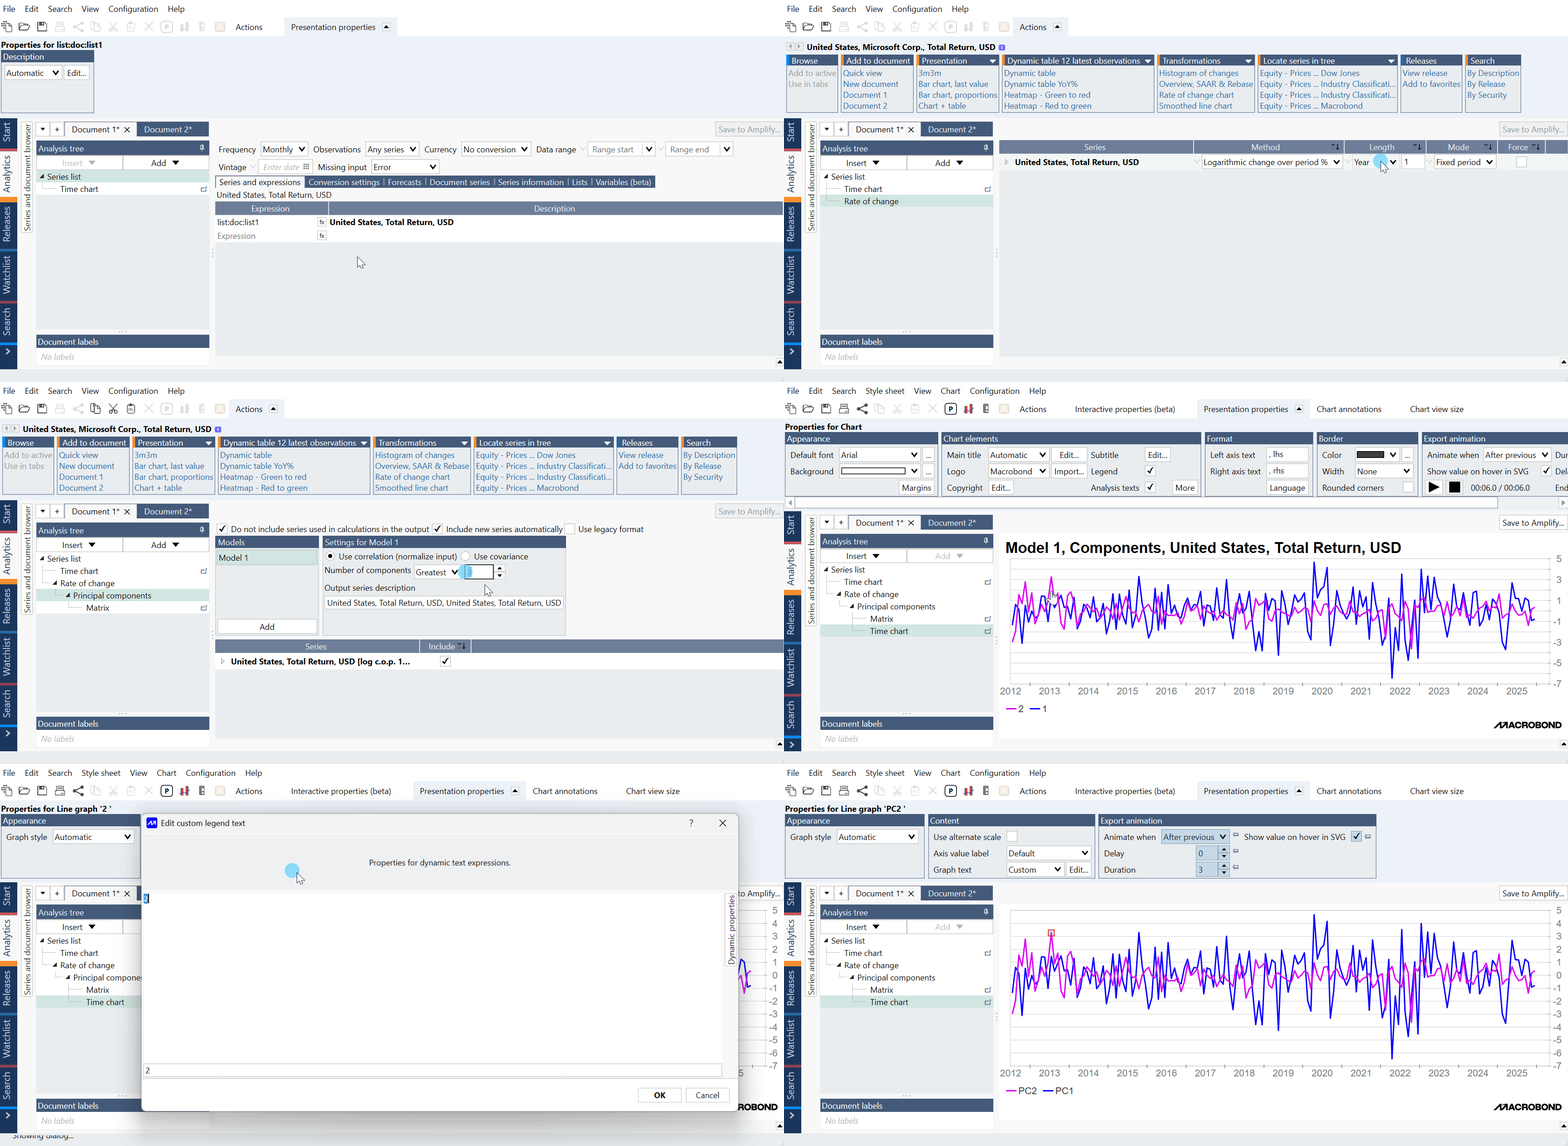
Example of general use of Principal components analysis:
The Principal components analysis (PCA) allows you to calculate a set of linearly uncorrelated series, or components, from a set of possibly correlated series. As a dimension-reduction technique, PCA helps you reduce a set of series to a smaller set of series containing most of the information of the large set.
We provide standard implementation of this analysis. The component series are calculated using an orthogonal transformation so that the first series captures the highest possible variance of the original set. Each successive series captures the highest possible remaining variance under the constraint that it is orthogonal to the preceding series. The analysis also outputs the eigenvectors and the eigenvalues.
Settings
General
Do not include series used in calculations in the output
When checked, any series included in the calculation will be excluded from the output. Uncheck this setting if you want both the original series and the calculation result in the output.
Include new series automatically
When checked, any new series added to the Series list will automatically be included in the calculation.
Use legacy format
Checking this option will enable legacy output meaning the analysis won't group outcome into lists. It will produce separate series for each of the components of each model. Please note that by enabling this option all following analyses will lose their settings.
Select method for creating matrix
Use correlation (normalize input)
The eigenvectors will be calculated from the correlation matrix. This means that the input is centered and normalized before the components are calculated. PCA is sensitive to the scale of the input. Use this setting if variables are of different units, e.g., currencies and indices.
Use covariance
The eigenvectors will be calculated from the covariance matrix. This means that the input is only centered before the components are calculated. Remember that if you choose covariance, the input is not normalized, and the analysis will be sensitive to the scale of the input.
Select series
Number of components
Here the number of component series is defined. These are the principal components that will be calculated and included in the output. This number of components cannot be greater than the number of series included in the analysis.
The components are sorted in order of how much variance of the original data set that they capture. If you select 'Greatest' you will get the most significant series and selecting 'Smallest' will yield the least significant series.
Output series description
Specify the description of the output series or use the default description.
Include
Select what series to include in the calculation.
Output PCA elements
Eigenvectors/Matrix
This is a Matrix renamed to 'Eigenvectors'.
The matrix contains the eigenvectors of the correlation or covariance matrix. These vectors are orthonormal.
Eigenvalues/Category chart & table
This is a Category chart and Category table renamed to 'Eigenvalues chart' and 'Eigenvalues table'.
The analysis yields two category series, one with the eigenvalues and one with the cumulative proportion of the eigenvalues. The latter can be interpreted as how much of the original variance that is captured by that principal component together with all preceding components.
Principal components/Time chart & table
The 'Number of components' setting specifies how many component series should be calculated. The series are either the most or least significant components. In the time series space, the components are projected as the eigenvectors scaled so that the variance is the same as the corresponding eigenvalue.
Projection is internal product of the PC vector with time series. By determining the eigenvectors of the covariance matrix corresponding to successive eigenvalues, we obtain the coefficients of the linear combinations that form the new principal components.
The eigenvectors only specify a direction, and not any magnitude. So to be able to decide a magnitude of the component series, the common approach is to scale the resulting series so that the variance is the same value as the corresponding eigenvalue.
Example
The three main principal components of changes in the UK swap rates are identified using PCA.
Questions
- I have checked 'Use correlation (normalize input)' - is it possible to show this normalized series?
- I have five different sets of data, but the matrix tab only shows the output for one.
- What happens when series have different lengths?
I've checked 'Use correlation (normalize input)' - is it possible to show this normalized series?
The normalization is done on the matrix level, which corresponds to normalizing the series. We never explicitly calculate the normalized series, so it’s not possible to plot it.
I have many different sets of data, but the matrix tab only shows the output for one.
The matrix is built only for the first model in the sequence. So, to see all matrices, you'd need to create five different PCAs.
What happens when series have different lengths?
The calculation is made in the interval where there is data in all series.
