Overview
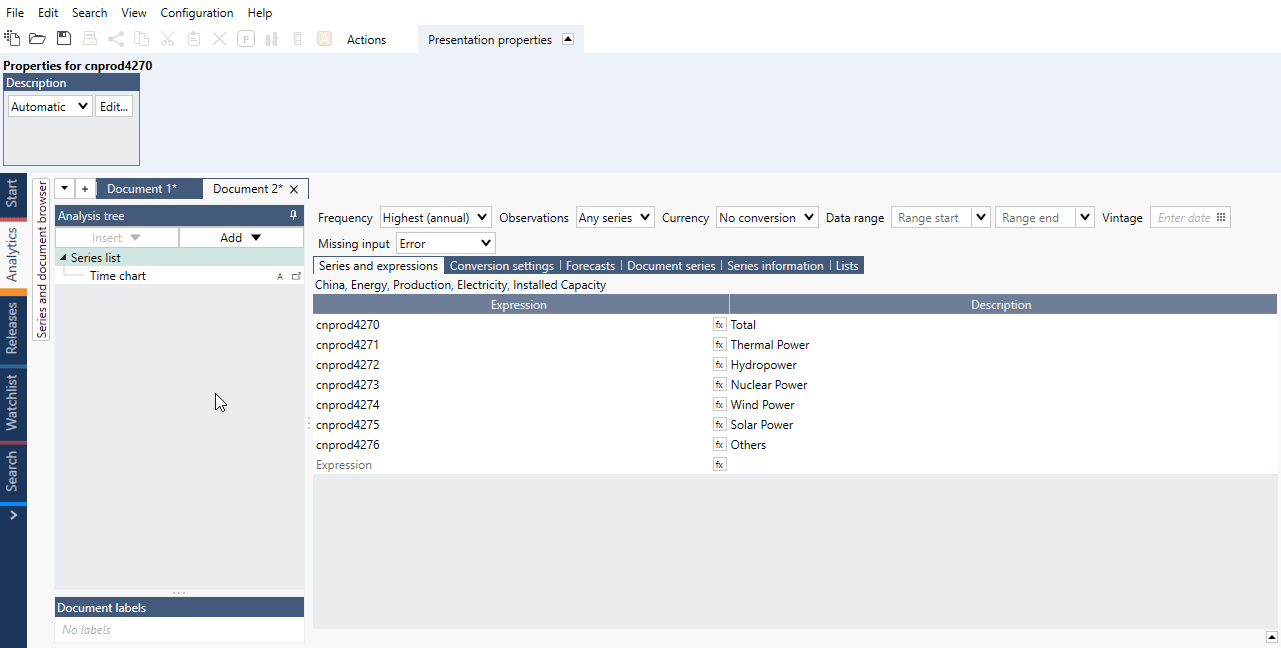
Example of general use of Cross section analysis showing adding up multiple series:
The Cross section analysis produces output series by performing a calculation across a set of input series at each point in time, e.g. average of multiple series.
Settings
Apart from the available calculations and their properties, there are three main settings regarding the output series and the calculation range.

Include only observations where there are values for all series
When this is checked, calculations will be performed only when all series have values. However, if there is a missing value in any of the input series, there will be a missing value in the output. It trims the start and end of the calculation when series are of different length. It's useful feature when series are uneven.
Do not include series used in calculations in the output
This excludes from the output all the series that were used as inputs in the calculation. Only the calculated output series and other series in your document that were not used as input will be visible on your chart or table.
Include new series automatically
When this is checked, any new series that you add to your document will be automatically included in the calculations.
Calculations
Each calculation can have different set of series. To see which series are checked click on a calculation name in Calculations panel.
High
Find the highest observation.
Low
Find the lowest observation.
Mean
Calculate the mean of the observations.
Median
Calculate the median of the observations.
Percentile
Calculate the percentile of the observations as specified by the parameter.
Product
Calculate the product of the observations.
Standard deviation
Calculate the standard deviation of the observations.
Sum
Calculate the sum of the values.
Count
Count the number of observations that are TRUE (>=0.5).
Count valid
Count the number of valid observations.
Average correlation
Calculate the average pairwise correlation of the observations where length defines correlation window.
Average absolute correlation
Calculate the average pairwise absolute correlation of the observations where length defines correlation window.
Lower tail mean
Calculate the mean of the lowest observations as specified by the parameter.
Upper tail mean
Calculate the mean of the highest observations as specified by the parameter.
Examples
With Cross section you can perform several calculations across many series. In this example, we used the MFI interest rates of the main Euro Area countries.
Here the annual distribution of water levels is visualized as percentiles.
Sweden compared to the distribution of several countries and its median.
Use 'Count valid' calculation to trim all series to the first and last common point.
Here, we calculate mean growth of several countries.
In this example we use 'Upper tail mean' and 'Lower tail mean' to calculate average of top 3 and bottom 3 countries.
Here, we calculated the average correlation across all sectors of the S&P 500, on a rolling basis. The application will first calculate the correlation for each pair of series. Then, an average of all these correlations will be performed to get a single series.