Overview
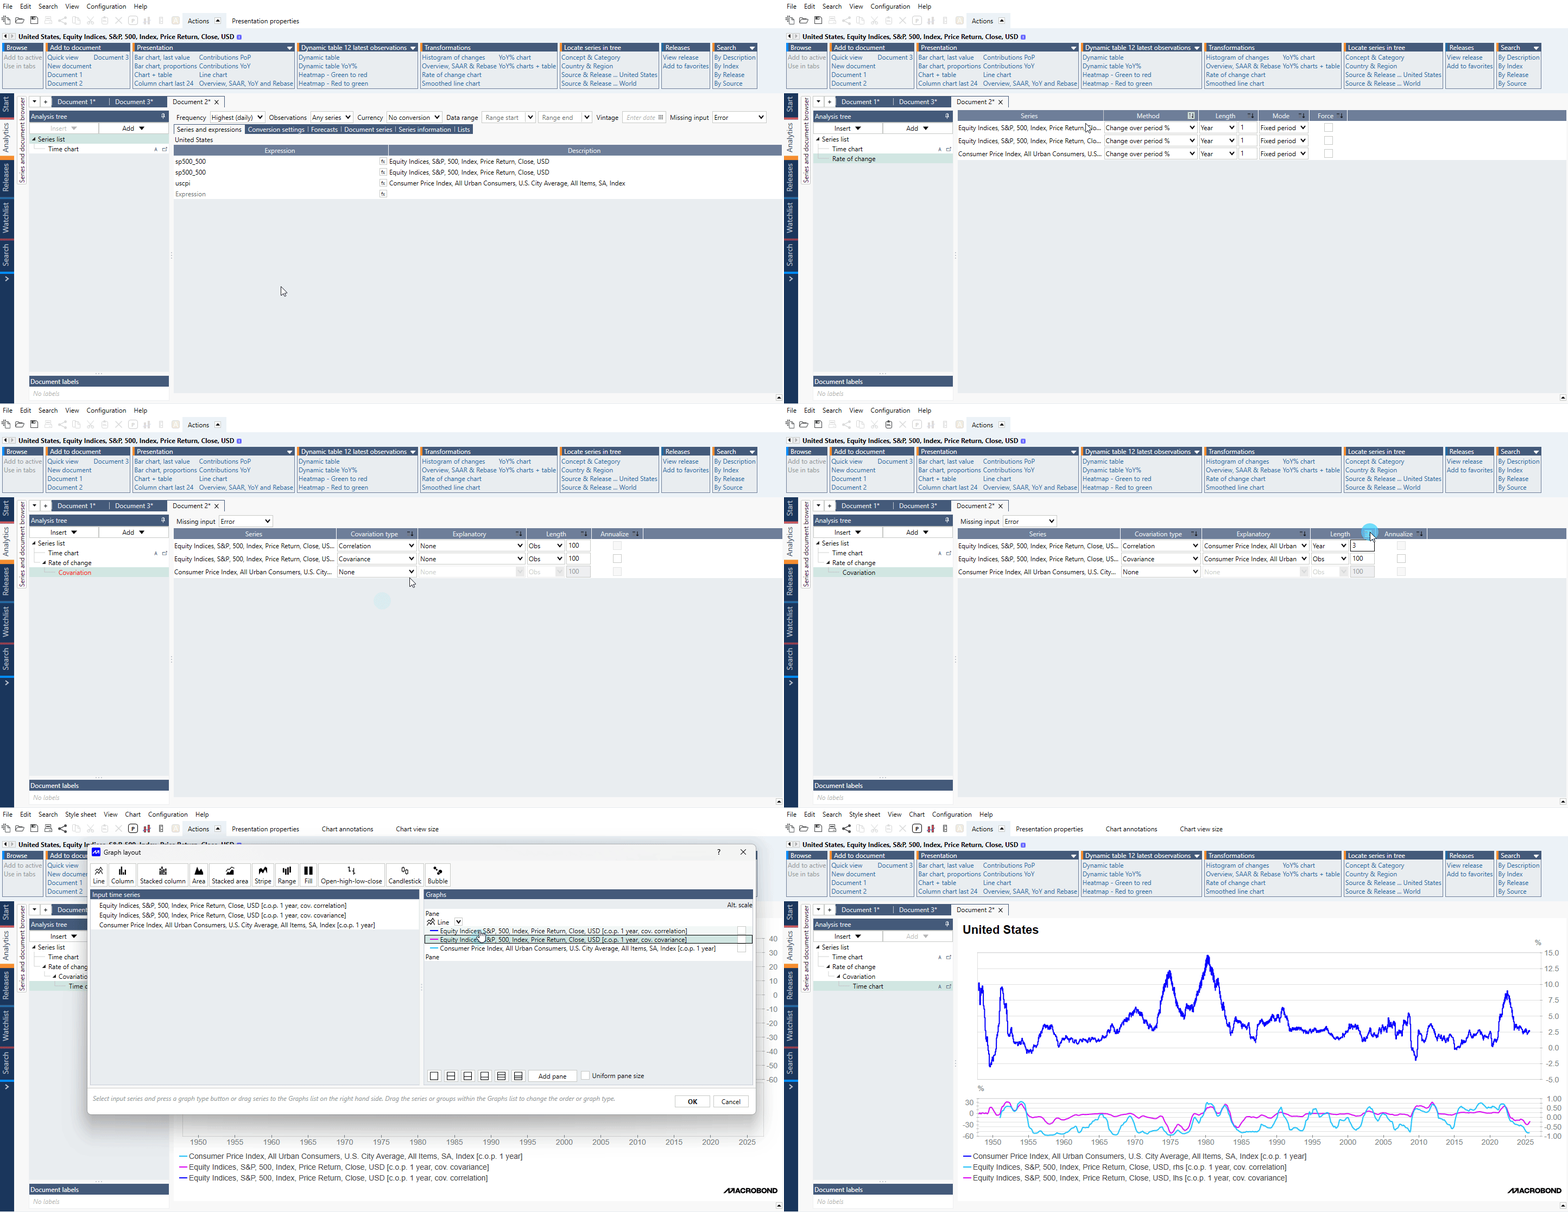
Example of general use of Covariation analysis showing 3-year covariance and correlation on Y/Y series:

The Covariation analysis can measure several statistical indicators on a rolling basis:
- standard deviation
- correlation
- covariance
- linear regression intercept (alpha)
- linear regression slope (beta)
Settings
Covariation type
Select the type of statistical indicator you want to calculate.
Explanatory
Select the series that will be used as explanatory in the calculation. This setting is not available for standard deviation.
Length
Select the rolling window for your calculation.
Annualize
Check this if you want the output series to be annualized. This is only available for standard deviation and covariance.
Examples
In this example, we used the covariation analysis to calculate the correlation between the US ISM PMI and the S&P 500 (transformed in YoY % change) on a rolling window of 5 years.
We duplicated the S&P 500 series in Series list. We did this because the series that is used in the analysis will be graphed as the rolling correlation, and we want to include the original series in the graph as well.
Here, we used the analysis to measure the slope for two stocks to the index they belong to the S&P 500 We decided to the slope on a rolling window of 1 year.
Prior to adding the Covariation analysis, we applied a rate of change to transform the data into daily performance (→ Change over period %, length: 1 .)