Overview
Example of general use of Correlation analysis confirmed by result from formula Correlation():
The Correlation analysis calculates the correlation between series within a range of lags. This functionality is especially useful in detecting the best correlation between two series. A standard output is a category chart with the correlation displayed on y-axis and the number of lags on the x-axis.
Possible next steps can be to apply the Lag analysis on a Time Chart or build a Regression Model using this information.
We use the standard Pearson correlation.
Settings
There are three settings that you can specify in Correlation analysis:
- Data range (Estimation sample range) - you specify the range on which the correlation should be calculated. If left empty, the correlation will be calculated on the full common history of both series.
- Lag range – defines the range of lags on which you want to calculate correlations. This refers to the number of observations, based on the frequency of the document.
- Correlate to – you match series with another one to calculate the correlation between them. The series that will be lagged to measure the correlation is the one on the left side.
Sequence of calculations
This analysis has a set sequence of calculations. Understanding it will avoid wrong interpretations.
First, the estimation sample range for your series is set (in other words, the analysis will consider the history outside of this range as inexistent). Then one of the series will be moved backward & forward in time to calculate several correlation values.
Consequence:
Let’s assume an estimation sample range is set to start in 2005-01-01. The previous history will be ignored in the analysis, as if the previous values do not exist. You therefore have now:
- Series 1 ⇒ start date: 2005-01-01
- Series 2 ⇒ start date: 2005-01-01
Then one of the series (let’s say Series 1) will be lead / lagged by several observations. Let’s consider the correlation calculation when Series 1 is pushed forward by 12 months. The data set will be now defined as:
- Series 1 ⇒ start date: 2006-01-01 (as the series is pushed forward by 12 months)
- Series 2 ⇒ start date: 2005-01-01
The correlation between these two series can only be calculated when both series have values. As a consequence, the correlation is calculated on a range starting in 2006-01-01.
Relative dates
Keep in mind that when using relative dates as start date, it is the end date of the calendar that is used as reference. For example, let’s assume:
- Series 1 ⇒ end date: 2018-10-01
- Series 2 ⇒ end date: 2018-09-01
if we set '-10y' as Start date, the calculation will be performed since 2008-10-01 as the document’s calendar ends in 2018-10-01.

Alternative options
There are several alternatives to calculate correlation in Macrobond:
Correlation Coefficient
You can use the formula: Correlation(series1, series2)
Note only points in time where there are valid values in both series will be included in the calculation. You can use various methods to fill in missing values.
Rolling Correlation
You can either use the formula Correlation(series1, series2, window), or the Covariation analysis.
Best Lag Correlation
You can obtain the same result as the Correlation analysis by using the formula: CorrelationbestLag(series1, series2, startLag, endLag)
How to read output?

First the x-axis:
- If the highest correlation is in the negative side, it should be Lead.
- If on the positive side, it should be Lag.
Then, which series to apply it to?- (3.) From the chart: the result should be applied to the series not described in brackets, here it's the ISM PMI.
- (4.) From the analysis: the output is for the series on the left side (not the 'Correlate to…' series)

Examples
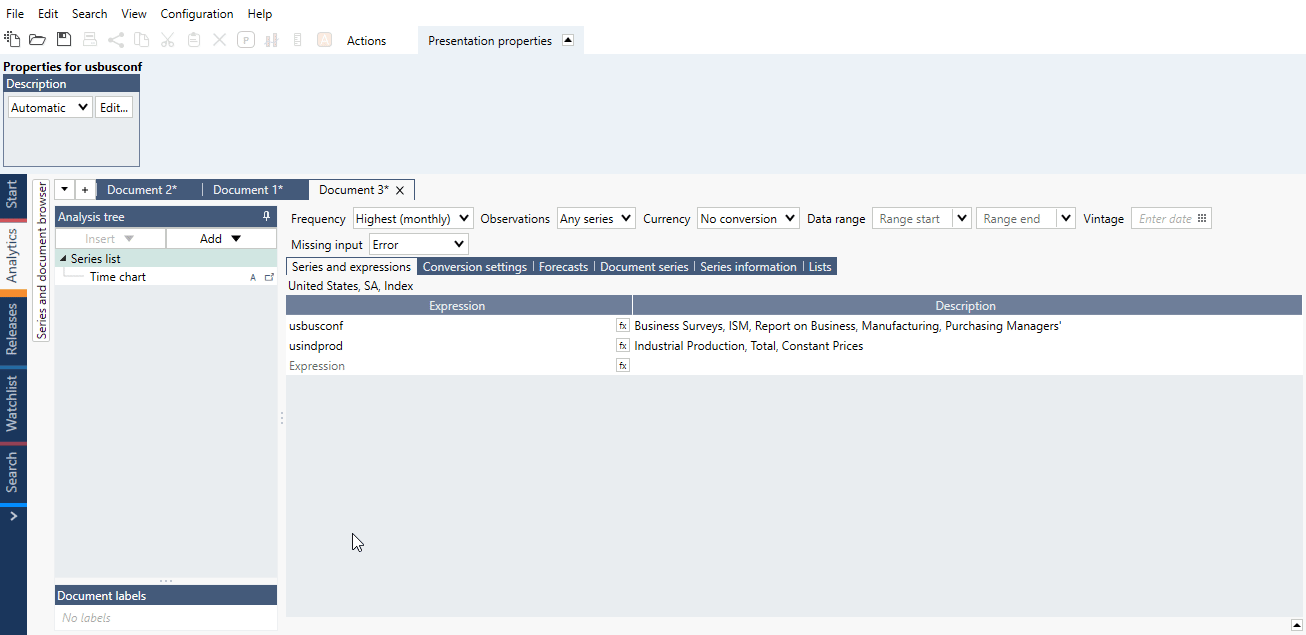
Here, we chose to measure how the US ISM Manufacturing PMI correlates to the US Industrial Production. We set the range of lags to be between -12 months and + 12 months. The analysis will produce a category series.

The output series is presented on a category chart: correlation is on Y axis, while the number of lagged periods is on X axis. The highest correlation appears at the #3 value. This should be read based on how you set the analysis: we chose to measure how the US ISM correlates to the US Industrial Production. Therefore, the result should we read as: The best correlation between the US ISM and the US Industrial Production is when the US ISM is lagged (i.e., meaning pushed forward) by 3 observations.
See how to calculate correlation coefficient only for an entire period, including how to quickly narrow data range.
Questions
How do I calculate the rolling correlation between two series?
There are two main ways to achieve this:
1. Covariation analysis
The rolling correlation can be calculated using the Covariation analysis. Pick an explanatory series and define the window size by adjusting the length.

2. Formula language
Use the formula:
Correlation(series1, series2, window)