- Built-in formulas
- In-app features
- Growth/Increase by % - custom methods
- Extend backward/backfill history
Built-in formula
Extend()
Extend formulas - see comparison here.
Extend with last value to the end of a period
The following formulas, which you can type into the Series list, will extend the input series to the end of the corresponding period:
ExtendToEndOfMonth(series)

ExtendToEndOfQuarter(series)

ExtendToEndOfYear(series)
If you want to mark the extended values as forecasts, use:
ExtendLastAsForecast(series)
Note series will be extended till the end of the common calendar (established at the last step before using this formula) which depends on the series included in document.
Extend with another value to a specified point in time
Using the formula below, you can customize what value is used and until when the series is extended.
Extend(series, observation, number)
It can be translated as Extend(which series, how far, which value) and in order to work effectively you will need helper formulas like Last() or Endvalid(), for example:
Extend(uscpi, Last(EndOfYearAhead(0)), LastValid(uscpi))
will extend uscpi series to end of current year with its last value. While:
Extend(usrate0001, Endvalid(usrate0001)+Monthslength(2), 0.75)
will extend series usrate0001 and will put 0.75 value two months from its end. Observations between end of series and new point will be filled in automatically with series last value. See the file at the start of this chapter to find solution for this (it's another formula).
Extend with YoY percentage from same series
Below formula extends the series using the % YoY change to calculate a forecast for the whole calendar range. New values will be marked automatically as forecast.
ExtendLastYoYForecast(series)
This one has an additional parameter to point to the end of extending range.
ExtendLastYoYForecast(series, observation)
Note series will be extended till the end of the common calendar (established at the last step before using this formula) which depends on the series included in document. But here you can use same method with EndValid() as in previous example:
ExtendLastYoYForecast(series, endvalid(series)+Yearslength(6))
ExtendLinear() vs LinearExtended()
ExtendLinear vs LinearExtended - see comparison here.
Both formulas, ExtendLinear() and LinearExtended(), are used to extend the series. With similar names and purpose, they can be easily confused but they extend the series in different way.
ExtendLinear uses linear interpolation to extend the series between the latest value and a manually specified value in the future, thus extending the series with a trend.
LinearExtended uses the Least-Square method to create a fitted line, which in turn is used to extend the series to a specified point in the future.
Extend trend from part of series
Extend trend from part of series.
Use Cut() and LinearExtended() to calculate trend from sample of the series.
Extend with value x observations from end of series
Extend with value x observations from end of series.
Extend() will put selected value only at the end of extension. Here you can find out how to select one of the values from inside series and repeat it after end of original series.
Extend with x last values and roll them
Extend with x last values and roll them.
Extend() series to create last valid point in the future. Extend series with last few values and roll those values till that last valid point.
Join()
Join formulas - see comparison here.
Joining two series
You can also extend one series with another. For that we have:
Join(series1, series2)
It can be translated as Join(older series, newer series). After last value of series1 Macrobond will add values from series2 from the respective points in time. This can also be modified by third parameter which will point exactly where to connect series':
Join(series1, series2, Start(series2))

Join(series1, series2, Date(yyyy, mm, dd))
Joining two series, one with more history
We also have special join formula for appending historical values before the start of series1:
JoinMoreHistory(series1, series2)
Unlike the standard Join formula this one translates to Join(newer series, older series). It takes all observations of series1 and adds all values of series2 that are before the start of series1.
Joining two series with different scales
For these formulas, a factor is applied to scale up the series. Note that series need to overlap.:
JoinScaled(series1, series2)

JoinScaledAppend(series1, series2)

JoinMoreHistoryScaled(series1, series2)
JoinScaled() works like Join(). It will join series2 at the end of series1. At the date of the junction, series1 (older series) is scaled to match value of series2 (newer series). The rest of the values of series1 are then adjusted using the factor used at the date of the junction.
JoinScaledAppend() is similar to Join() and JoinScaled(). It will connect series at the end of series1, but it will scale series2 (newer series) to match series1 (older series).
JoinMoreHistoryScaled() works like JoinMoreHistory(). It will add more history to series1 (newer series) using the values of series2 (older series) that are before the start of series1. At the date of the junction, series2 (older series) is scaled to be equal to the value of series1 (newer series). The rest of the values of series2 are then adjusted using the factor used at the date of the junction.
Joining more than two series
Join formula can connect only two series. If you need to connect more, please insert one join formula into another:
Join(series1, Join(series2, series3))
Joining many series for different periods (but they start in same point in time)
Let's say you have series presenting values for different periods of time (i.e.; 2024, 2025, 2026 etc.) but they all start in 01/01/2023. The best way is not to use join() but moves them with formula and add them with Cross section.
Join many series with same start point
Join many series with same start point and original series
In-app features
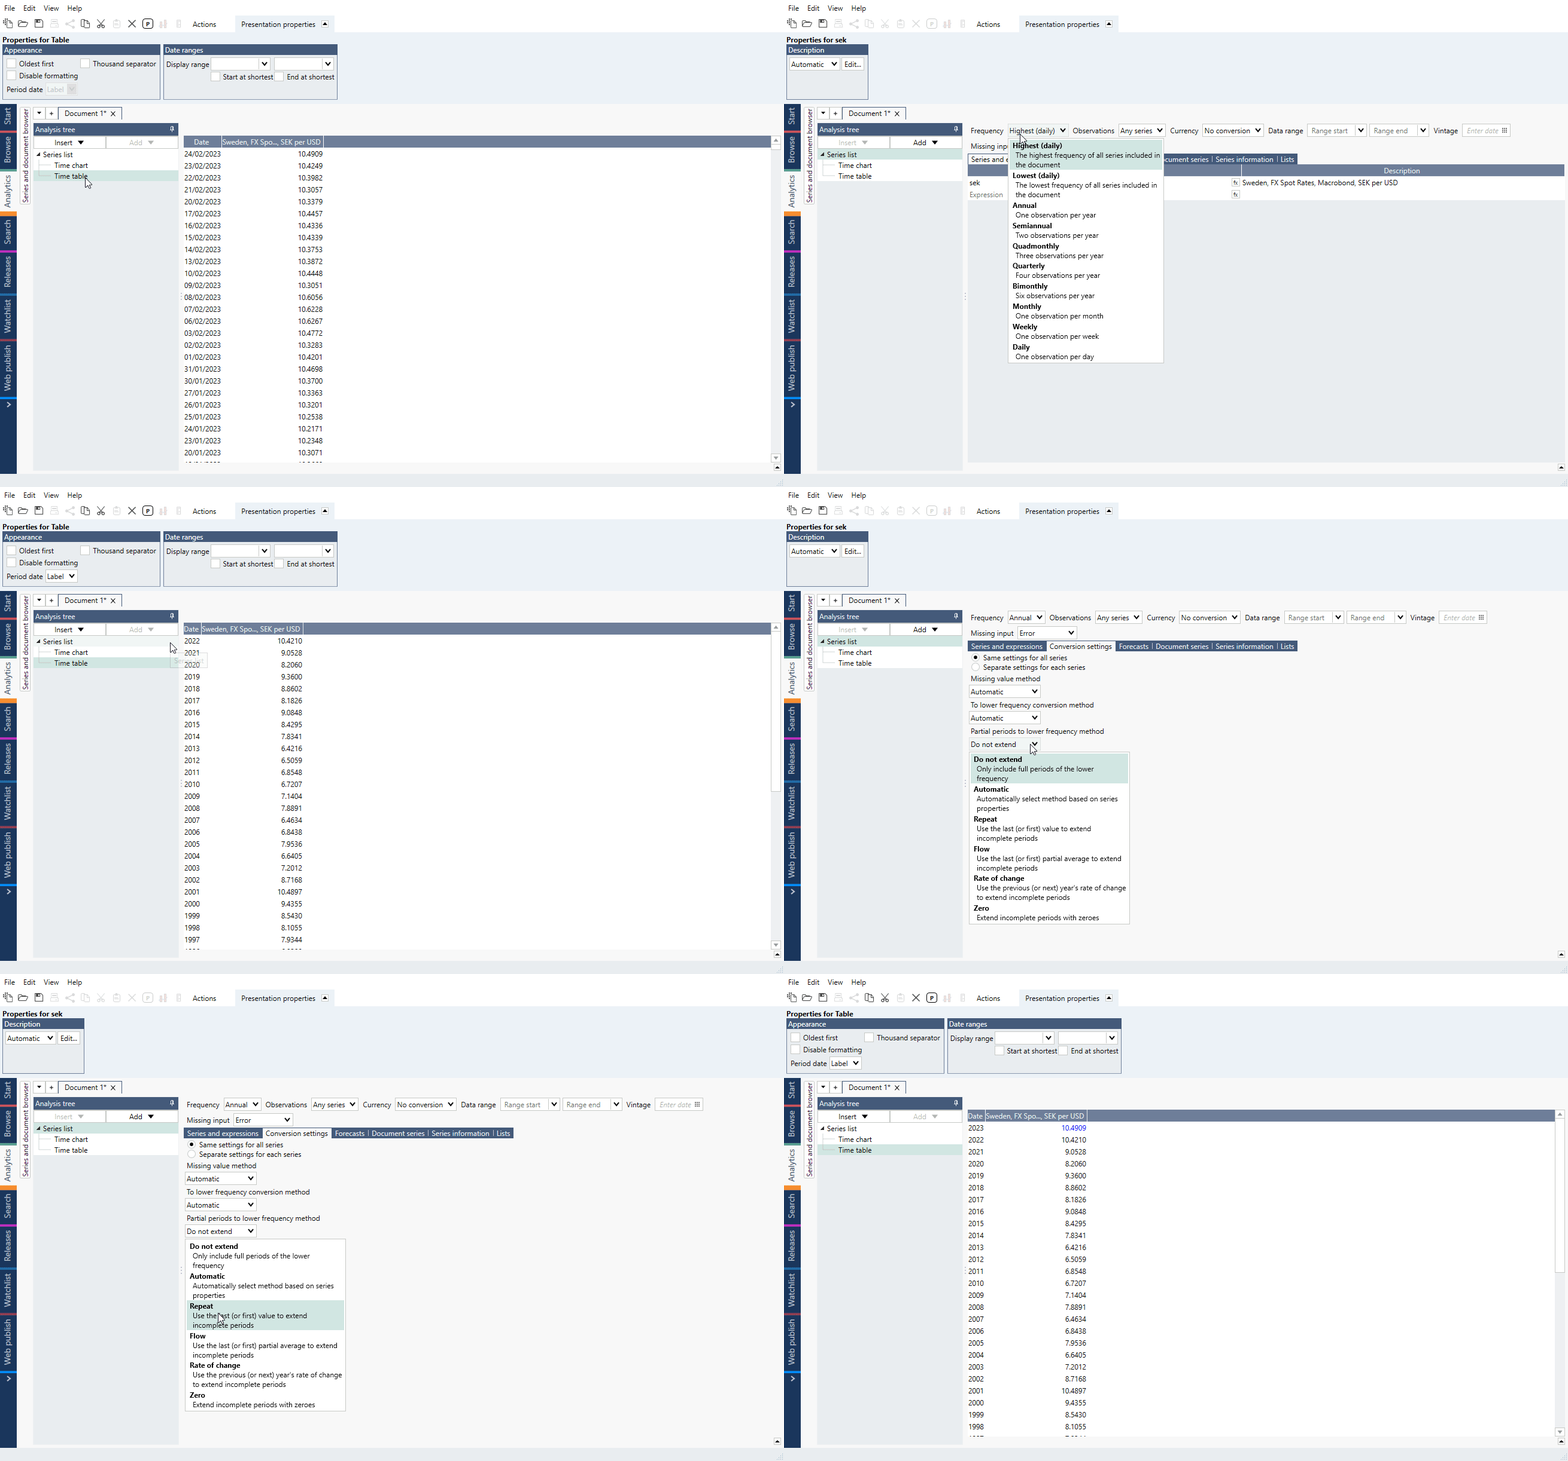
Partial Periods functionality – filling in last non-complete period
If series is for example Daily and you want to convert its frequency to Annual, you will not see value for a current year because there is no 12 months of data - incomplete periods are removed.
In such situations use Conversion settings' 'Partial Periods to lower frequency method'. It will let you choose your preferred setting how to handle incomplete periods and mark the outcome as forecast value.

Forecast tab
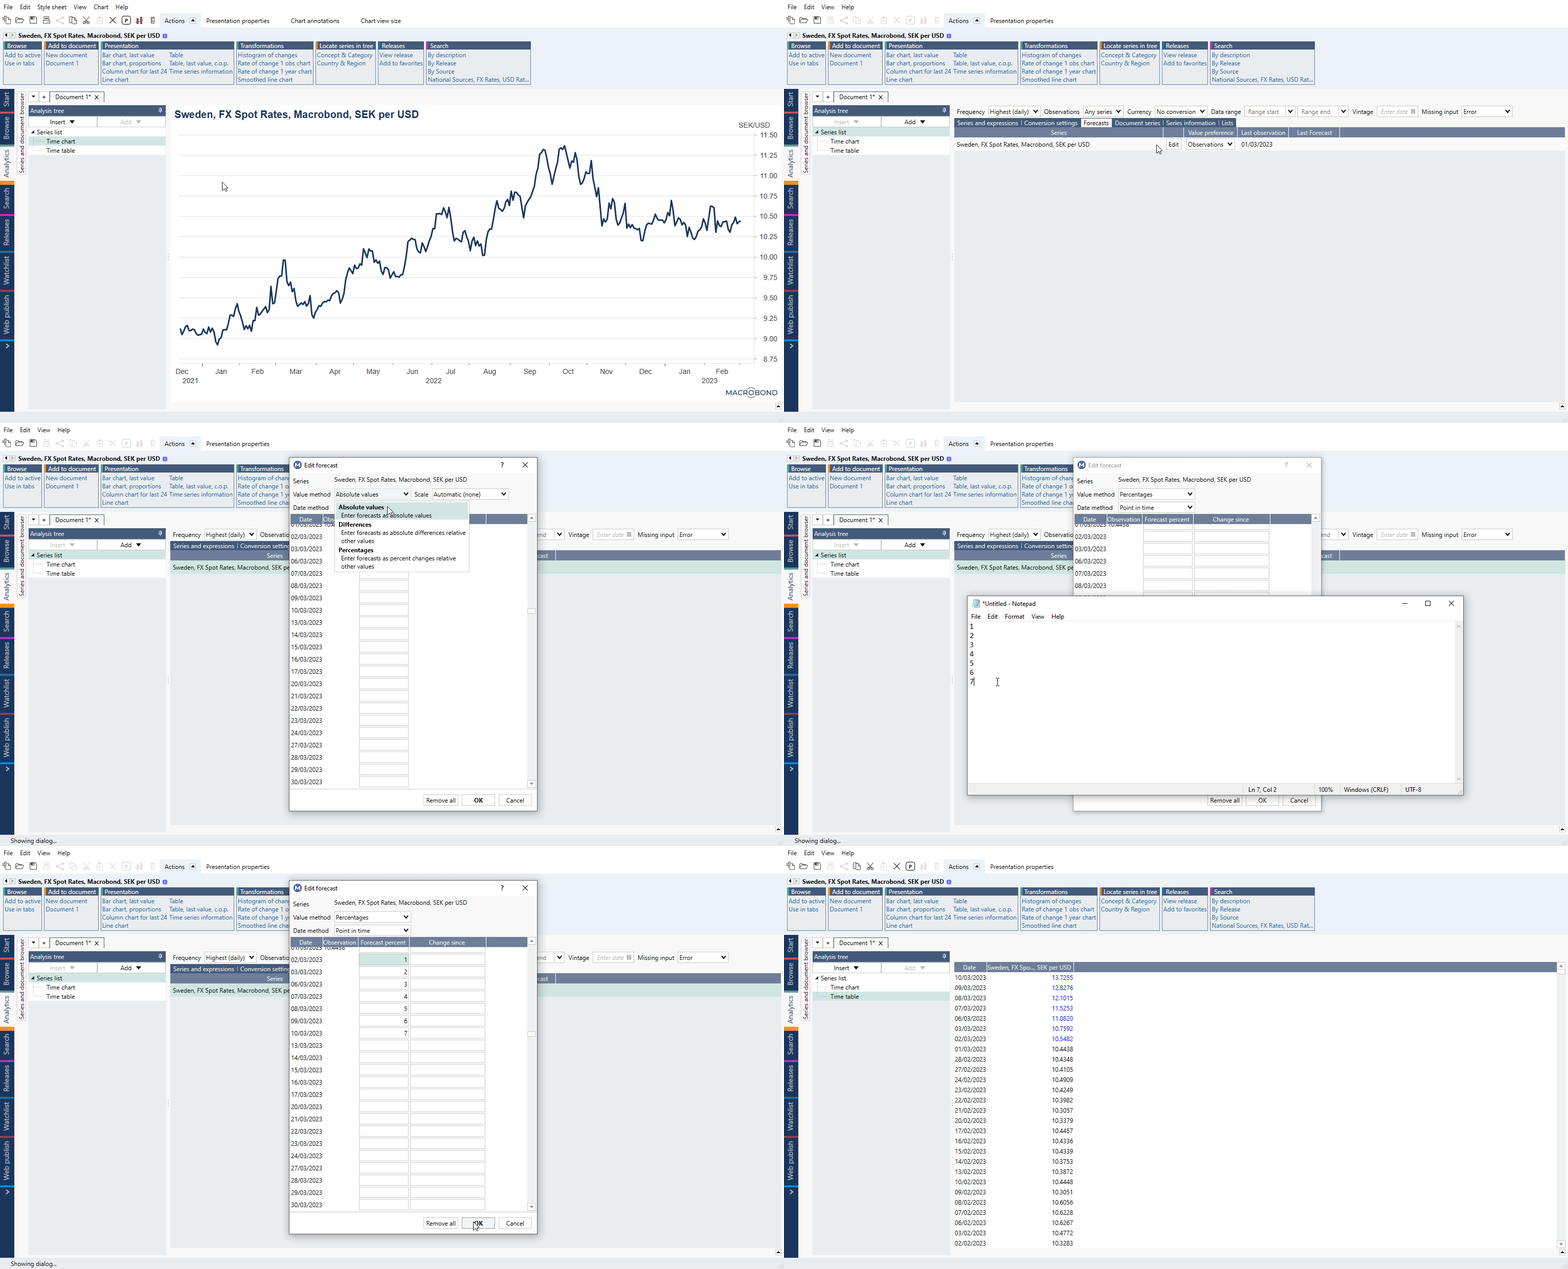
You can add forecast to the raw time series, before any calculations are made through tab on Series list or after calculations through Forecast analysis.
Note that these forecasts will be added in the original frequency of the time series, even if the document uses another frequency.
For more information see Adding forecast on Series list and Forecast analysis.
Extend with points in time
You can add absolute values to a raw time series in the Series list, or after having applied some calculations to it. Values can be added manually or copied (vertically aligned) and pasted in.
When new values will appear forecast will be overwritten unless you change 'Value preference' in Forecast tab/analysis.

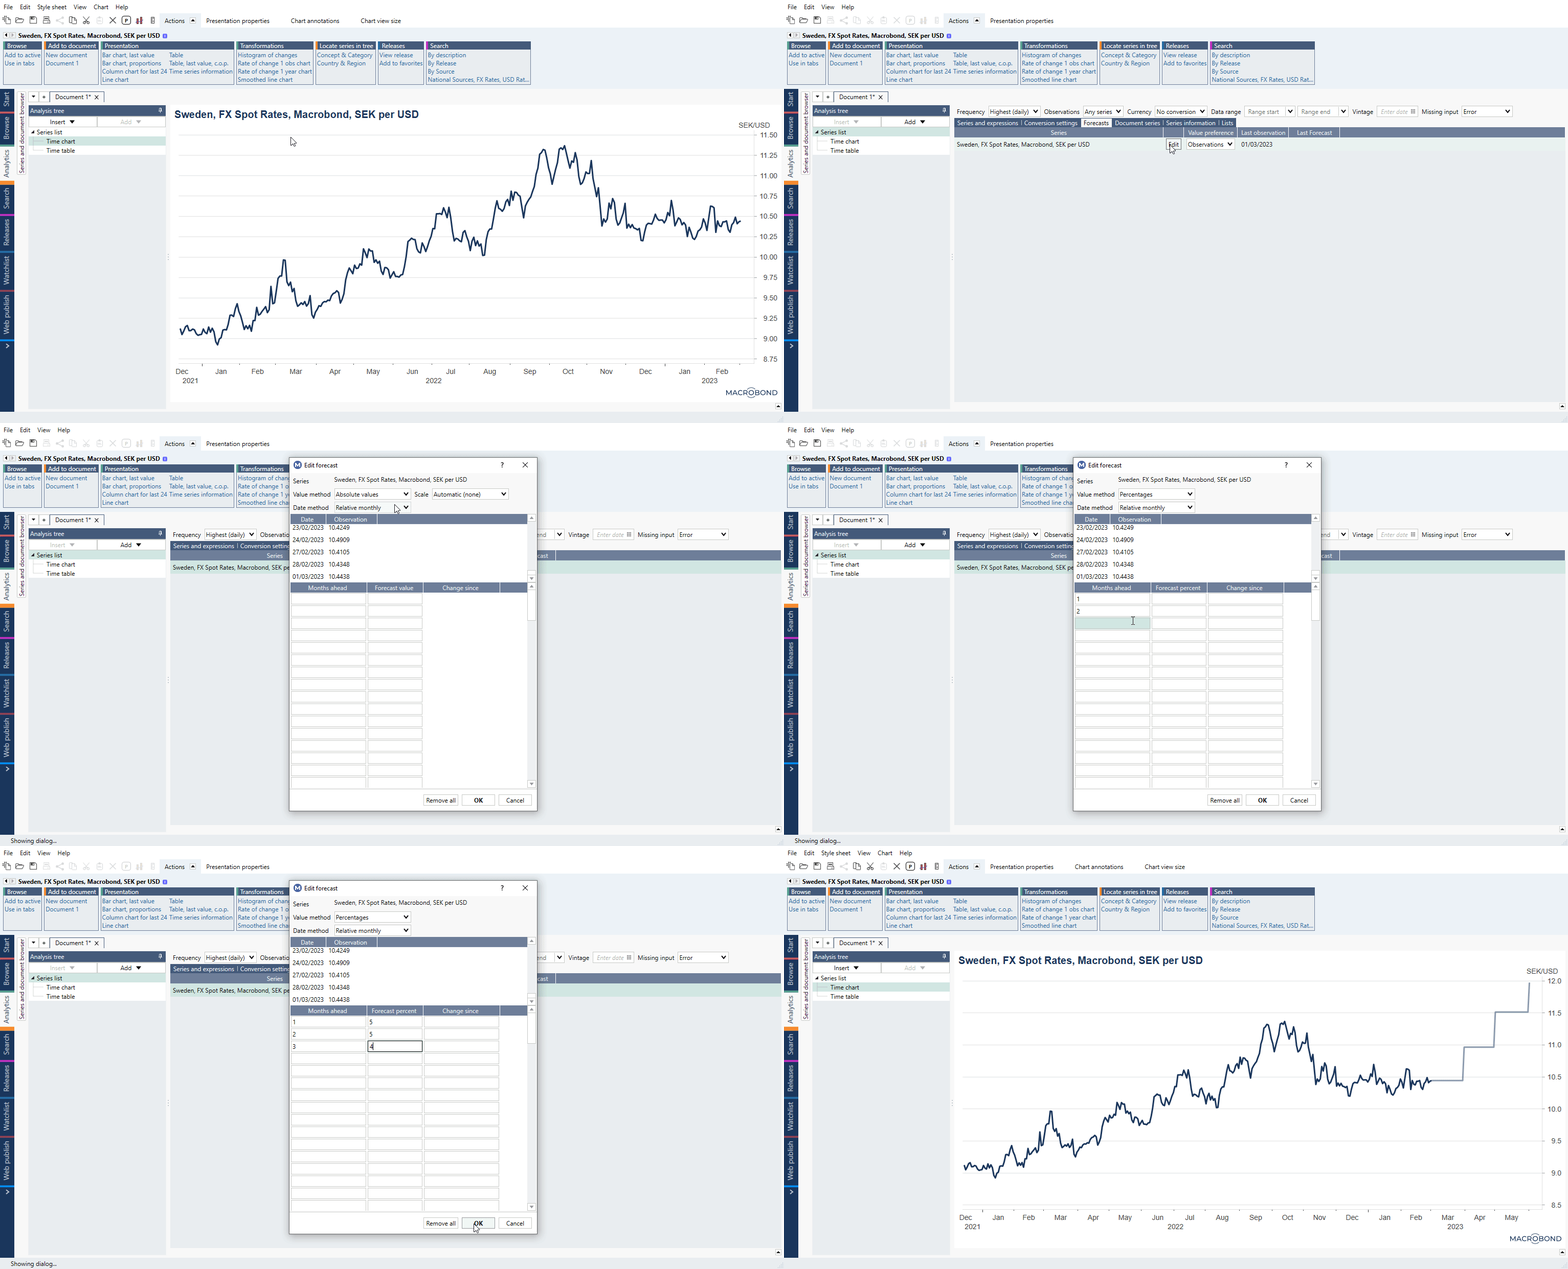
Extend relatively
Forecast can be added as absolute values for each point in time but it can be set as relative. This method will always keep your forecast ahead of existing series.

Growth/Increase by % - custom methods
Extend based on percentage values from another series
When you have one series and you want to extend it based on another series (PoP or YoY) you can do it with Cut() and AggregateProduct():
Extend based on PoP-series (recommended)
Extend based on PoP-series - aggregate joinmorehistory
Extend based on PoP-series - multiple join()
Extend based on YoY-series - multiple join()
You can also extend series when future estimates are in more than one series, you just need a different approach:
Many extends based on different series
Growth
Continuous growth rate and Linear growth rate
Below example is for continuous growth rate of 5%:
AggregateProduct(1+0.05/100)*100
and this one represents Linear growth rate of 2% over time:
AggregateProduct(Pow(1+0.02, 1/round(YearLength(), 0)))*100
Continuous growth vs Linear growth - see comparison here.
Growth Till Date by Level
Custom formula which calculate stable growth by applied level (i.e., 1 % is expressed as 0.01) till a point in the future. That point can be also set as relative for example from the end of original series.
.GrowthTillDate(series, endDate, level) =
 let
  .extended=cutstart( (extend(series, endDate, LastValid(series))) , end(series))
  .lastWithMultipliers = (if(counter(.extended)>end(series), 1+level, if(counter(.extended)=end(series), series, 1)))
 in
  join(series, flagforecast(AggregateProduct(.lastWithMultipliers)))
 end
See more information about under How formula with dot works? and User defined formulas.
Growth by Annual Rate
Custom formula which can calculate annual rate starting from any point in time of a series till any point in the future.
.GrowthByAnnualRate(baseSeries, annualRate, startDate, endDate) =
let
  .rate = Pow(1+annualRate/100, 1/YearLength())
  .base = At(baseSeries, startdate)
  .period = CutStart(Extend(.base, endDate, .base), startDate)
in
  .period*Pow(.rate, Counter(.period)-startDate)
end
See more information about under How formula with dot works? and User defined formulas.
Growth with first point after certain value
Select a value - when series will hit this point formula will calculate growth factor. Next it will calculate future values based on this growth factor.
Growth with first point after certain value
Increase by X% each year, month or day
We recommend using Forecast - extend relatively. With this function your forecast will always be ahead of series. It has relative weekly, monthly, quarterly and yearly setting.
Daily
Series begins at Date() with value 0 and then increases 0.5/360 for every calendar day
if(Counter()>Date(2018, 04, 05), (Counter()-(Date(2018, 04, 05)))*(0.5/360), 0)
or
AggregateProduct(If (Counter()>Date(2018, 04, 05), 1+(0.5/360), 1))-1
After Date() increase by daily - see comparison here.
Trend lines
joinmorehistory(lag(AggregateProduct(1.5)*100, 1), 100) 50% daily growth
joinmorehistory(lag(AggregateProduct(1.2)*100, 1), 100) 20% daily growth
joinmorehistory(lag(AggregateProduct(1.1)*100, 1), 100) 10% daily growth
joinmorehistory(lag(AggregateProduct(Pow(2, 1/5))*100, 1), 100) double value every 5 days
Trend lines (x% daily growth) - see these formulas used in COVID chart.
Increase by X% each time period
This example uses helper series created with AggregateProduct() creating new values based on increasing '1' by X%. Values are created since a particular Date() and extended till the end of original series. Then outcome is Rebased relatively by original series.
Increase by X% each time period
Extend backward/backfill history
Backfill history
This feature is available in Macrobond 1.30 and later.
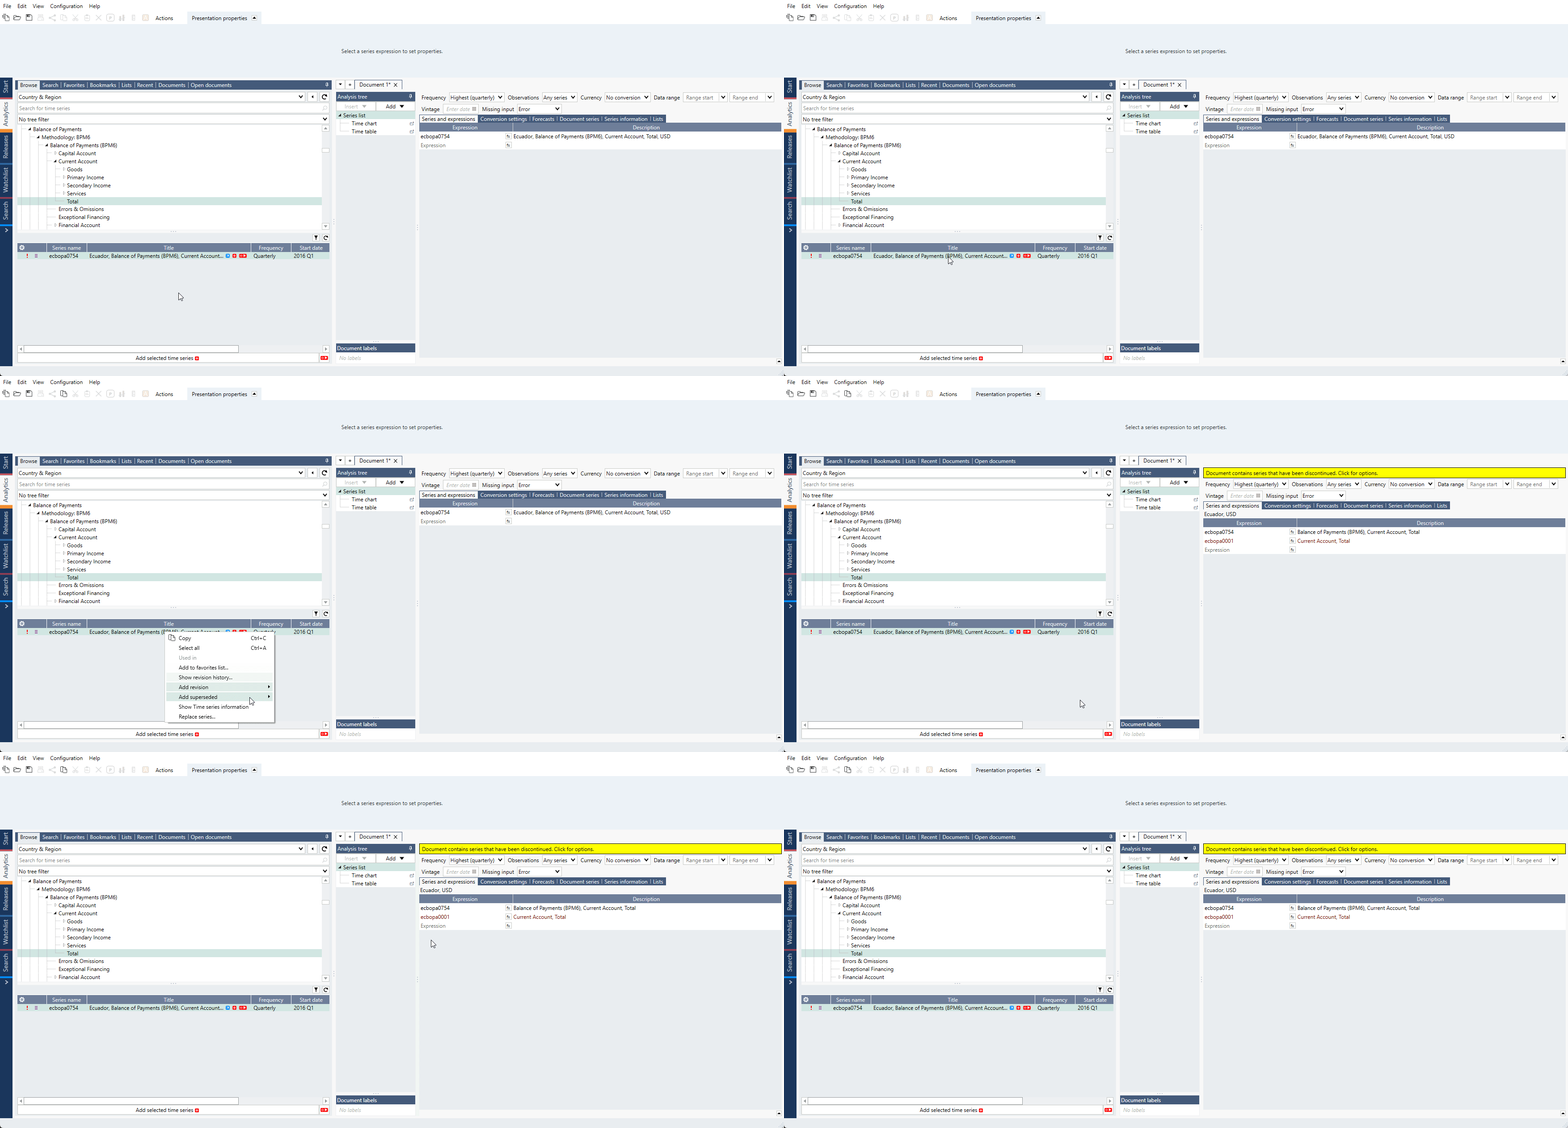
Macrobond may be required to create a new time series with a recent historical start point if there is a change made to the methodology of the time series or any other change. You can now easily locate related discontinued time series by right-clicking on series and selecting 'Add superseded'.
You can combine series with formula, for more information see Join().
Create in-house and use join
Create an Account in-house and then use join() formula to connect older values with series. This is the best option we can recommend right now.
For more information see Creating Account in-house and Join().
Join shorter series with 0
If another series has more historical values and you want to match its time frames, use formula:
join(0, series, Start(series))
Note it will add as much 0 values as there is points in time in common calendar. It won't add anything if all series start in the same moment.
Add 100 at the start of series (for recursive formulas)
Use below formula to add 100 at the start of series:
JoinMoreHistory(100*AggregateProduct(1+fx:s1/100), 100)
