- Macrobond 1.31
- Easier customer access to Macrobond via MS Entra
- New Popularity score
- Additional flexibility for logo placement
- New chart annotations
- More flexibility for Quick Views
- The full Data exploration experience in Analytics
- Enhanced search capabilities in the Excel add-in
- Updated tree classification
- Refreshed Macrobond Chart Library
- Apply template to multiple documents at once
- Data
- Feeds and Integrations
- Data Explorer
- Appendix - Easier customer access to Macrobond via MS Entra (Full details)
Macrobond 1.31
Easier customer access to Macrobond via MS Entra
The latest update to the Macrobond application introduces the ability for users to log in using their Microsoft Entra identities. This enhancement aims to streamline the login process and improve security by integrating with Microsoft's identity platform. Users will need to connect their Macrobond account with their Microsoft Entra account during their first login after the update.
To enable this feature, users must create an app registration in Microsoft Entra and provide specific information to Macrobond's support team. This includes the Application (client) ID and Authority URL. Detailed instructions on how to complete these steps can be found here.
Once configured, users will experience a seamless login process where their Macrobond and Microsoft Entra accounts are connected. This update also includes support for OAuth authentication for Web API Series Providers, enhancing the security and functionality of the application.
Find the most used time series at a glance with the new Popularity score
Ever scrolled through a long list of search results and wondered which time series are actually being used the most? Now you can find out instantly.
The new Popularity column is available when navigating the tree structure or using the search engine. It is visually displayed as a relative strength bar that reflects how frequently each time series has been accessed, compared to others in the same view. The higher the score, the more popular the series.
This is part of our broader effort to make it easier to explore Macrobond data and faster to find the data you need. By seeing what other users are engaging with most, you can make quicker, more informed decisions — especially when browsing long lists of similar-looking series or when you're looking for widely used data for your analysis.

To sort results per relative popularity, you can click on the column header “Popularity”. The first click sorts from lowest to highest, a second click will then sort the results per highest popularity. A third click will disable the sorting.
Additional flexibility for logo placement in charts
Need to move the logo on your chart to a different corner? Now you can!
![]()
If you want the flexibility to embed your logo within the chart area and move it around, enable the “Inside chart area” option, then use the position and margin options to adjust the specific placement. This setting is also available in the Stylesheet activity, when you create and edit your own corporate template.
New chart annotations available
Curved arrows
Curved arrows are here! Chart annotation just keeps getting richer.
Embellish your charts with easily placed and formatted curved arrows, making your visual message clearer and even saving your publishing and marketing colleagues from having to annotate the charts in a different tool!
Simply select Curved Arrow from Chart Annotations...

Draw the arrow where you want on the chart canvas, adjusting the slopes with the handles. Customise color, thickness and arrow style...

Double headed arrow style and arrow size settings are also available for standard arrow annotations.
Curved lines
Curves lines work in a similar fashion as curved arrows: you can adjust the start and end points and the slope using the blue dots displayed around the line.

Circles
Circles have also been added as annotations. You can use the blue dots displayed around the circle to define its size, or use the “Radius” setting in Presentation Properties to set it more accurately.
More flexibility for Quick Views
We’ve enhanced the Quick View feature, released in the previous version, giving now users the ability to create and save their own Quick Views.
Step 1: My Templates
A dedicated activity, called “My Templates” is now available to create your own Quick Views.

When creating a new template, the following screen will appear. In essence, you will need to create a Macrobond document with the presentations – charts and or tables – you intend to use in the Quick View. The screen replicates how Analytics looks, except for the blue section, which is where you will define the layout of the Quick View.

In this example, we want to create a Quick View composed of:
- One chart with a 3months / 3months % SAAR calculation
- One chart with a standard year-on-year % transformation
- One table with the transformed series
Step 2: Creating the calculations and presentations

Important Note:
The Quick View feature uses the List feature to store time series. This has several implications:
- When adding multiple series to one Quick View, they will be added to a common list, meaning that they will all share the same set of calculations.
- The list feature is not compatible with several analyses that require to set settings for individual series. Example: the Regression analysis requires to set a dependent series, which cannot be done through the List feature.
Step 3: Adding the presentations to a page
Next step is to create the Quick View layout.
- You need to add a Page in the Presentation section
- You can then drag & drop the relevant Presentations in the Page, use CTRL+Q, or right click on a Presentation > Add to presentation part.
Step 4: Defining the page layout
The final creation step is to define the layout: how do the charts & tables should be organized in the Quick View?

You will have various layout options on the top-left part of the screen, allowing you to divide the presentations in one or several columns.
For additional customization, you can use the Bento setting. With Bento, you define first the number of rows and columns you want to split the layout into. You can also merge cells, or “graphs” as we call them, by dragging them together with the mouse. In our example, we merged “graph 3” and “graph 4” together.
Step 4b: Creating multiple pages
As part of these enhancements, you can also create a Quick View containing multiple pages. This would for instance allow you to have a first page with a main overview, together with additional pages presenting different calculations or details instead of creating several independent Quick Views.
Using the previous steps, we created several pages in the template:

Step 5: Saving the Quick View
Once you’re satisfied with the result, you can save the Template and decide on its storage:
- Personal Account: only you will access it
- Department / Company account: allowing you to share a Quick View with colleagues
Note: We recommend using your Personal Account to store Quick Views, except if you and your colleagues agreed on sharing relevant Quick Views together. This, to avoid overcrowding the space allocated for them in Presentation Properties, and keeping the list relevant for yourself.

Step 6: Defining keyboard shortcuts
As a reminder from the previous release, you can assign keyboard shortcuts to your preferred Quick Views.
To do so:
- Go to the “Configuration” menu > Settings
- Navigate to the tab “Quick View”
- Select the keyboard shortcut you want to re-assign
- Pick the Quick View you want to use
Step 7: Using Quick Views
As a reminder from the previous release, you can access Quick Views in multiple ways:

Once you select a time series in the Data Browser, you can:
Option 1: interact directly on time series, either by:
- Pressing Enter
- Clicking on the green icon
The Quick View chosen as default will open.
Option 2: use the Actions tab to navigate across the various Quick Views available
Option 3: use keyboard shortcuts
Option 4: once a Quick View has been applied, you can use the drop-down menu above the Overview section to select a different View.
Adding & replace:
To add more series to an opened Quick View, you can either do:
- CTRL + click on the green icon
- CTRL + Enter
- CTRL + double click on a series
To replace the last series added to a Quick View, you can either do:
- ALT + click on the green icon
- ALT + Enter
- ALT + double click on a series
The full Data exploration experience in Analytics
The Analytics activity now includes the full suite of data exploration capabilities from Browse and Search, making it the hub for data, analytics and charting.
When launching the new version for the first time, you will notice that the Browse and the Search activities have disappeared from the main vertical list of activities.
They are now secondary modules, which can still be accessed using the arrow drop-down.
Tip: the last secondary activity opened will remain visible in the primary list. If you like using the Search activity, keep it active for quick access.

Searching for Data in Analytics

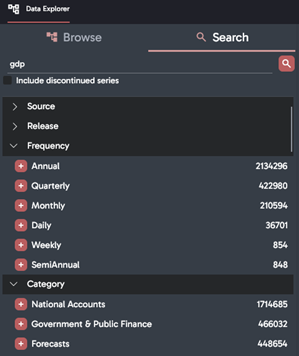
The left pane of Analytics is built for data exploration. Several navigation tabs – circled in red – are available. We’ve renamed the tree exploration – previously called “time series” – to “Browse”.
The Search tab now allows you to apply filters as well as using “quick filters” that are based on our current search results.

The drop-down “filter on” menu gives you access to the most common metadata fields you can filter your search query on, for instance frequency, seasonal adjustment, or to include discontinued series.
Tip: as a reminder, you can also use the “-“ sign in the query to exclude specific keywords and refine your results.

“Quick filters” are listed on the right side of the screen. They are generated based on the current search results and allow you to refine your search query with a single click. For instance, by selecting a specific source, publication or data category.
You can collapse / expand specific filters using the arrow button – circled in red above – to facilitate the navigation across the list of quick filters available.
Tip:
Analytics being the hub for data exploration, analytics and charting, you might be focusing on specific panes during your research journey. To ensure you have the dedicated space available on the screen, we’ve enabled pin buttons allowing you to hide specific sections of Analytics.
This includes:
- The entire data navigation pane
- The Quick filter pane in the Search tab
- The analysis tree

Do not hesitate to customize your Analytics environment to your own preferences. Using them will help you maximizing the space available in the screen. When unpinning an item, it will then appear as a vertical icon.
Hovering the mouse on it will make the section pop-up and allow you to navigate in it. In the screenshot below, we’ve unpinned the data navigation section. Hovering the mouse of the vertical icon will still allow us to navigate the data when needed.
Enhanced search capabilities in the Excel add-in
Quick filters are now available in the Excel add-in, helping you narrowing results from your search queries based on a set of metadata, including sources, releases, data categories, and more.

Updated tree classification
To provide a clearer view on the databases available in Macrobond, we’ve updated the tree presentation in the data browser.
Our core databases are now grouped under “Macrobond Core Datasets” and “Macrobond Additional Datasets”. Databases requiring additional subscription are now listed under “Third Party Datasets”, while “My Data Sources” groups your internal content and API integrations.

Refreshed Macrobond Chart Library
The Macrobond Chart Library contains charts & models built by Macrobond specialists made available directly to our customers via the library, which has grown significantly over the past years.
It was time to restructure it to provide a better user experience when you are exploring the Library for idea generation. It is now consolidated across three main topics:
- Regions & Themes
An always up-to-date folder of charts & models organized in a thematic way, by country. This is the ideal place to look for new ideas as well as accessing the most common charts for a given topic, without having to create them by yourself from scratch. Our team will continuously expand the folder with new content. - MB Publications
This is where past Macrobond publications will be stored, as archive. We will also store chart packs, in the form of presentation documents, for our future publications. - Feature Examples
Library of examples illustrating how to use specific formulas, analyses or chart types.
Note 1: If you have been using charts from the Library in your own Presentation Documents, or added them in your Watchlist activity, the links will break and you might need to add the charts again.
Note 2: do not hesitate to use the “Notifications” feature to say alerted when new charts are made available.
To enable notifications, use the “Documents” tab in Analytics, and navigate to the folders location you want to track for updates.
Right click on the relevant folder, and choose “Subscribe to folder”.

A new window will appear, letting you define for which situations you want to be notified.

Windows notifications will then appear, based on the settings you defined previously.
A summary of the most recent notifications is also displayed in the Start Page:

Apply your corporate template to multiple documents at once
Updating your existing documents to a newest corporate template has been made easier!
When selecting a stylesheet in Analytics, you can now choose to “apply it to all open documents”. In the example below, it allowed us to update the template for the five Macrobond documents that were opened, all at once.

As a reminder, accessing Stylesheets in Analytics is done via the top menu bar:

Data
Integration of Surveys in the U.S. Labor Market category
As part of the continuous improvements we are bringing into data navigation, we’ve moved surveys and indicators related to labor markets into the Labor Market category, making sure all related labor market data can be accessed in one place. These were previously located in Surveys & Leading Indicators.
For now, this applies to the United States only.

Improved navigation across Canadian provinces data
To facilitate comparisons between Canadian provinces, we’ve mapped comparable provincial concepts in the Concept & Category database.
When navigating the Concept & Category database, you will a “Subnational Concept” category. This is currently available for the United States, China, and now Canadian provinces. Datasets are structured per themes, returning all sub-regions for a given concept.
The added benefit for your day-to-day workflow is the ability to apply “Change Region” on such data.
In the screenshot below, we created a chart for Alberta, displaying inflation and job vacancy rate. Using the Change Region feature, I can now flip the whole document to any other Canadian province in one click.

Feeds and Integrations
New API endpoints to query release-specific information
You can now request forward-looking event dates and types on the release level in the Data Web API. Using a dedicated set of endpoints:
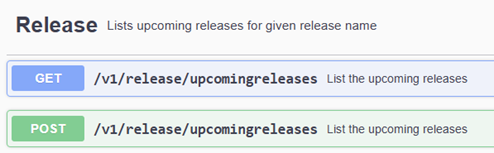
Example: api.macrobondfinancial.com/v1/release/upcomingreleases?n=rel_usbeana will return the usual release metadata, now enhanced with the ‘events’ section:
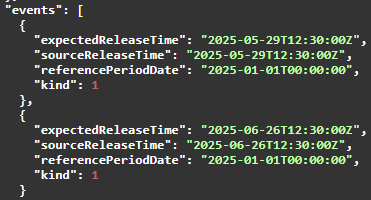
Where ‘kind’ is one of the following event type:

Users of the Macrobond Python API can also use a dedicated function documented here: https://macrobond.github.io/macrobond-data-api/web/web_api.html#macrobond_data_api.web.web_api.WebApi.upcoming_releases
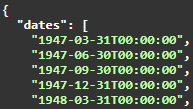
Replicate series class from COMAPI to WEBAPI: DatesAtEndOfPeriod
Data+ comAPI users have been able to return the array of observation dates as of the end of the observed period. Data Web API users could only use observation dates as of the beginning of the observed period. Data Web API users can now tweak the observation period at the request level. Example:
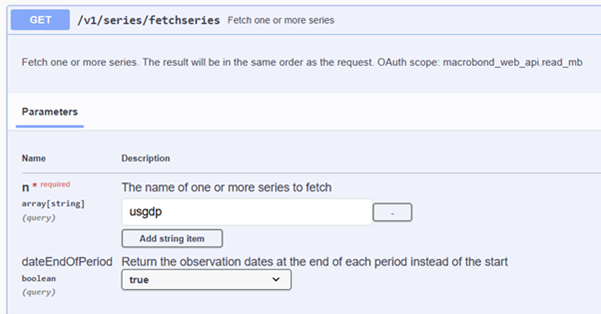
And switch from:
To:
Tools for data partners to self-integrate content on Macrobond ONE
In this first iteration, Macrobond will offer to its data partners on Macrobond ONE a storage facility on AWS S3 to load and update the content sets. Documentation and guidance will be provided to load content full files only (no delta file support at this stage), and a tree file in order to model the content set in a Macrobond tree structure. Note that in this release, Macrobond will only support .json content files.
Data Explorer
Macrobond Data Explorer is replacing Macrobond.net
While the product comes with overall feature parity, there are some differences detailed below:
| Macrobond.net | Data Explorer | Explainer | |
| Navigation | |||
| Home Tab | 🟢 | 🟠 | This tab will receive new content in the main Macrobond Application. Until then, it is removed from Data Explorer |
| Full tree structure | 🟢 | 🟢 | |
| Series metadata | 🟢 | 🟢 | |
| Column customisation | 🟢 | 🟢 | |
| Data | |||
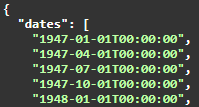
| Discontinued series | 🟠 | 🟢 | You can now find discontinued time series:
|
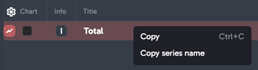
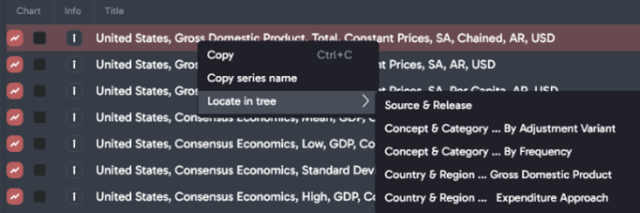
| Copy series name | 🟠 | 🟢 | You can right click and copy the primname of a time series
|
| Connect to customers’ proprietary database | 🟠 | 🟠 | Is a feature considered for future development |
| Charting | |||
| Quick chart | 🟢 | 🟢 | |
| Other chart types | 🟢 | 🟠 | Other chart types will be implemented later |
| Search | |||
| Keyword search | 🟢 | 🟢 | |
| Quick filters | 🟠 | 🟢 | On par with Macrobond Application
|
| Include discontinued series in Search | 🟠 | 🟢 | 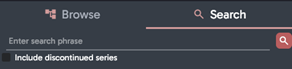 |
| Locate series in every tree structures | 🟠 | 🟢 | So far, users could only move from Search to one tree structure, now you can opt for Country & Region, Source & Release, or Concept & Category. As of now, this feature can be accessed by right-clicking to access the contextual menu. User also needs to then click on Browse tab. This will change soon.
|
| Documents | |||
| Document browser | 🟢 | 🟠 | This feature will be replaced with a new product |
| Watchlist | |||
| Adding series to watchlist | 🟢 | 🟠 | |
Appendix
Easier customer access to Macrobond via MS Entra and OpenID Connect – Full details
The Macrobond application version 1.31 and later users can use identities defined in Microsoft Entra to log in to the Macrobond application via OpenID Connect (OIDC). Certain configurations need to be completed by both Macrobond and client for this to function correctly.
- The client must define a new “app” in Microsoft Entra as explained here.
- Macrobond must receive some information about the MS Entra App registration and add this to the client configuration.
- The first time users log in after configuration has been completed, they will need to connect their Macrobond account with their MS Entra account. This process is outlined here.
The Macrobond application must be able to communicate with https://apiauth.macrobondfinancial.com, which is a new technical requirement.
Configure an Application in Microsoft Entra
To be able to connect the Macrobond application to Microsoft Entra, you need to create an “App registration” in MS Entra and provide the Macrobond support team with some pieces of information about the registration:
- Application (client) ID
- Authority URL
- (optionally a “scope”)
Below is a step-by-step guide on how to create an application in MS Entra. There is also some material from Microsoft covering the same topic here: How to register an app in Microsoft Entra ID - Microsoft identity platform | Microsoft Learn
Open the Entra admin center
Go to https://entra.microsoft.com/ and log in as a user with access rights to create application registrations.
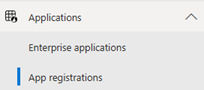
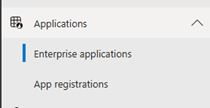
Go to the App registrations section
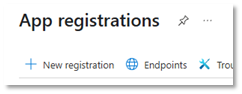
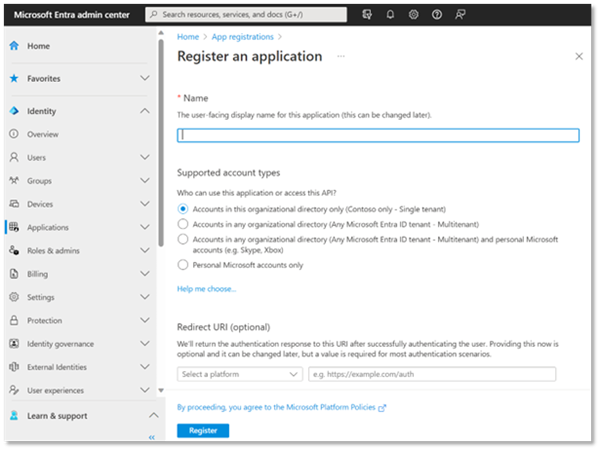
Create new registration
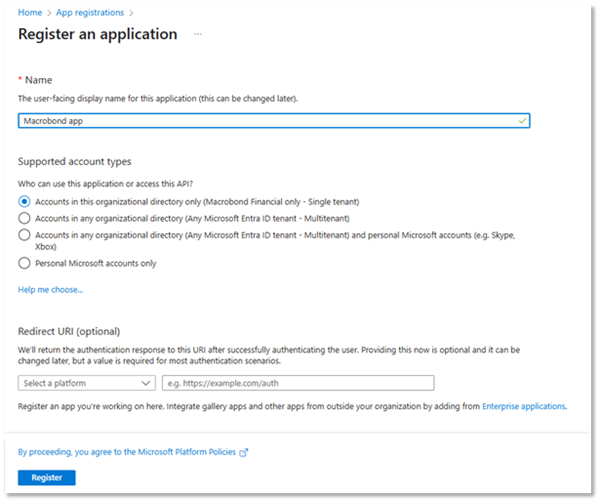
Select “+ New registration”
On the registration form, give the application registration a name, select the supported account type. Do not fill in any Redirect URI yet; it will be done in the next step. Press Register to create the registration.
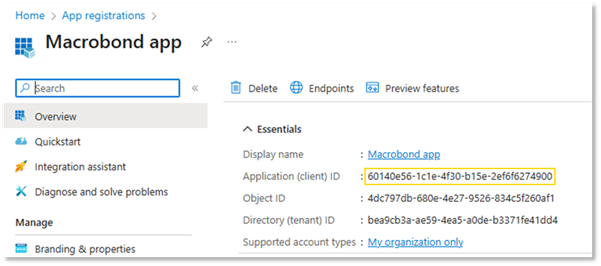
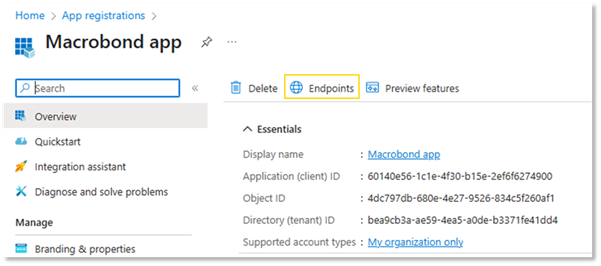
Capture the “Application (client) ID”
Go to the “Overview” page for the application registration and make a note of the “Application (client) ID”. This is one piece of the information you should send to Macrobond the Macrobond support team, and it will also be needed in one of the following steps.
Add a platform
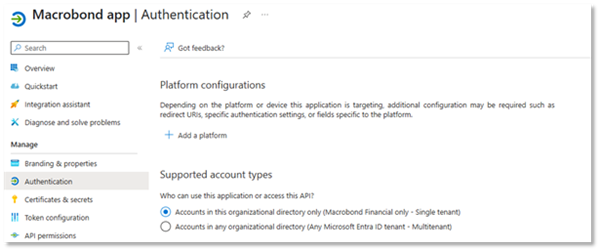
In the settings for the newly registered application, select the section “Authentication” and then “+Add a platform”.
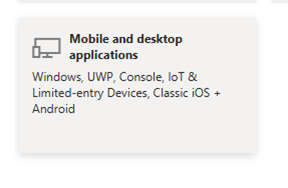
From the list of platforms, select “Mobile and desktop applications”
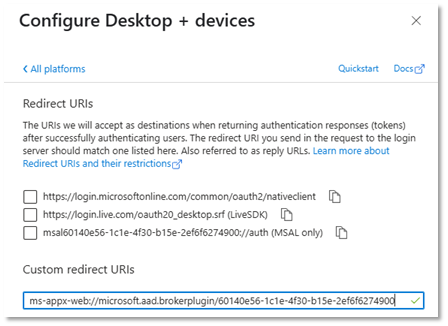
Add a redirect URI
In the platform settings, add a custom redirect URI. The URI should be “ms-appx-web://microsoft.aad.brokerplugin/” followed by the “Application (client) ID” that you can find on the app registration Overview page.
Based on the sample application ID, the redirect URI would be configured as a “Custom redirect URI” like this:
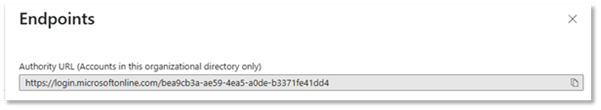
Copy the “Authority URL”
Click on Endpoints to show a list of endpoints.
From the list copy Authority URL:
Send the “Application (client) ID” and the “Authority URL” to Macrobond the Macrobond support team who will configure the service.
The application registration is now done, but you might want to do additional configuration.
Additional configuration
You probably want to assign the new app to Entra users in the “Enterprise applications” section:
Optional: configure an API in Microsoft Entra
If you plan to use OAuth authentication when you connect to your own data sources in the Macrobond application via the Web API Series Provider, you need to also register an API and associate it with the Entra Application defined in the previous section.
Below are the steps you can take to take to register an API, but there is also good description from Microsoft here: How to configure an application to expose a web API - Microsoft identity platform | Microsoft Learn
Use roles…
Create the API registration
An API registration starts with registering an application. No Redirect URI should be specified.
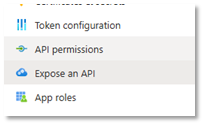
Expose and API and connect to the Entra Application
Specify the “Application ID URI”. This typically looks like a URL, but it is used only as a way to create a unique identifier. It will typically include your domain name, since this is already unique to you, plus something that identifies your Web API Provider servers. You might already have a pattern for creating such application/API IDs.
Next you need to add a “scope”. You can use scopes for access controls, but it might be easier to have just one scope that represents the service and then use the group membership for this purpose.
Finally, add the client application. Use the “Application (client) ID” from the app registration you made earlier in this guide.
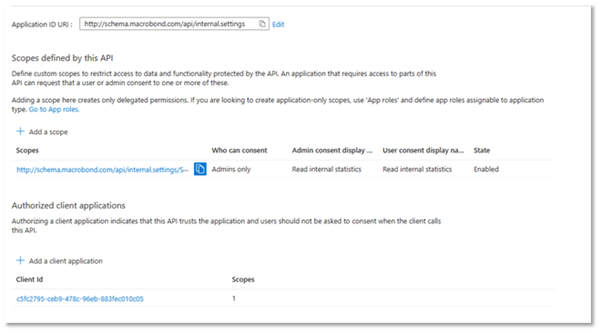
Copy the full scope identifier and send this to Macrobond the Macrobond support team whothat will add it to the configuration.
In the screenshot example above this would be “http://schema.macrobond.com/api/internal.settings/Statistics.Read” but for you, it should be something based on your domain and scope.
Optional token configuration
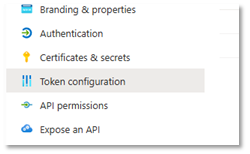
Depending on how you want to do authorization in your Web API Series Provider service, you might want to include additional information in the security token passed on to the API server. Such configurations are done in the “Token configuration” section of the API registration.
For instance, it is common that you want to include the “aud” claim in the JWT. This will add the “Application (client) ID” value to the “aud” claim in the tokens.
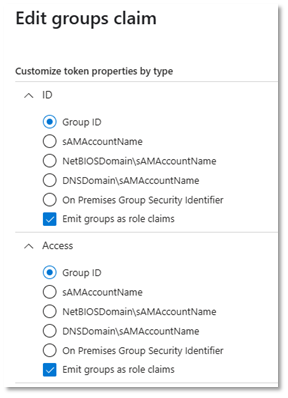
Another claim you might want to add is “groups”.
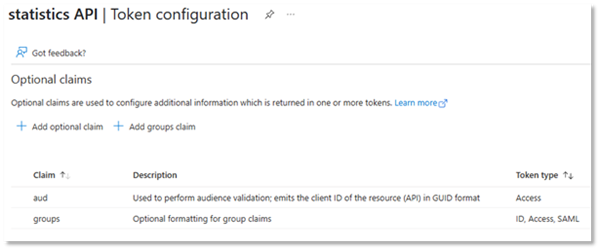
The “groups” claim will include a list of security groups that the user is a member of in the token. (There are some caveats here if the list is too long. The Microsoft documentation should explain the options here.)
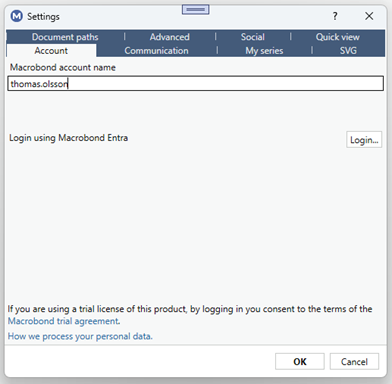
User experience in the Macrobond application
The user will have a Macrobond account username and a MS Entra username. These are often the same name in the form of an e-mail address, but they might be different.
When you enter your Macrobond username in the Macrobond application, the application will detect that this user is configured to use MS Entra and will show a “Login” button.
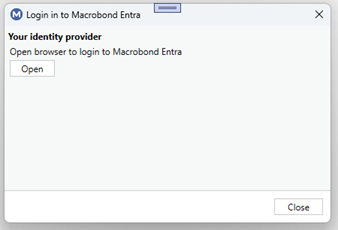
You will be asked to log in to MS Entra in your web browser.
Once logged in to MS Entra and your accounts are already connected, you are good to go.
If your accounts are not connected, you will be prompted for your Macrobond account password. It might be filled in already if you have logged in on this computer before your account was configured to use MS Entra.
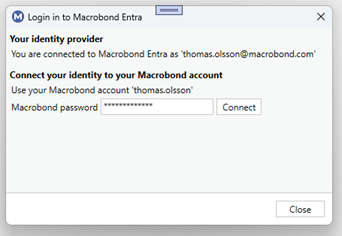
If your password matches when you press “Connect”, you will get a confirmation.
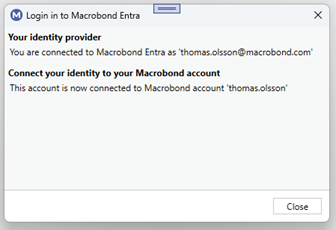
Press “Close” and then “OK” to start using the application.
The Macrobond account and the MS Entra account are now connected. In the rare event that you want to disassociate a Macrobond account from an account in MS Entra, please contact the Macrobond support team.
Depending on the configuration of MS Entra, the session might expire, and a new interactive login is required.
In this case, you might see a message like this in the application:
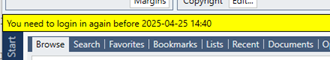
This means that the application has detected that the token cannot be renewed without user interaction, but we still have a cached valid token a while longer. Pressing the yellow bar will open the Settings dialog and it will look like this:
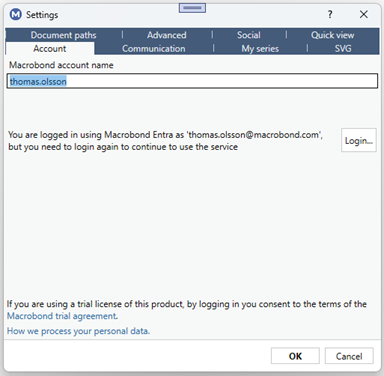
The COM API (MATHLAB, Python etc.) and EViews add-in do not support interactive login, so you might want to keep the Macrobond application running if you are using those services. This is also true when you update charts in Microsoft Office documents.
Configuring a Web API Series Provider to use OAuth
There is a new setting in the configuration file for WebAPI Series Providers called “UseOAuth” that will make the application include the access token from MS Entra in the request as the http header “Authorization: Bearer”.
<?xml version="1.0" encoding="utf-8"?>
<web:WebApiSeriesProvider xmlns:web="http://schemas.mbnd.eu/2019/webapiseriesprovider">
<web:Host>http://myseriesapiserver.com</web:Host>
<web:UseOAuth>true</web:UseOAuth>
</web:WebApiSeriesProvider>