Manipulate and present data using a range of analyses from the most fundamental to the advanced
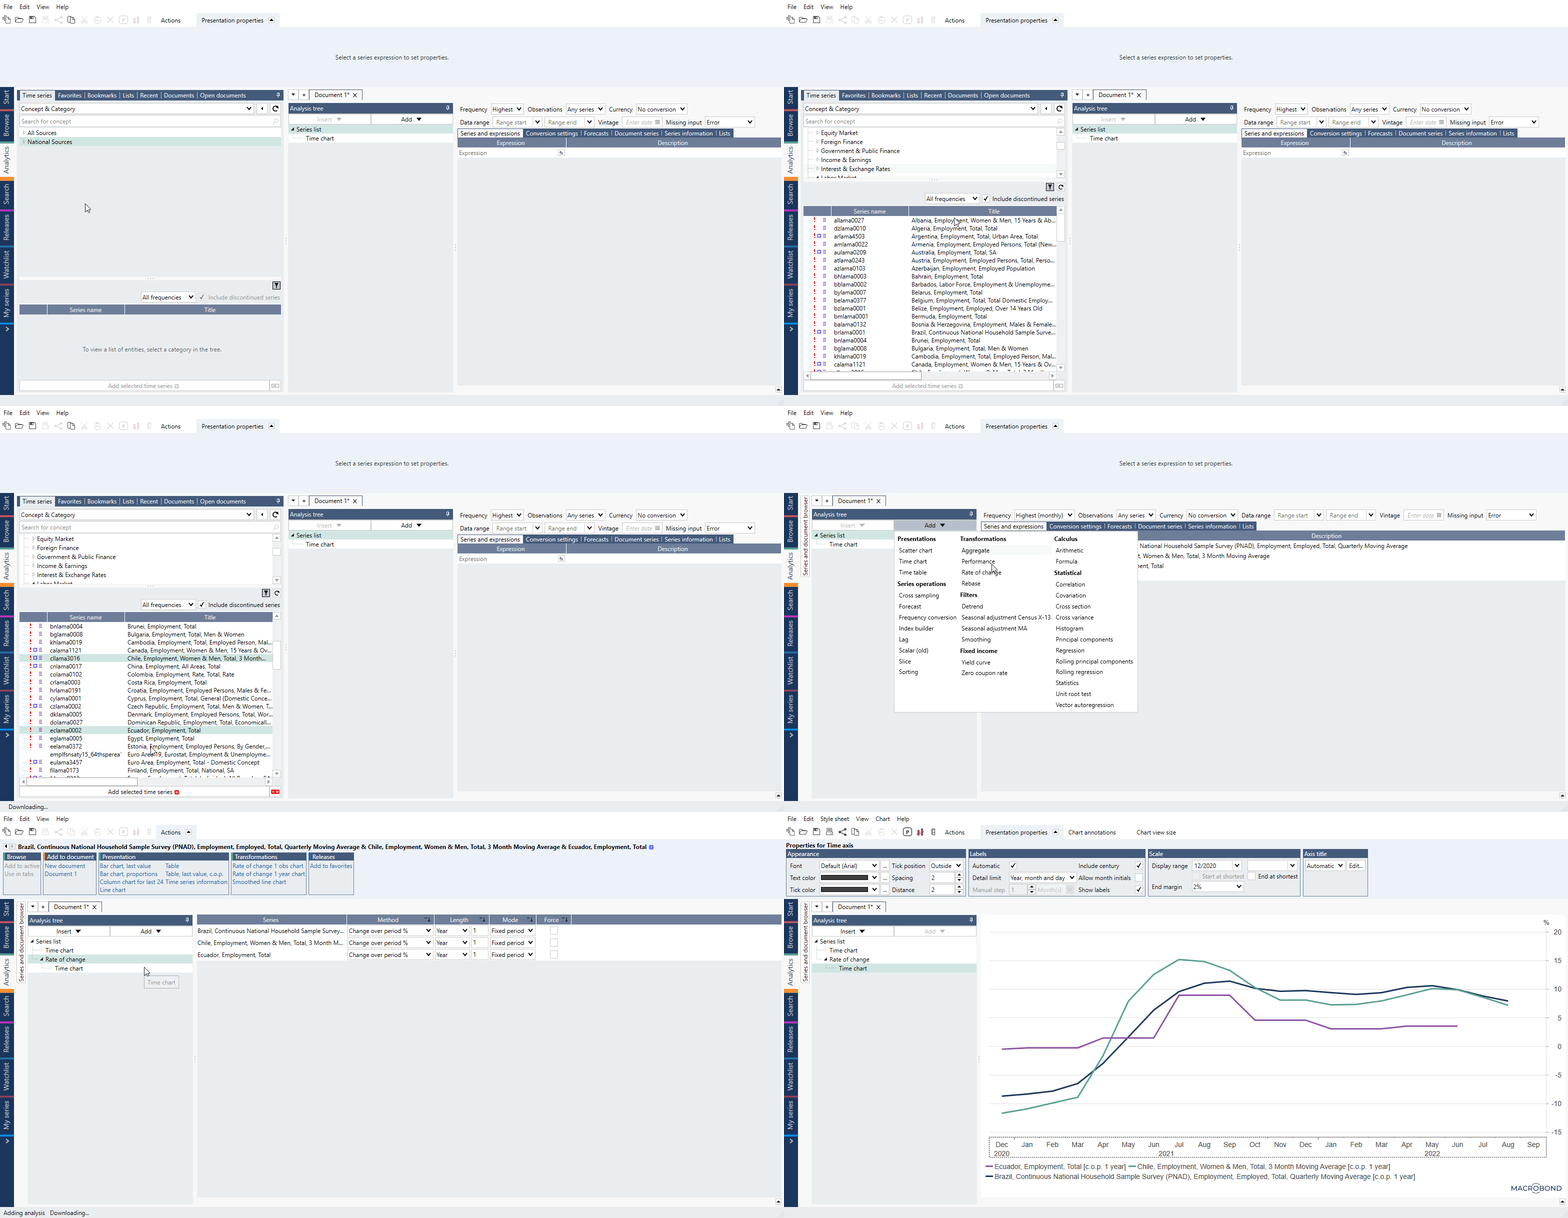
With a workflow from left to right, Analytics is composed of three main elements:
The series and document browser
- Select data to work with from any of the data sets in the application
- Use the filtering and sorting options available to simplify your selection
- Select documents to work with
- Search through databases
The analysis tree
- Organize and view the calculations and presentations applied to the data in the document
- Access the list of data that has been added to the document (Series list)
- Apply one or a sequence of calculations to the data in the series list, seen below
The Presentation pane
- Define and adjust how the manipulated data is displayed using the tools in the command bar
Working in Analytics
Watch below presentation for a hands-on example of:
- Finding and adding data
- Applying a simple analysis
For more information see: Analyzing data.
