Skip to content

Macrobond Help

  • Platform Overview
    • Macrobond Analysis
    • Macrobond Amplify
      • Creating an Asset
      • Viewing an Asset
      • Managing your team
    • AI Data Feed
    • Macrobond Viewer
  • Product Updates
    • Release notes & Product versions
      • Macrobond Analysis
      • Macrobond Amplify
      • Macrobond AI Data Feed
    • Data announcements
  • User Guides
    • MB Analysis user guides
      • MB Analysis overview
      • Q&A
      • Technical Q&A
      • Finding data
      • Analyzing data
      • Charting
      • Publishing & saving
      • Transfer Content
      • Test your skills
    • MB Amplify user guides
      • Q&A
      • Producing charts
      • Publishing charts and managing MB Drive
      • Viewing Assets
      • Managing users – invitations
      • Managing users – Access Lists
    • AI Data Feed user guides
      • Installation
      • User guide
    • Commonly used metadata
  • APIs/Feeds/Connectors
  • Technical Information
    • Installation guides
    • Password reset
    • Versions expiration
    • Data security
  • Legal
  • Support

How to synchronize values of two y-axis?

Click on the y-axis and go to the Presentation properties tab. In the Axis panel, set 'Synchronize' to 'Values'.
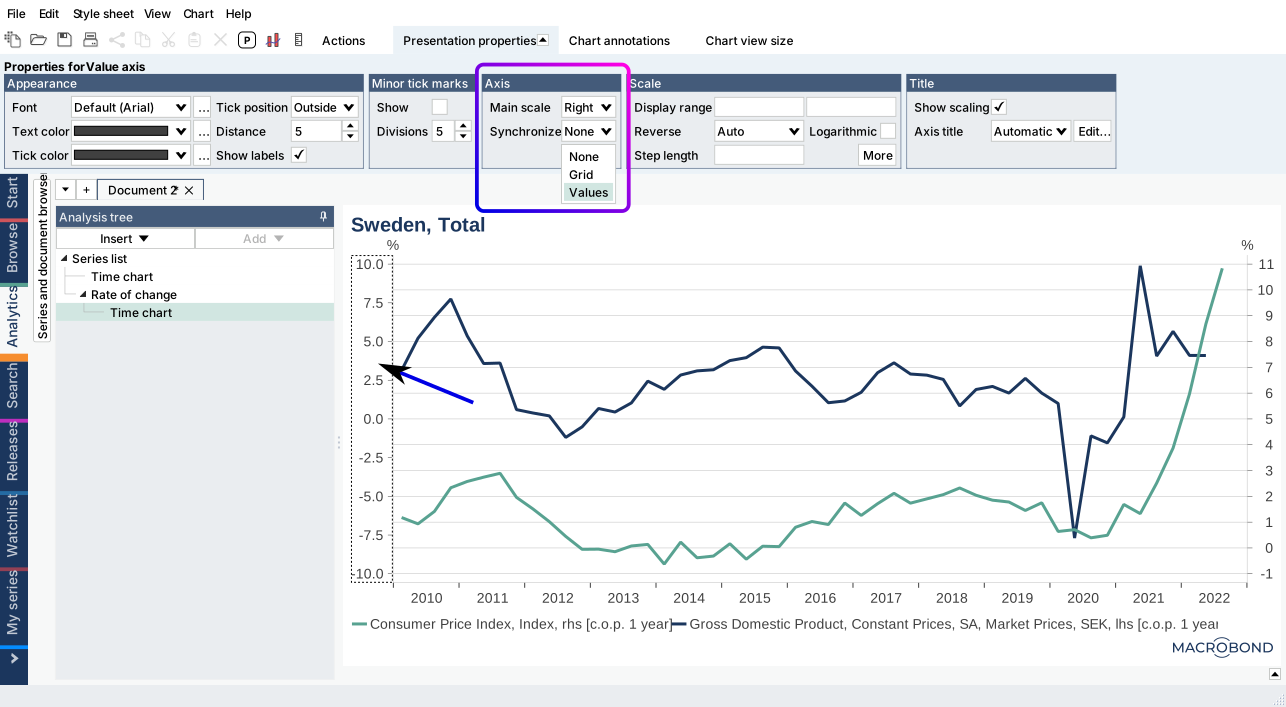
To display two y-axes with different values, please see: How to display multiple y-axes?

For more information:

Elements of the chart

Tags: axisy-axis

Contents

  • MB Analysis user guides
    • MB Analysis overview
    • Q&A
      • Macrobond Analysis functions
      • Chart’s graphics & elements
        • How to narrow the range on the axis?
        • How to change the colors in the chart/template?
        • How to change the default font used in the text elements of my chart?
        • How to change the language of the automatic text in my chart?
        • How to change how time range is displayed on the x-axis?
        • How to display multiple y-axes?
        • How to synchronize values of two y-axis?
        • How to edit / remove the axis text: lhs and rhs?
        • How to hide analysis texts like, c.o.p 12 months?
        • How to reverse / invert the y-axis?
      • Calculations
      • Formula language
    • Technical Q&A
    • Finding data
    • Analyzing data
    • Charting
    • Publishing & saving
    • Transfer Content
    • Test your skills
  • MB Amplify user guides
  • AI Data Feed user guides

Related material

  • How to narrow the range on the axis? 2 tags related FAQ
  • How to display multiple y-axes? 2 tags related FAQ
  • Axis & Scale 1 tag related Chart elements Charting
  • Labels 1 tag related Chart elements Charting
  • How to edit / remove the axis text: lhs and rhs? 1 tag related FAQ
  • How to change how time range is displayed on the x-axis? 1 tag related FAQ
  • How to reverse / invert the y-axis? 1 tag related FAQ
  • Platform Overview
    • Macrobond Analysis
    • Macrobond Amplify
      • Creating an Asset
      • Viewing an Asset
      • Managing your team
    • AI Data Feed
    • Macrobond Viewer
  • Product Updates
    • Release notes & Product versions
      • Macrobond Analysis
      • Macrobond Amplify
      • Macrobond AI Data Feed
    • Data announcements
  • User Guides
    • MB Analysis user guides
      • MB Analysis overview
      • Q&A
      • Technical Q&A
      • Finding data
      • Analyzing data
      • Charting
      • Publishing & saving
      • Transfer Content
      • Test your skills
    • MB Amplify user guides
      • Q&A
      • Producing charts
      • Publishing charts and managing MB Drive
      • Viewing Assets
      • Managing users – invitations
      • Managing users – Access Lists
    • AI Data Feed user guides
      • Installation
      • User guide
    • Commonly used metadata
  • APIs/Feeds/Connectors
  • Technical Information
    • Installation guides
    • Password reset
    • Versions expiration
    • Data security
  • Legal
  • Support
Macrobond Help Cookie policy © Macrobond | All rights reserved