Using annotations will help you direct attention to the most important aspects of a chart, helping the reader to clearly identify what is relevant.
See here pre-1.31 version view
Under the chart annotations tab, you’ll find:
- Inks – a free-hand option for highlighting portions of your chart
- Chart ornaments – defined shapes or text boxes you can place anywhere in the graph area
- Annotations – labels and lines that can be added to a particular value on the x and/or y axes
Inks don’t need much explanation, so we’ll focus on going through a quick description of chart ornaments and annotations.
Chart Ornaments
Ornaments are added independently of any value in a chart and moved freely
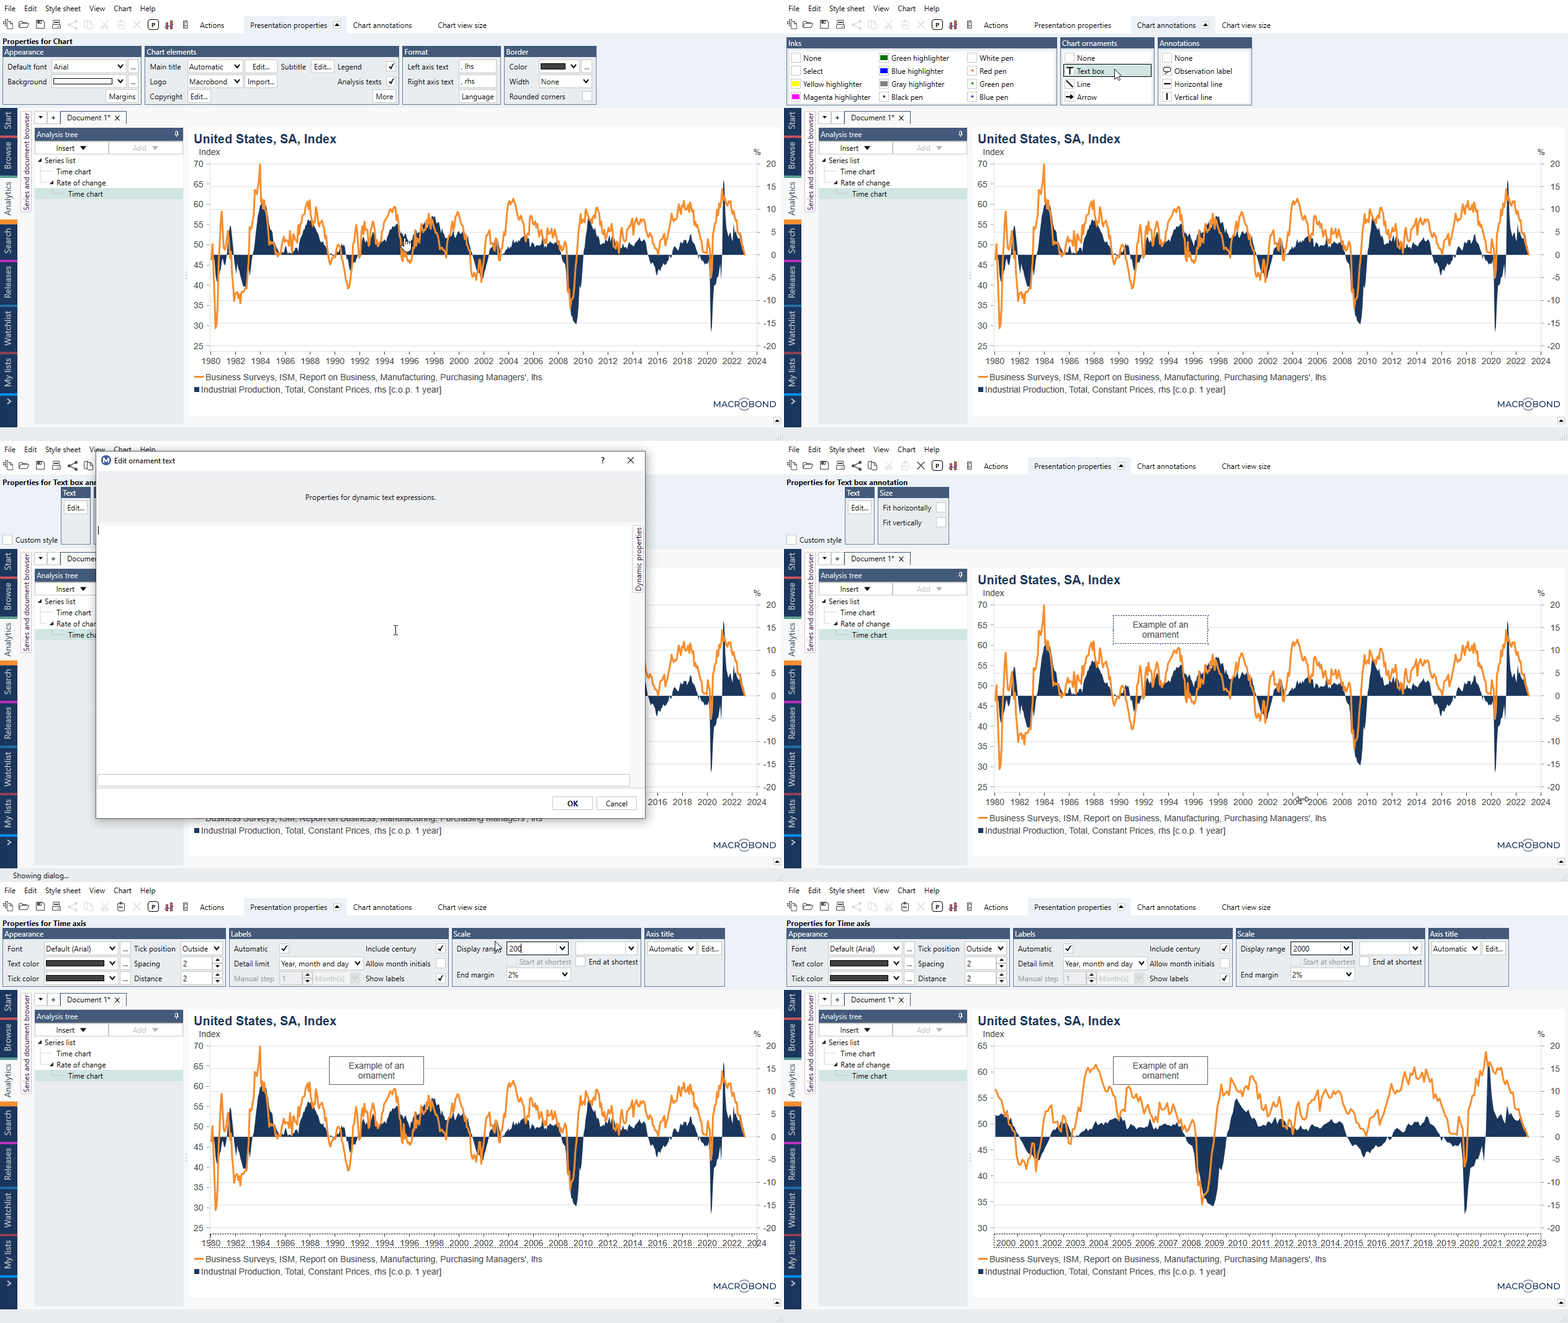
- as a text box - where you can add text by double-clicking on it
- as a line (+curved version)
- as an arrow (+curved version)
- as a circle
The size and position of an ornament can be adjusted manually, by clicking and dragging. Use the Custom style option if you want to change the appearance of the ornament.
How to add ornaments?
- Select the ornament type from the command bar
- Draw-out the ornament in the graph area, to a suitable size
- Move it to an appropriate position if necessary
Example: If you shorten the date range of the x axis, resulting in a closer view of the graph lines, the text box will not move to accommodate the change.

When to use ornaments?
- When you want to add a general note
- When you want to highlight something that is not related to a single value in the chart
Annotations
Annotations are added relative to particular values in a chart:
- as a vertical line, associated with a value on the x axis
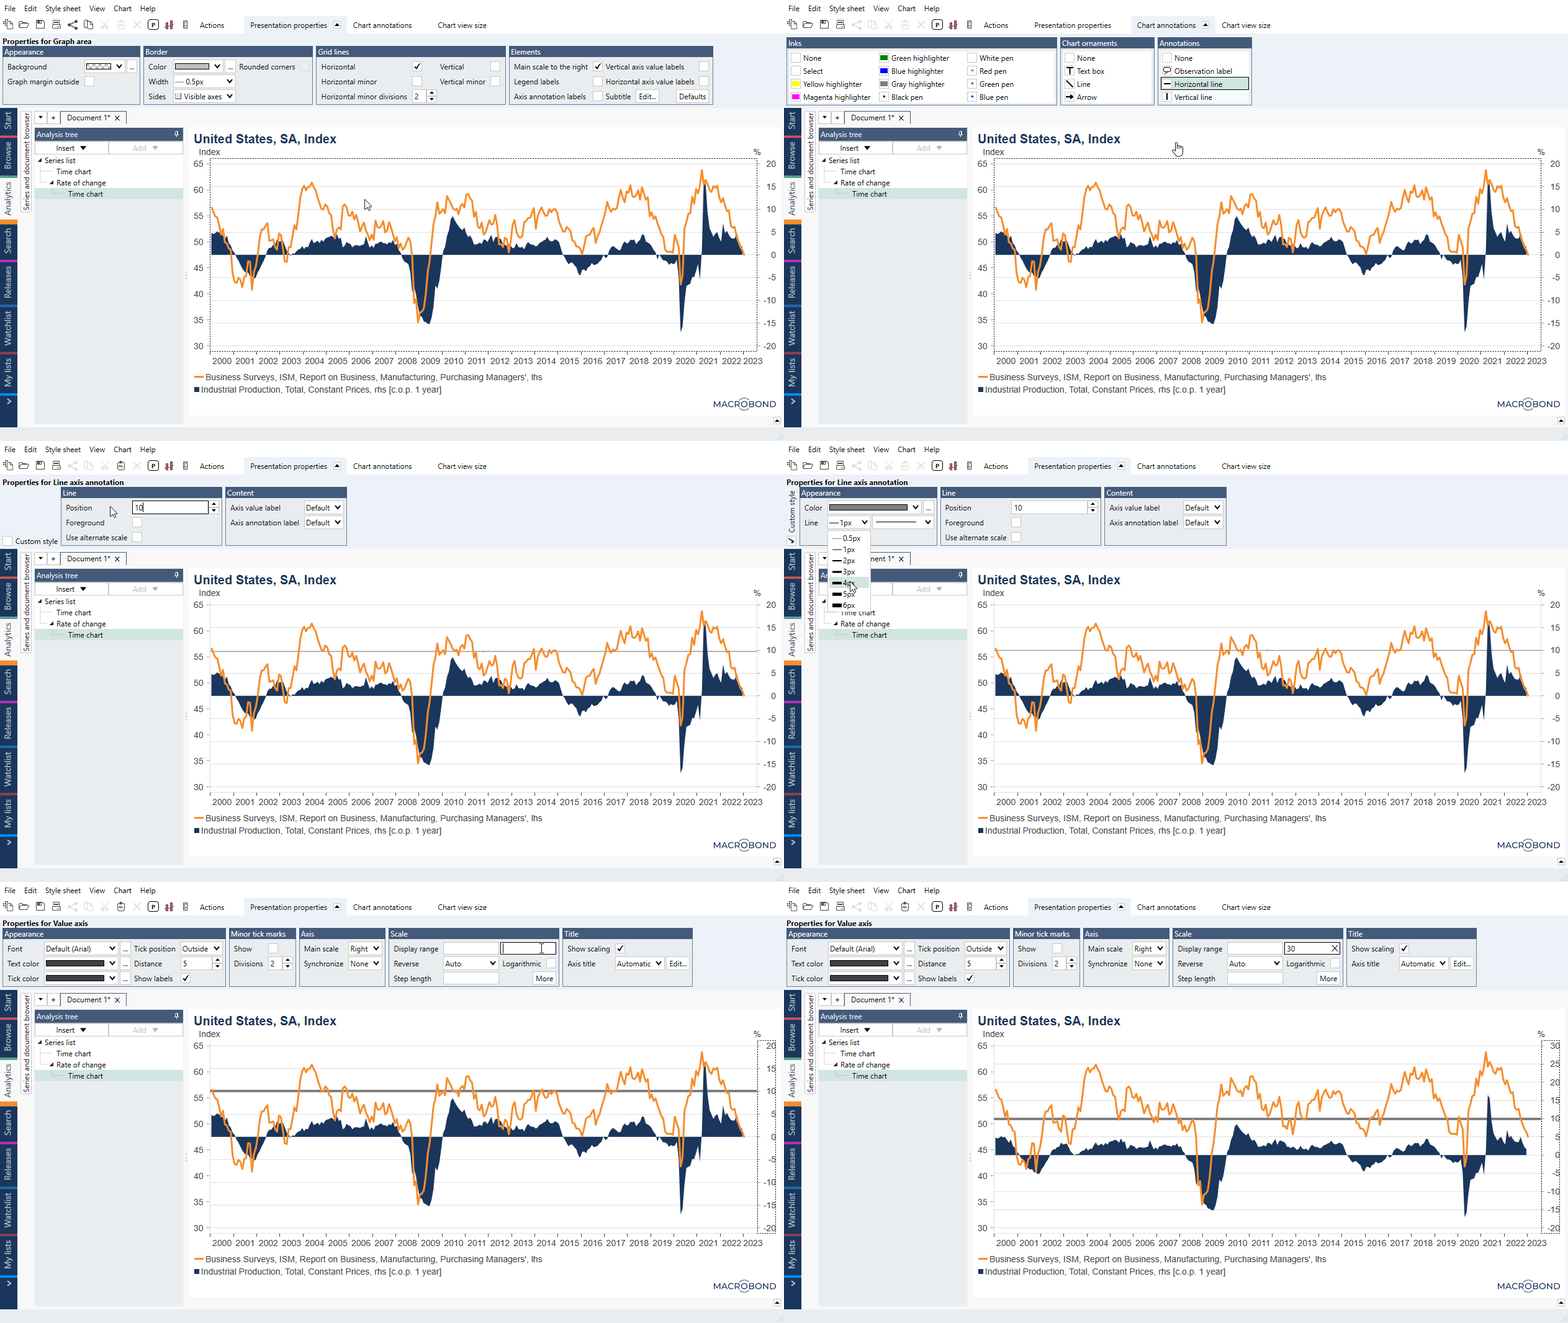
- as a horizontal line, associated with a value on the y axis
- as an observation, associated with a value coordinate, on both the x and y axes
How to add annotations?
- Select the annotation type from the command bar
- Click on a relevant position in the graph area, to add the annotation
Example: If you changed the scale of the y axis in the image below, the horizontal line would move with its reference value.

When to use annotations?
- When you want to specify which values to add annotations to.
- If you plan to update the data in a chart or adjust to the x or y axes, using annotations will ensure that the annotations you add remain in the correct position.