Pre-requisites
Please ensure you have first followed the installation guide.
If you are using M365 Copilot, remember to set “Think deeper” mode:

Search & Retrieval
In your AI tool of choice, you can use Macrobond for exploration, discovery, ideation and series search and retrieval.
You will be returned a table where you can select the relevant series that you would like to retrieve. Searching for series does not count towards your UTS usage.
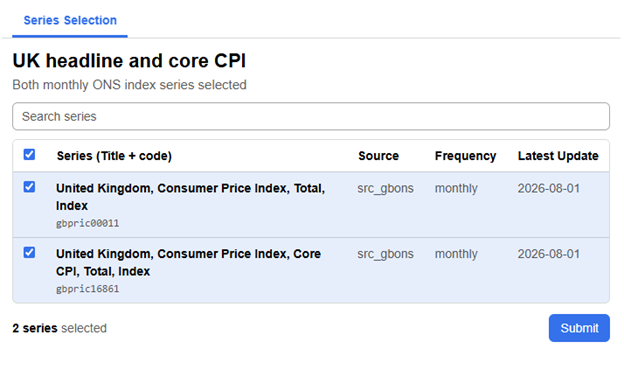
When you know which series you want to retrieve, click Submit – you will be asked to confirm – this is so that retrieval of series is always in your control, allowing you to better manage your UTS consumption.
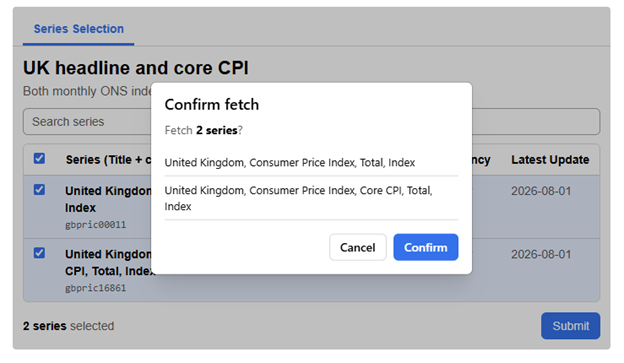
Click confirm to retrieve the series you want.
Remember that for AI Data Feed, if you have fetched a specific series once, you can fetch it as many times as you need to (within the contract term) and it still only counts as one UTS usage.
The data will automatically be displayed in a chart and table format, please see the next section for more details.
Note, there will be a separate tab to see the data returned either as a chart or as a table. Macrobond currently supports vizualising time series as a line chart. Depending on your AI model, you may be able to provide further prompts to display the data in other ways.
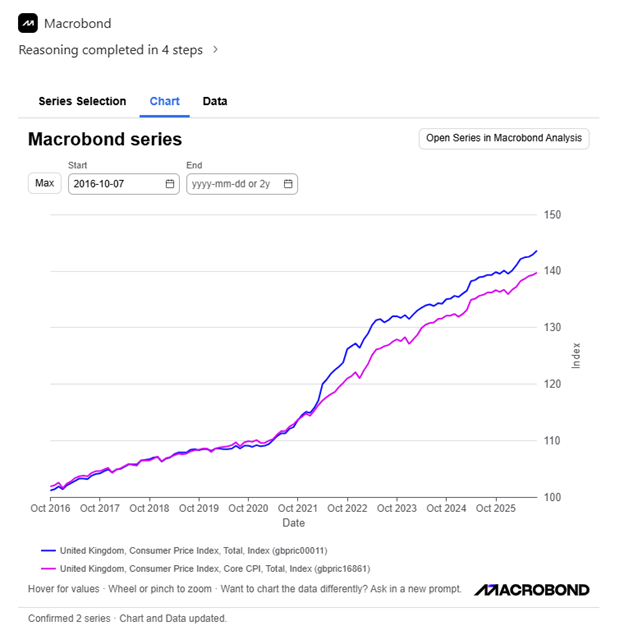
Table & Chart Vizualisation
Macrobond currently supports vizualising time series on a line chart. Depending on your AI model, you may be able to provide additional prompts to display the returned data in different ways.
You can hover over the series chart to see the values:
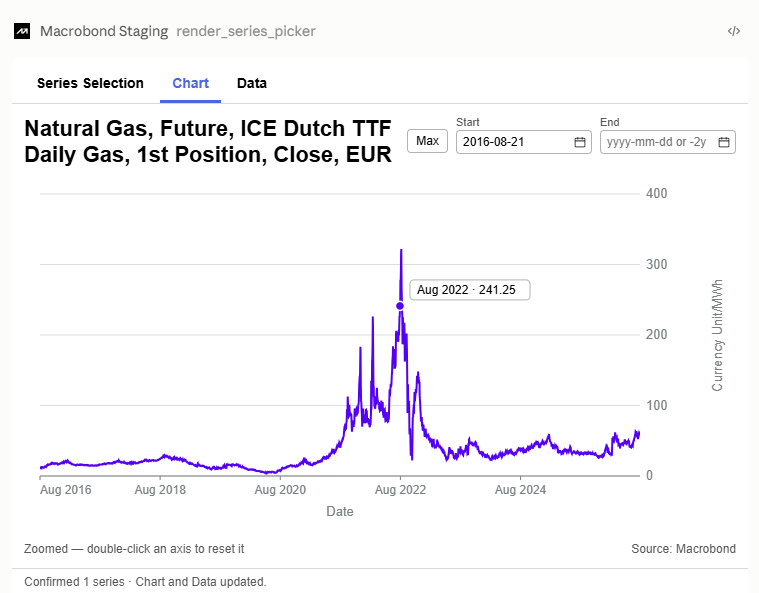
You can use the date picker to set the time range:
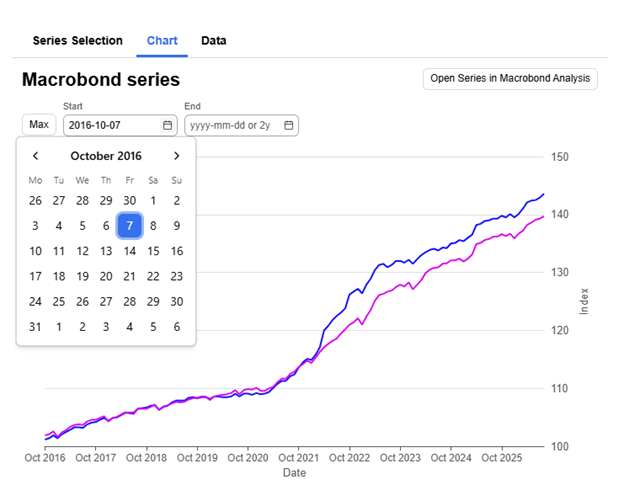
Hover over the date picker to see other ways to set the range, e.g. you can type “-2y” into the start date:
Note: this will set the range back from the latest available data point (which may not be “today”).
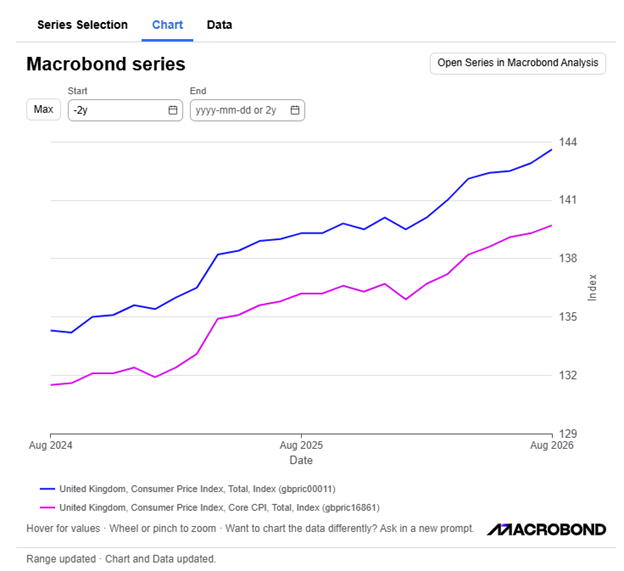
Or you can wheel or pinch to zoom in, drag to pan and double click on the chart to reset.
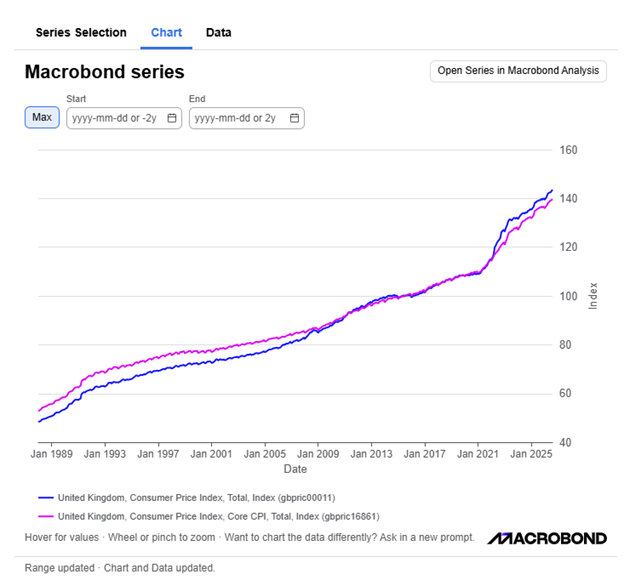
If you want to see the full history, type ‘all’ in the start date:
If you prefer to explore the data in a table, simply select the Data tab and the format will show as below:
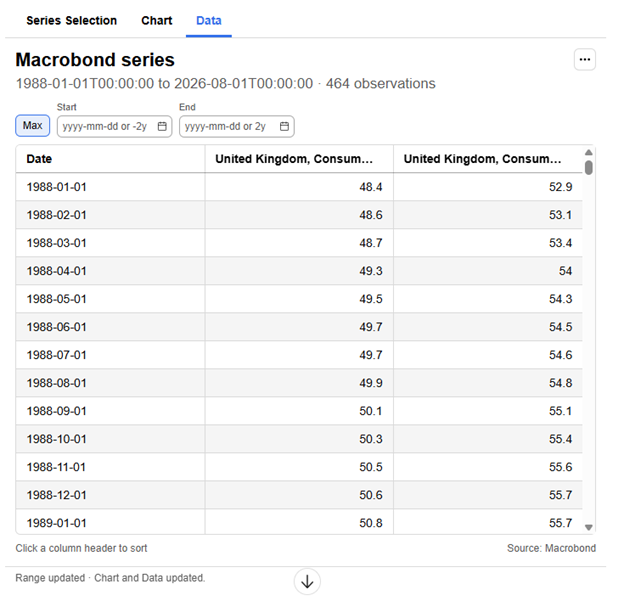
You can deselect columns by clicking the ellipses:
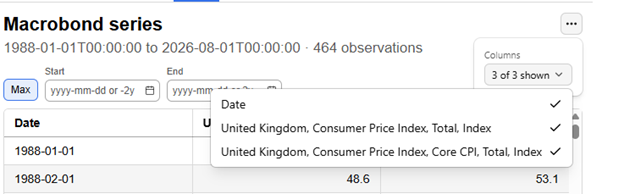
The date pickers work the same as the charts.
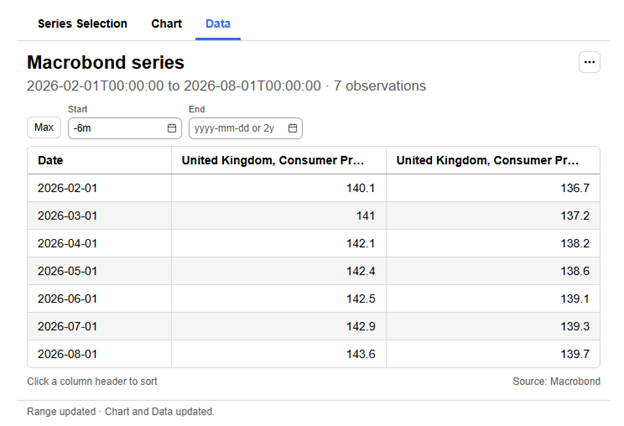
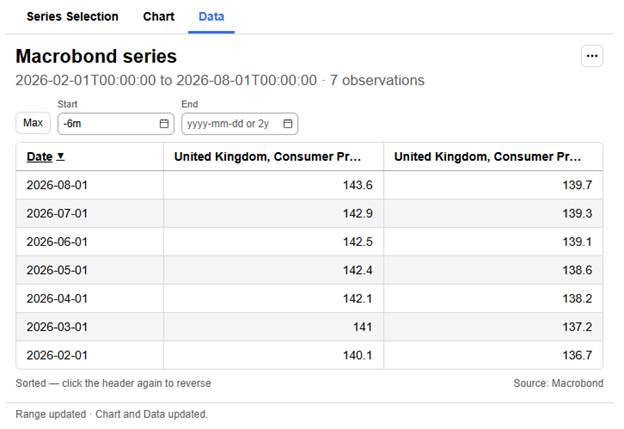
You can sort by clicking on the column header:
Integrated Workflow
Pre-requisite: access to Macrobond Analysis desktop application.
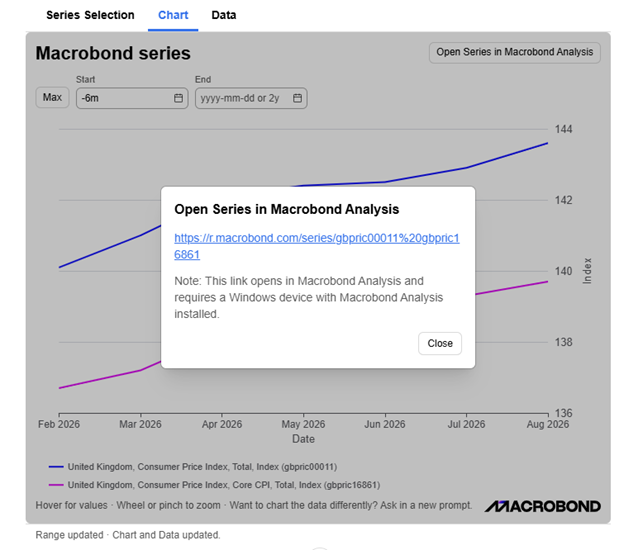
After using the MCP for ideation, data discovery or exploration, when you have found the series that you need, you can click the “Open Series in Macrobond Analysis” button to create a series preview in the application.
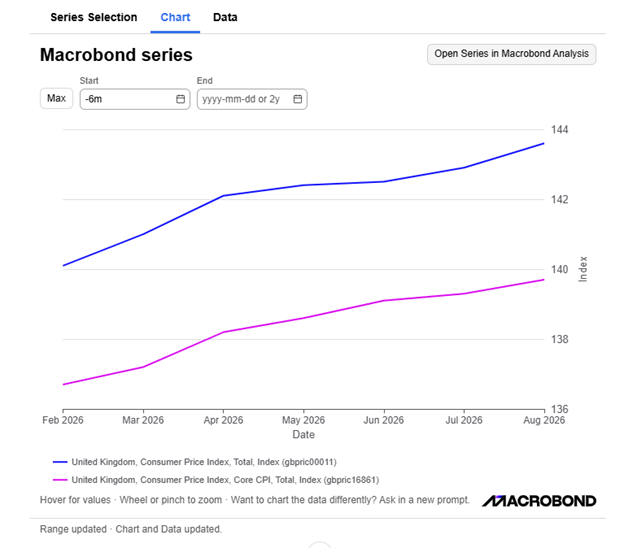
Click the button and you see a pop up:
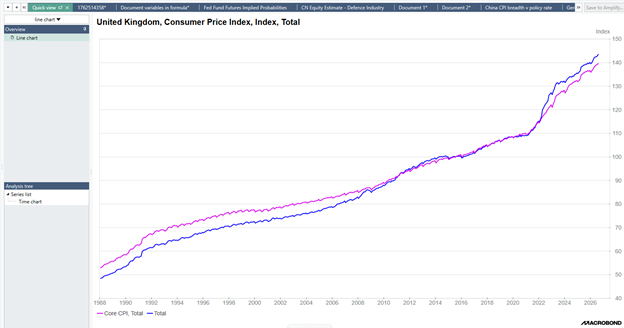
Click the link and your Analysis application will open a Quick view:
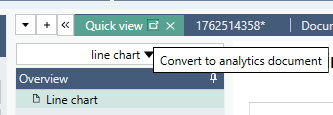
You can click the icon after “Quick view”, to the left of the ‘X’, to create an MBDoc with the selected series:
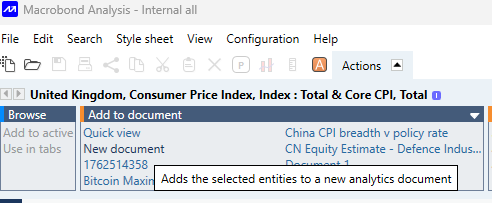
Or under the Actions tab at the top of the screen, you can click “New document” to create an MBDoc with the selected series:
Now you can carry on your workflow to transform and analyze the data and create your preferred visualization in your style sheet.
See Analysis documentation for more information; MB Analysis overview – Macrobond Help.