Overview
Conditional formatting is used to set colors and text properties based on the values defined by a set of rules. This can be used to create Heatmaps, show negative values, highlight largest smallest value and outliers.
Adding Rules
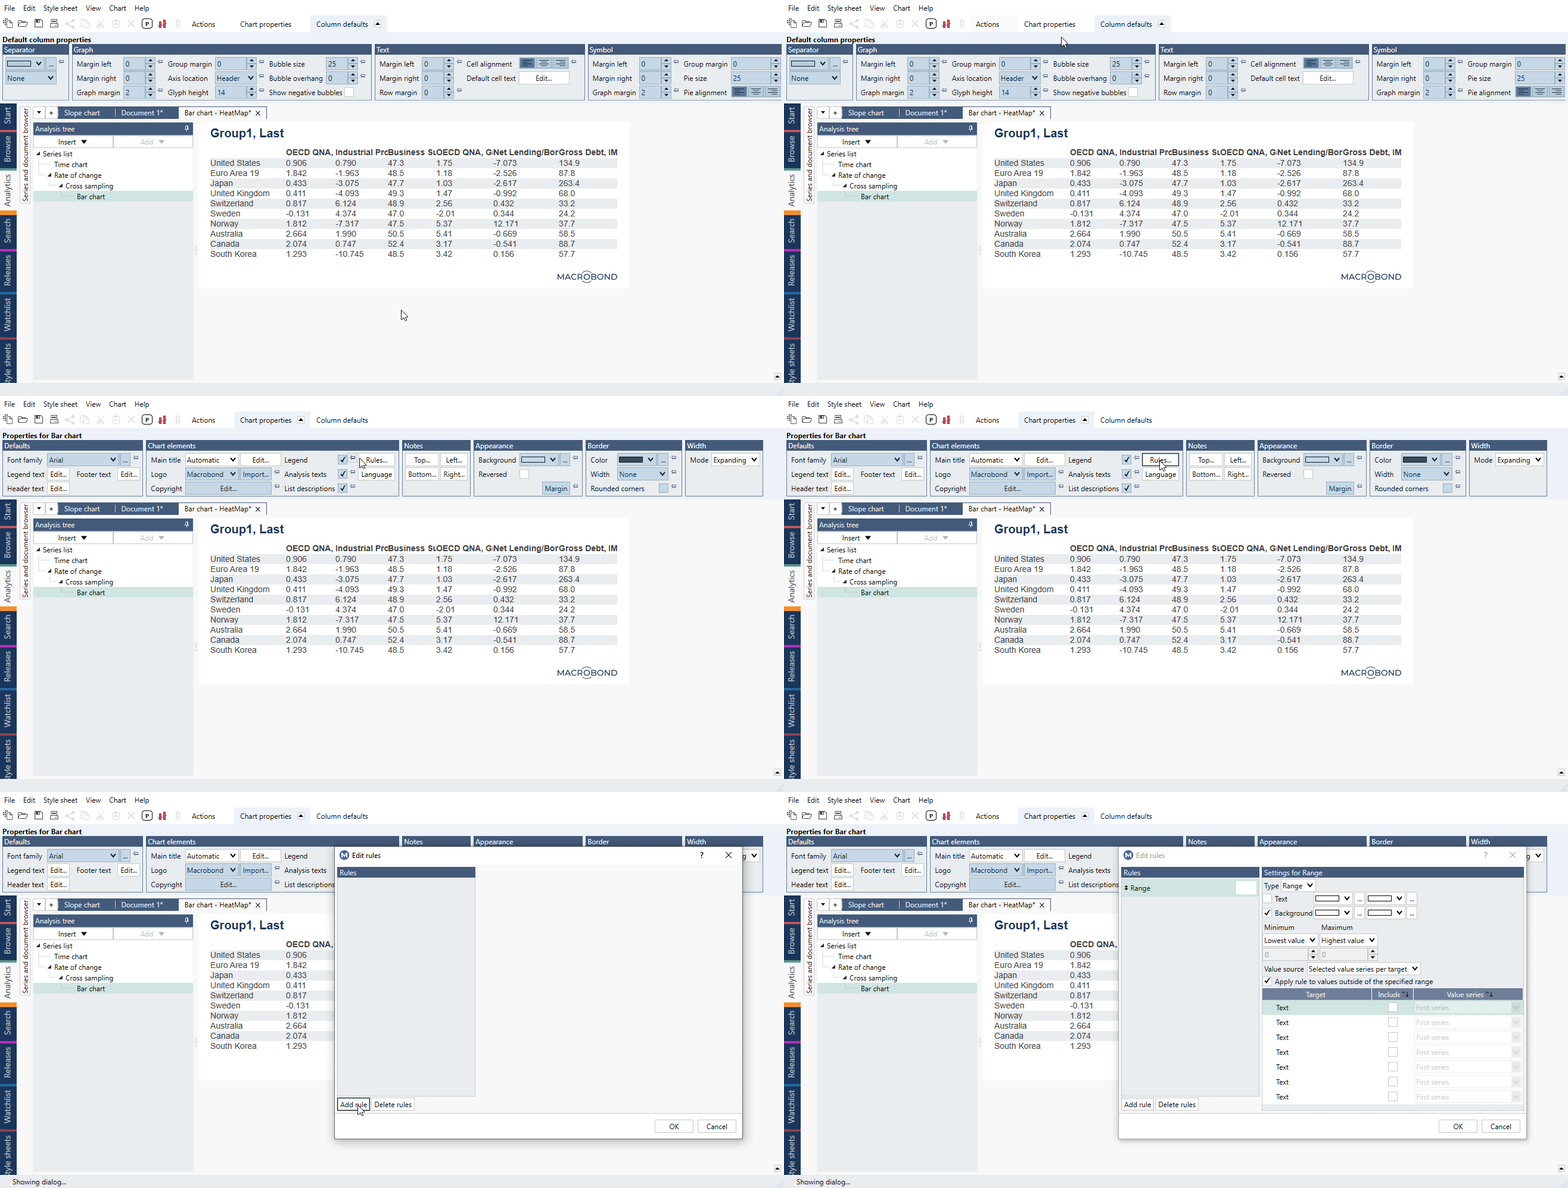
You set up rules in the dialog shown when you press the Rules button in the Bar chart settings under Chart properties > Chart elements. In new window simply press 'Add rule' and start the process:

Rules settings
In the Rules dialog you can define a set of rules that will apply color and style settings to graphs, texts and backgrounds. The text settings refer to the foreground of text or graphs. You can see the result of the rules in the chart as you make changes in the dialog.
For each Rule you select what columns to include ('Include' column) and what data to use for each column ('Value series' column). Note it's not possible to apply rules by rows.
- You can have different types of Rules - i.e., for some you can select colors for text and background and for some also the text style.
- The Rules will be applied in the order they appear and a Rule further down the list can change settings made by an earlier Rule.
- The default setting in 'Value series' is 'First series' which means that the color range will be based on that column's value range.
- You can base the Rule on data that is not visible in that column. For example, you may have calculated a YoY series and use it to set the color of the actual value. See example under Using other series for formatting.
Range
The Range rule sets the color on a scale from a starting color to and end color. The values will be mapped to the color range by specifying a minimum and a maximum value.
There are several options for selecting the range of values. The default setting will use the lowest and highest values in the data set, but you can also set a manual value, a percent between the highest and lowest or a percentile between highest and lowest.
If there are several series selected for the targets, you can choose if you want the range to be calculated for each target separately or for the union of all series.
When the value range does not cover all values, which can be the case if you have not used the default setting for the range, you can choose if you want values outside of the range to be unaffected by the rule or if the start/end color will be used for values outside the value range.
Condition
The Condition rule allows you to set the color or text style based on a condition such as Less, Greater and Between. If the condition is met, the color or style will be set.
Rank
The Rank rule applies the selected color or text style to the x highest or lowest values. You can select if the number of values should be expressed as the count or percentage of values.
If there are several series selected for the targets, you can choose if you want the range to be calculated for each target separately or for the union of all series.
Average
The Average rule allows you to set formatting based on if the value is above or below the average value or above or below the average +/- n standard deviations, where n is 1, 2 or 3. This can be used to highlight outliers.
If there are several series selected for the targets, you can choose if you want the range to be calculated for each target separately or for the union of all series.
Example
In this example, we applied conditional formatting rules to the Bar chart table created with Cross sampling analysis with use of lists.