This feature is available in Macrobond 1.30 and later with enhancements in 1.31.
Overview
This feature is available in Macrobond 1.30 and later with enhancements in 1.31.
To enhance reviewing and comparing series we have introduced Quick view in Analytics tab. You can now select ready-made templates combining charts and tables in one screen, via the mouse or through keyboard shortcuts.
Using Quick view
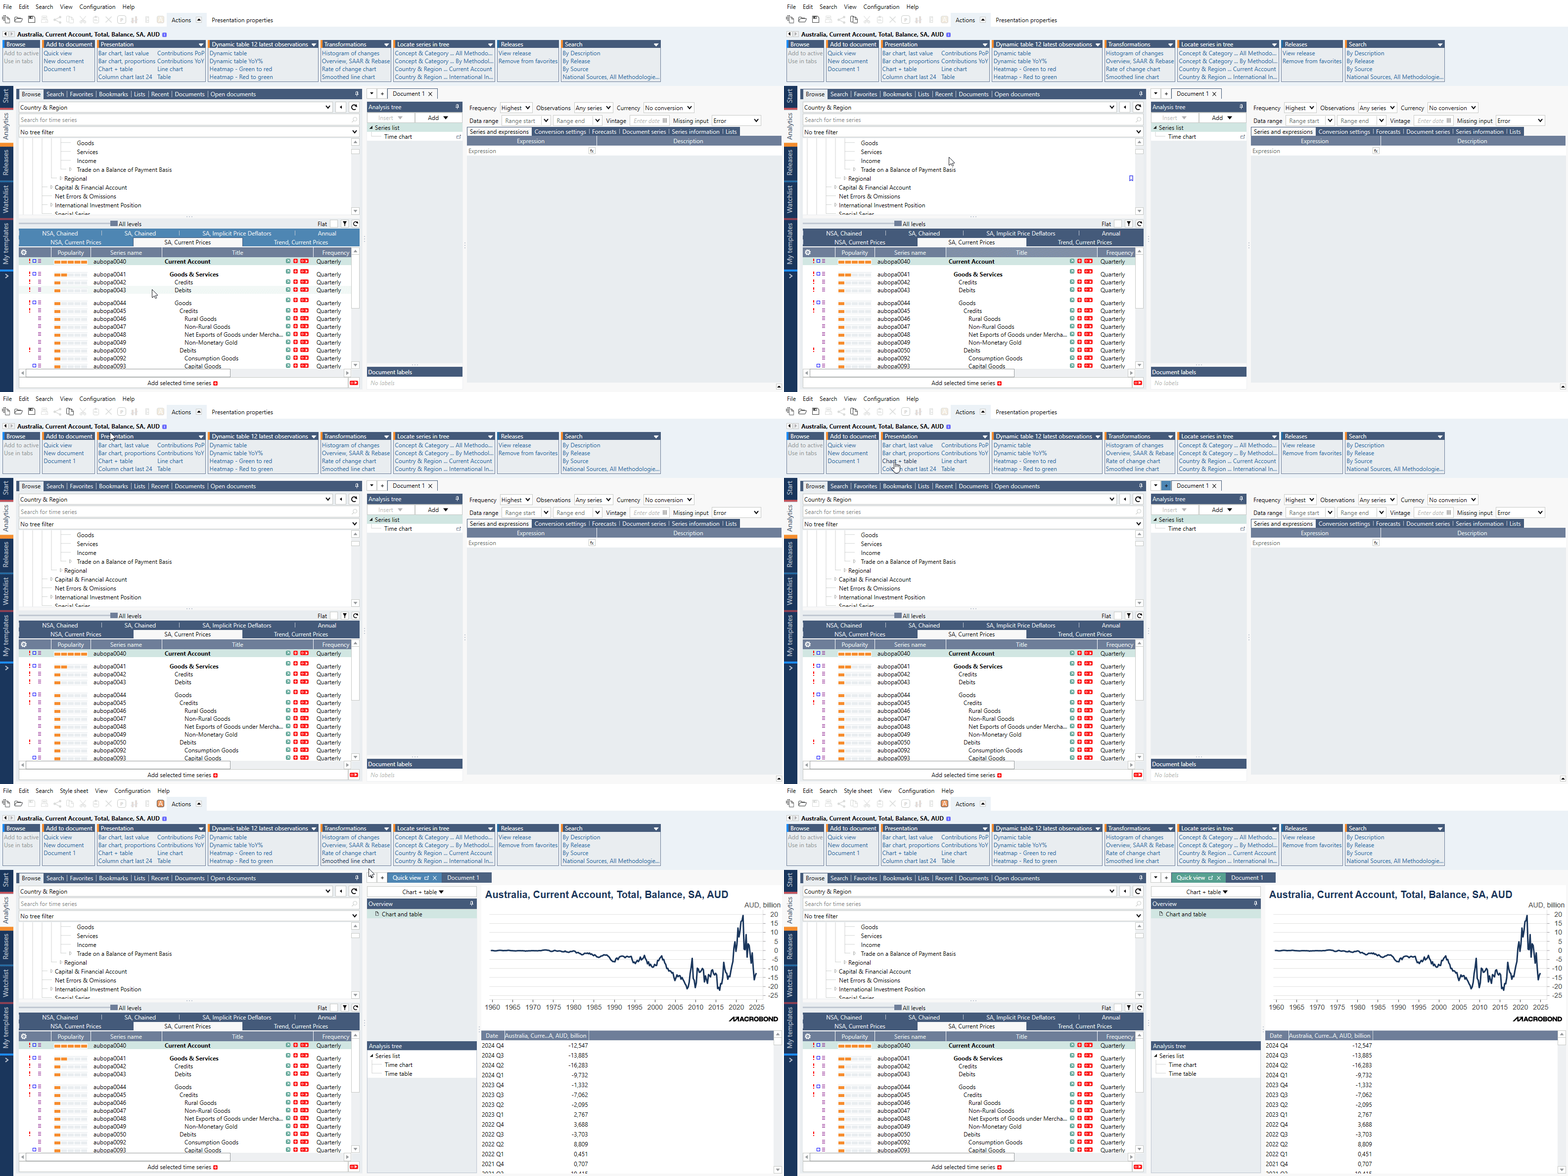
Add Quick view
There are two ways to start a Quick view. Mark series and:
- from Actions ribbon select Add to document > Quick view.
- click on a green arrow icon next to series’ description.
Press Ctrl key and click to add series to existing Quick view. Press Alt key and click to replace last series in existing Quick view.
You can also use one of the pre-prepared views. See below for more information.
Pre-prepared charts and templates
Mark series (one or many). In Actions ribbon there are now three panels – Presentation, Dynamic table 12 latest observations and Transformations. Selecting any of them will activate green-colored Quick view document with pre-defined structure and/or calculations.
Time series information will also appear in Quick view.
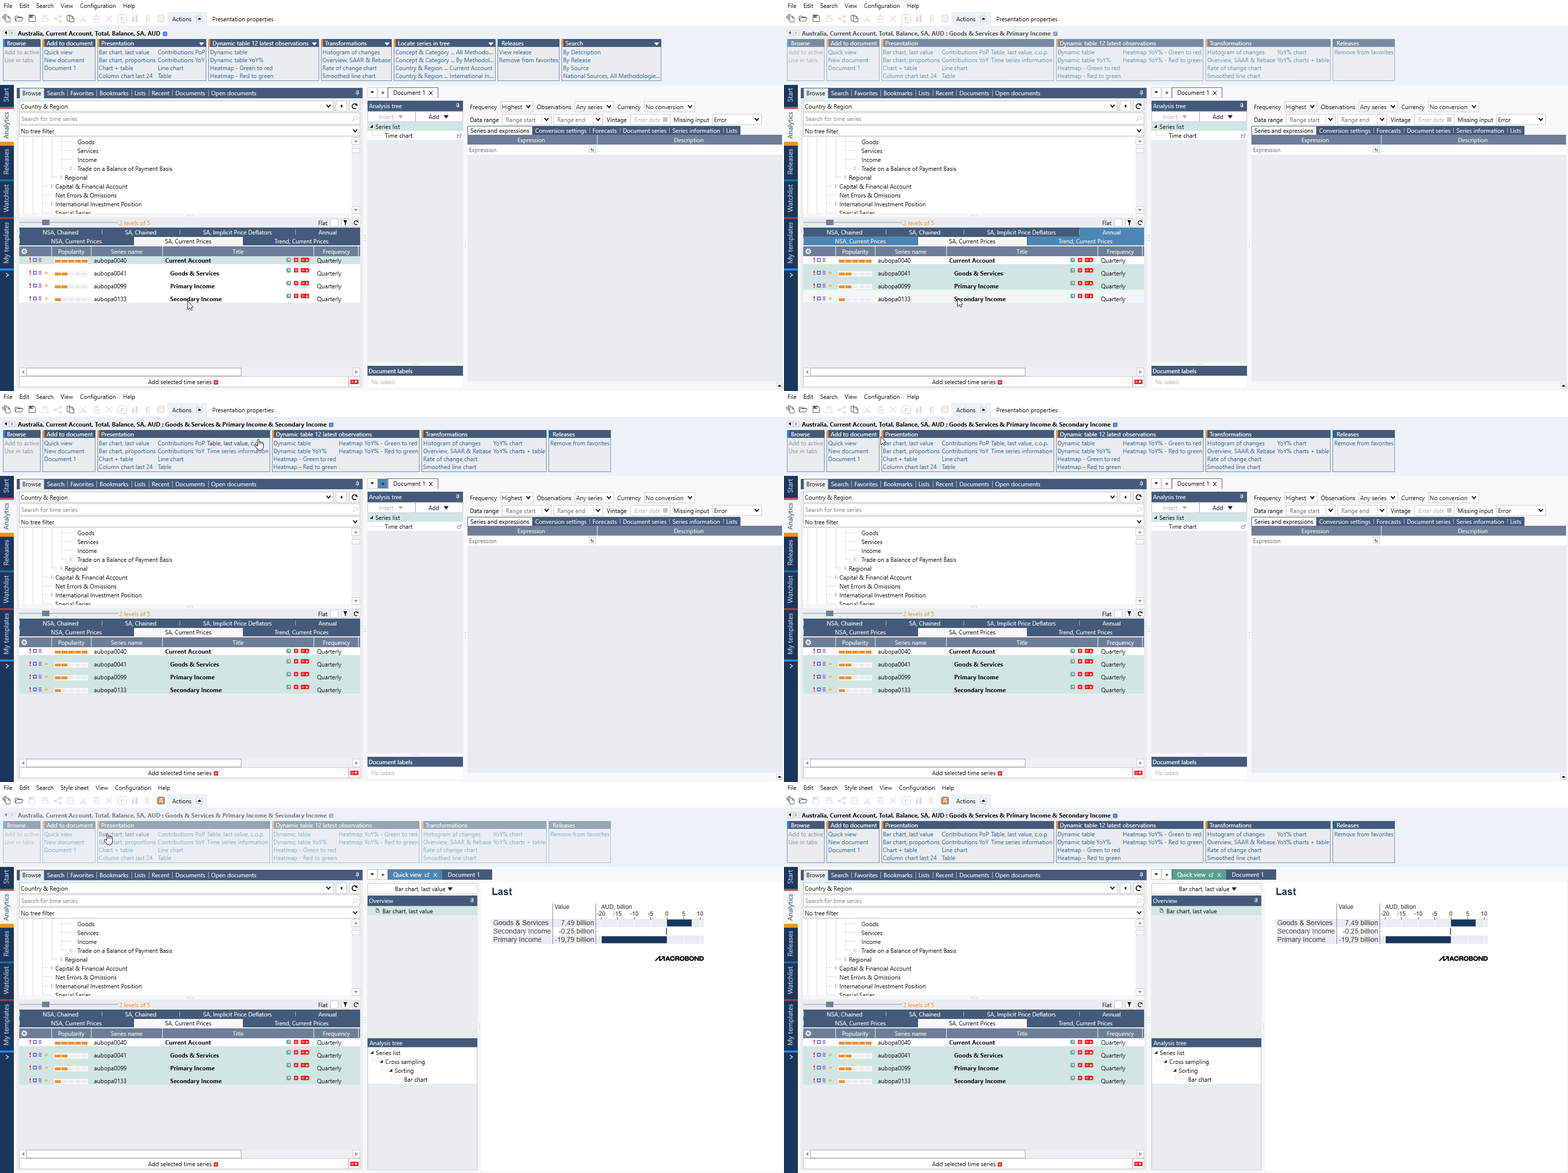
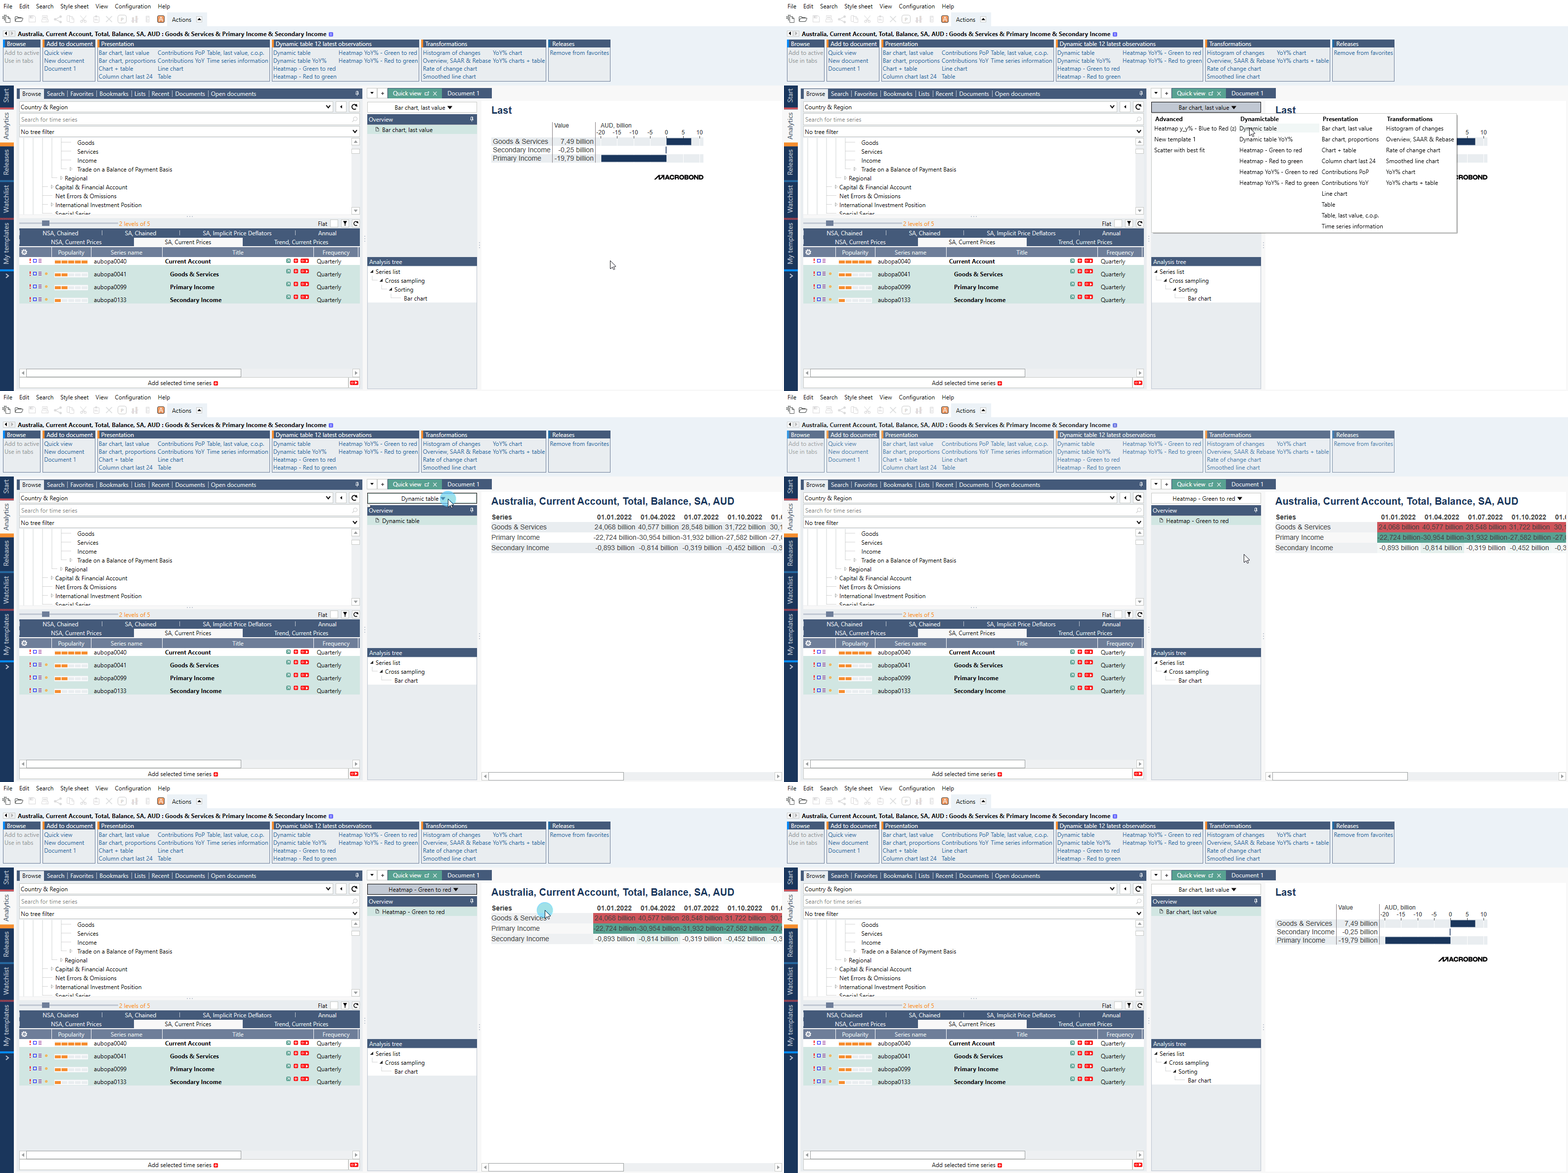
Once a Quick View has been applied, you can use the drop-down menu above the Overview section to select a different View.
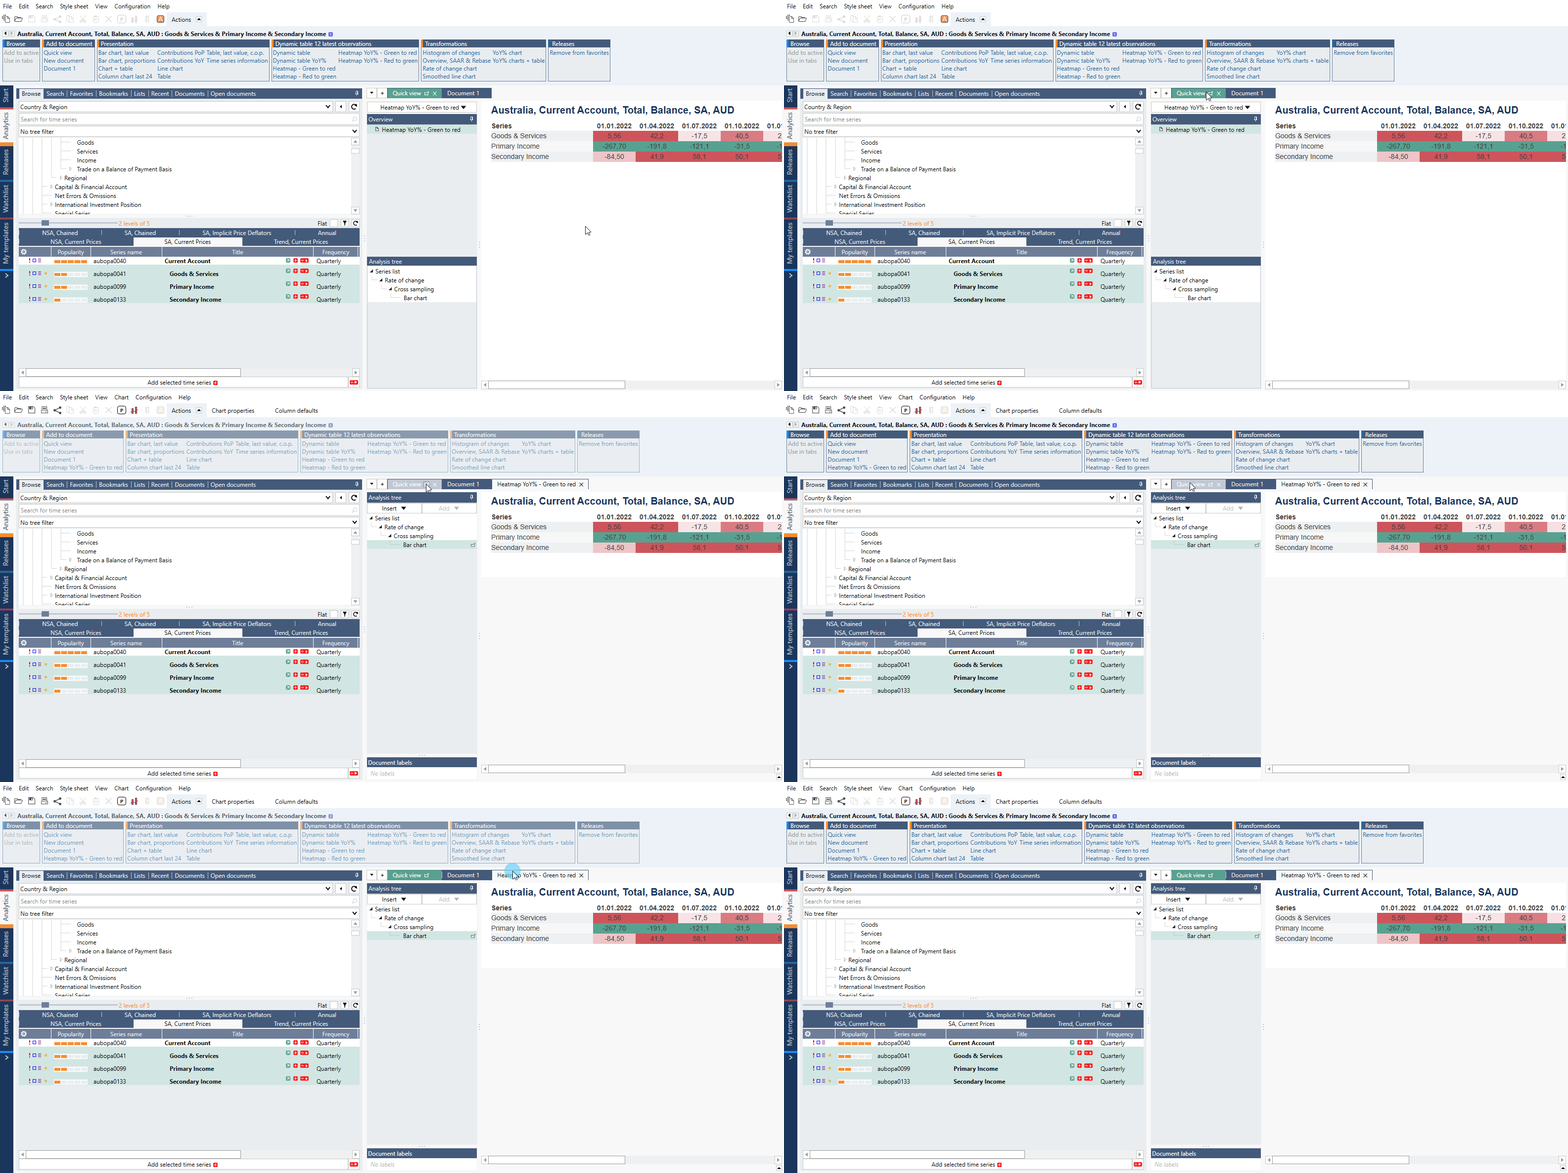
How to turn Quick view into normal document?
Press ‘Convert to analytics document’ icon.
Defining keyboard shortcuts
Under Configuration > Settings > Quick view tab you can change default pre-defined shortcuts.
My templates
This feature is available in Macrobond 1.31 and later.
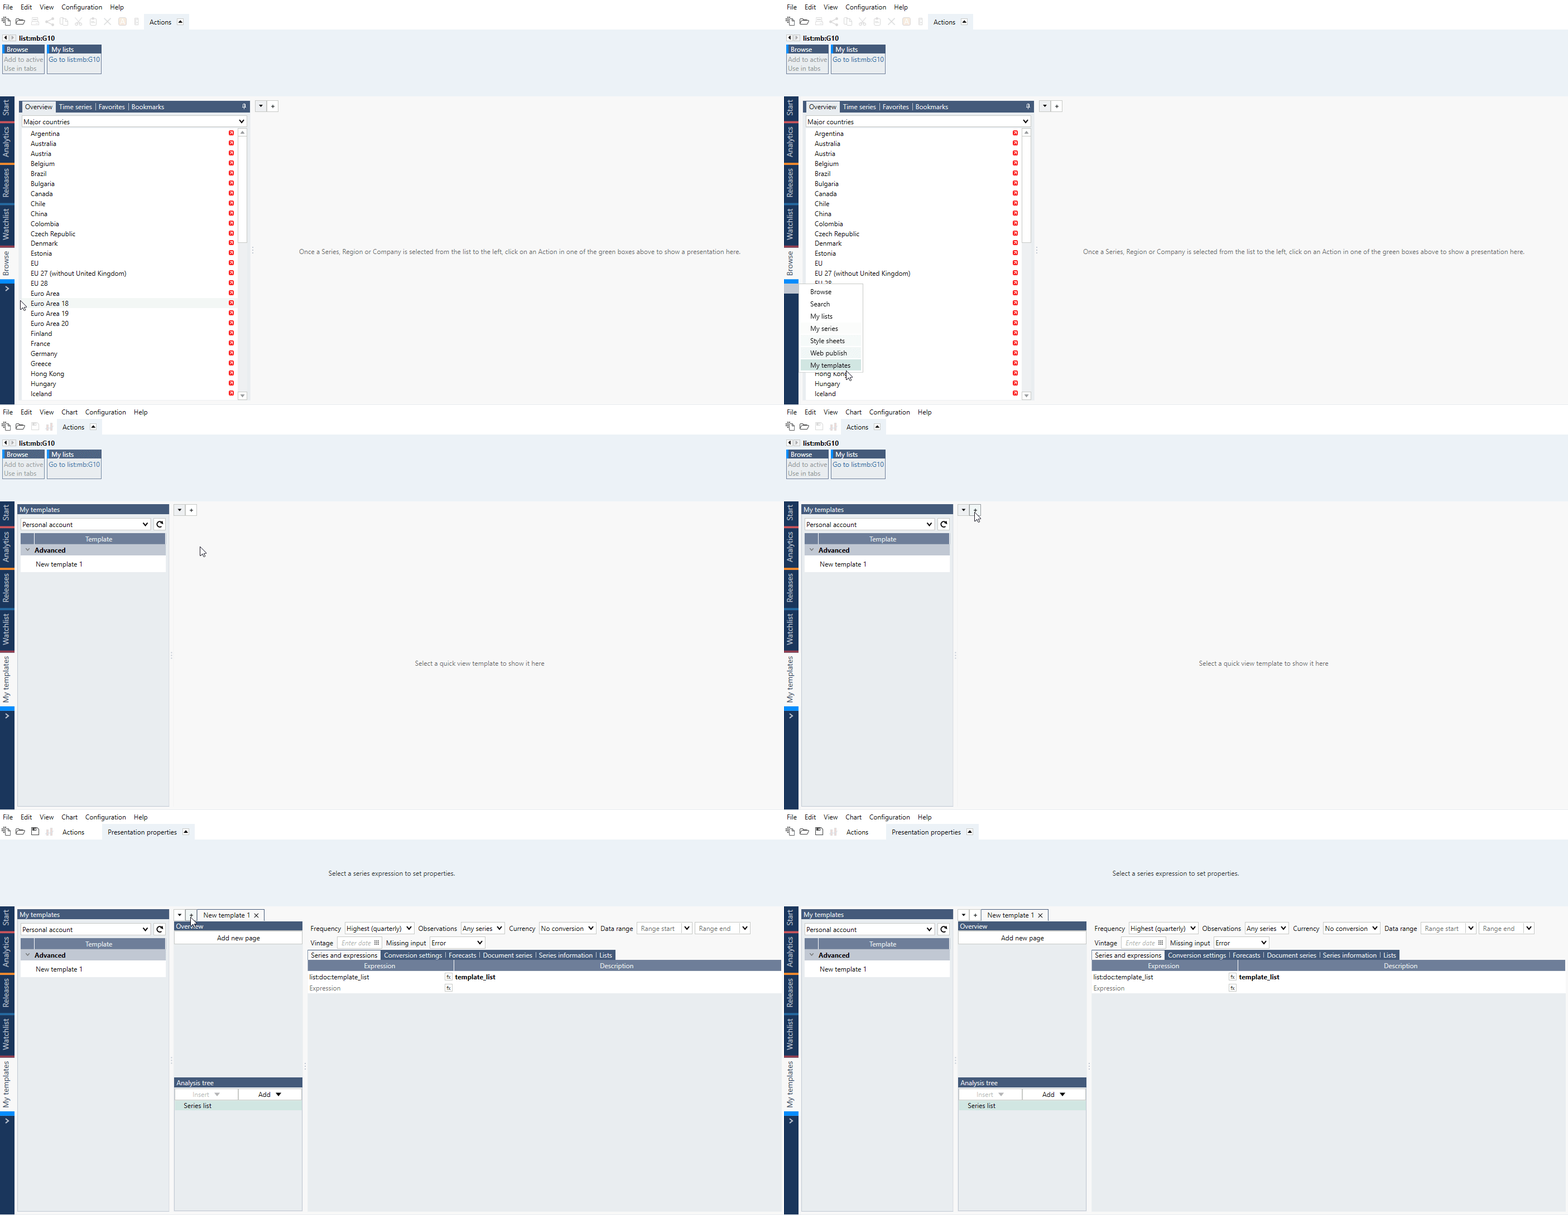
A dedicated activity, called My templates is now available to create your own Quick Views. It’s available under Flexi tab.
Creating new template
The interface resembles Analytics tab. To start new template press ' + ' icon. Here you will need to create a Macrobond document with charts and/or tables you intend to use in the Quick View.
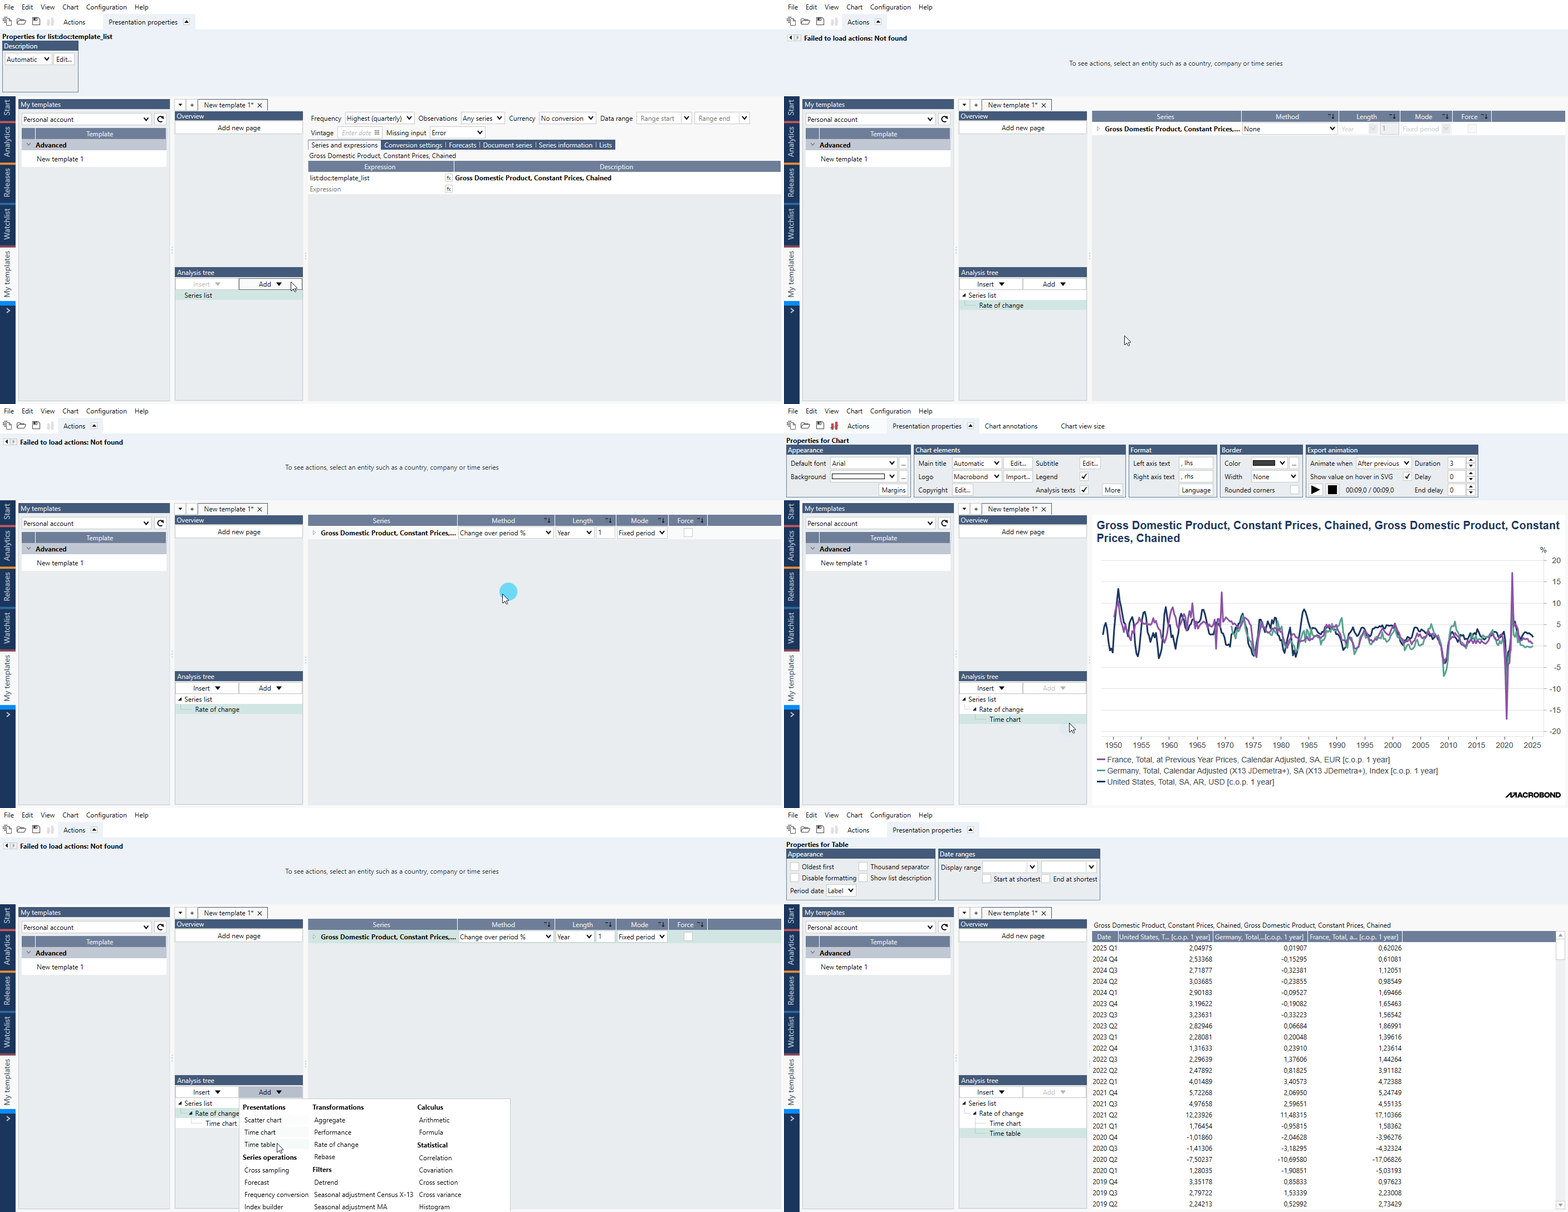
Adding series, calculations and charts
Like in Analytics tab under Series list add all relevant series and under Analysis tree you should add needed calculations and charts. My templates utilize Lists feature which has several implications:
- When adding multiple series to one Quick View, they will be added to a common list, meaning that they will all share the same set of calculations.
- The list feature is not compatible with several analyses that require to set settings for individual series. Example: the Regression analysis requires to set a dependent series, which cannot be done through the List feature.
Adding the presentations to a page
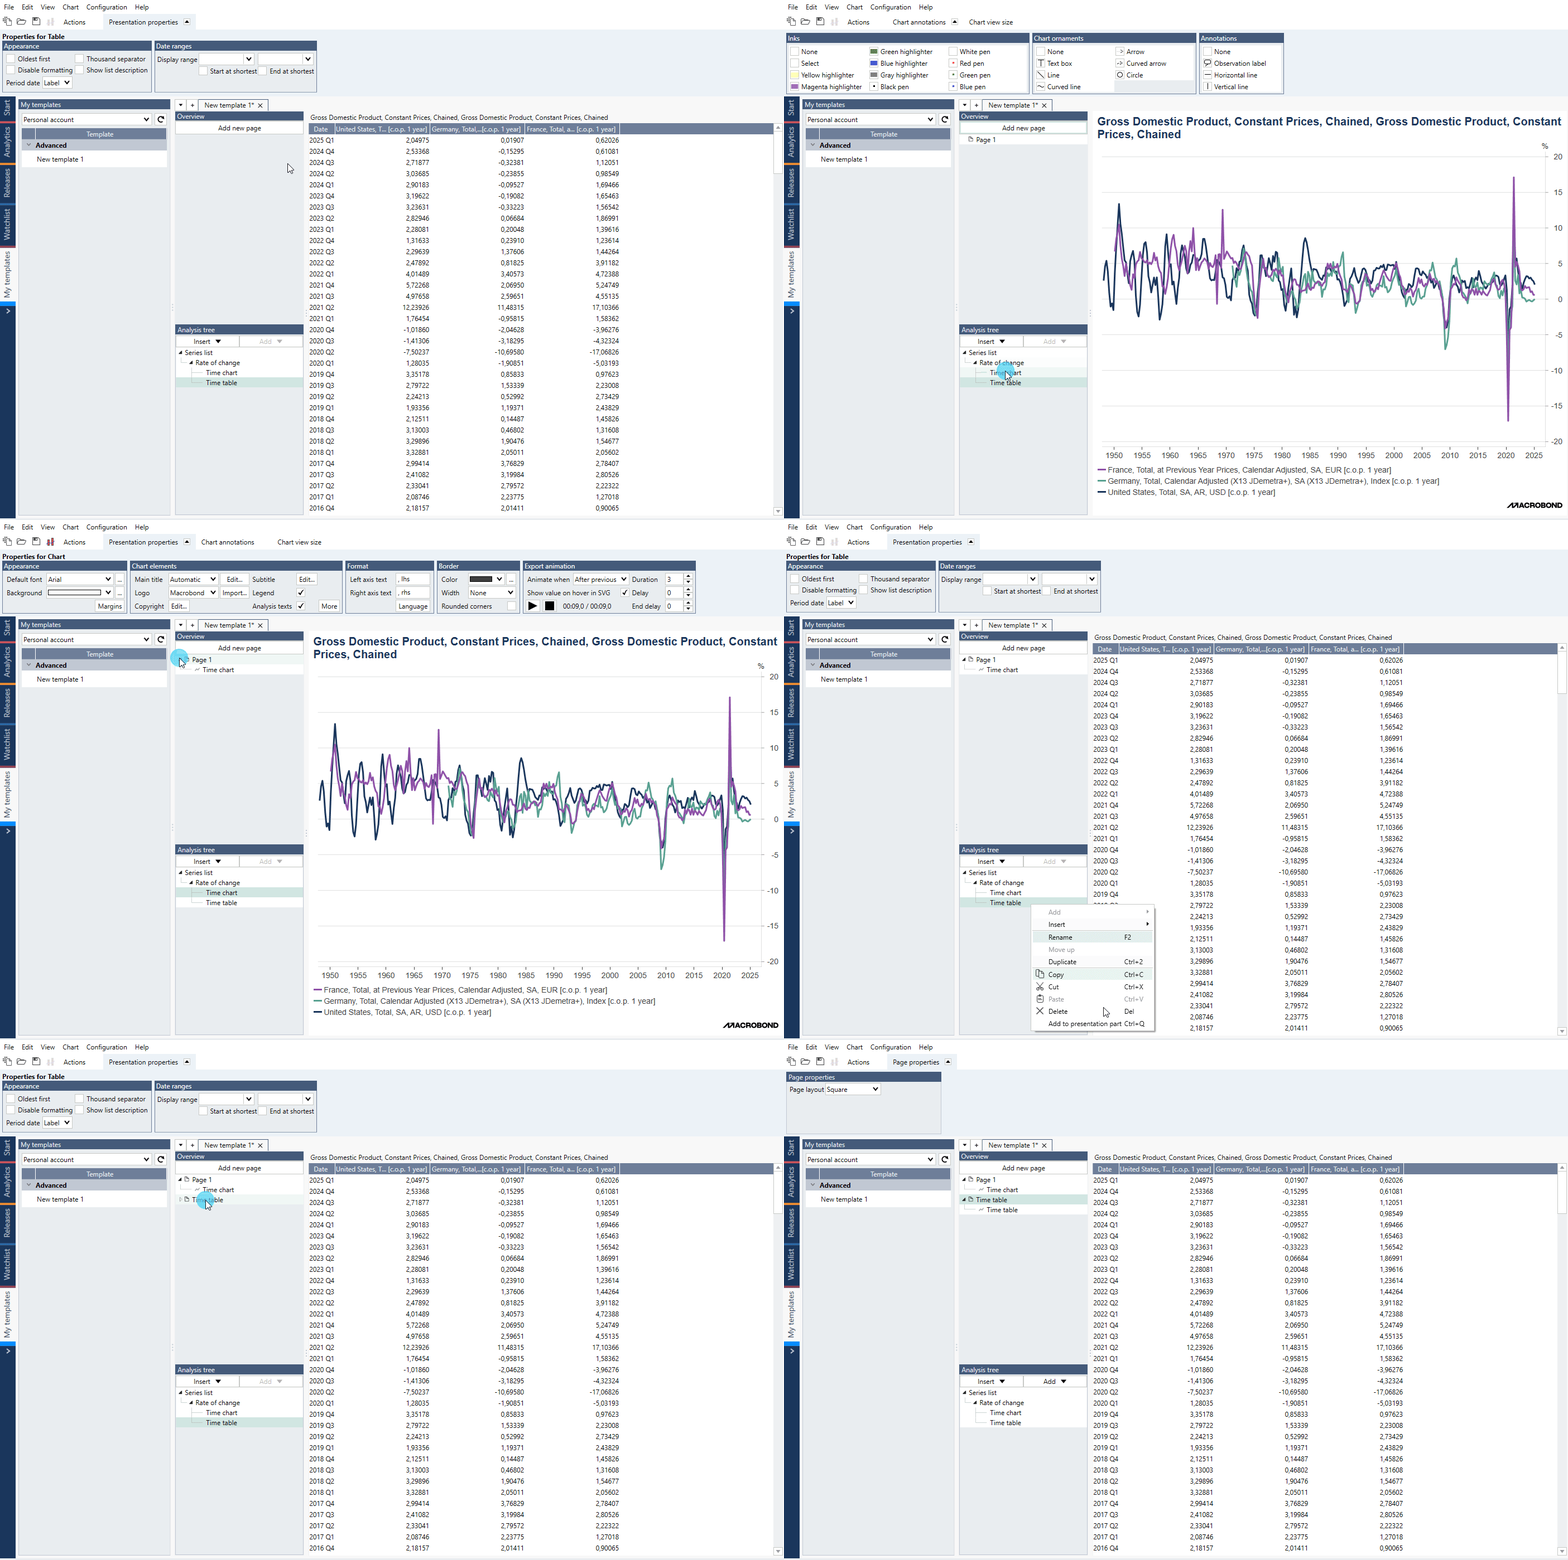
See Overview panel which resembles Presentation documents functionality. You can either:
- Press ‘Add new page’ and drag & drop charts under
- Right-click on chart in Analysis tree and select ‘Add to Presentation part’
Organizing page layout
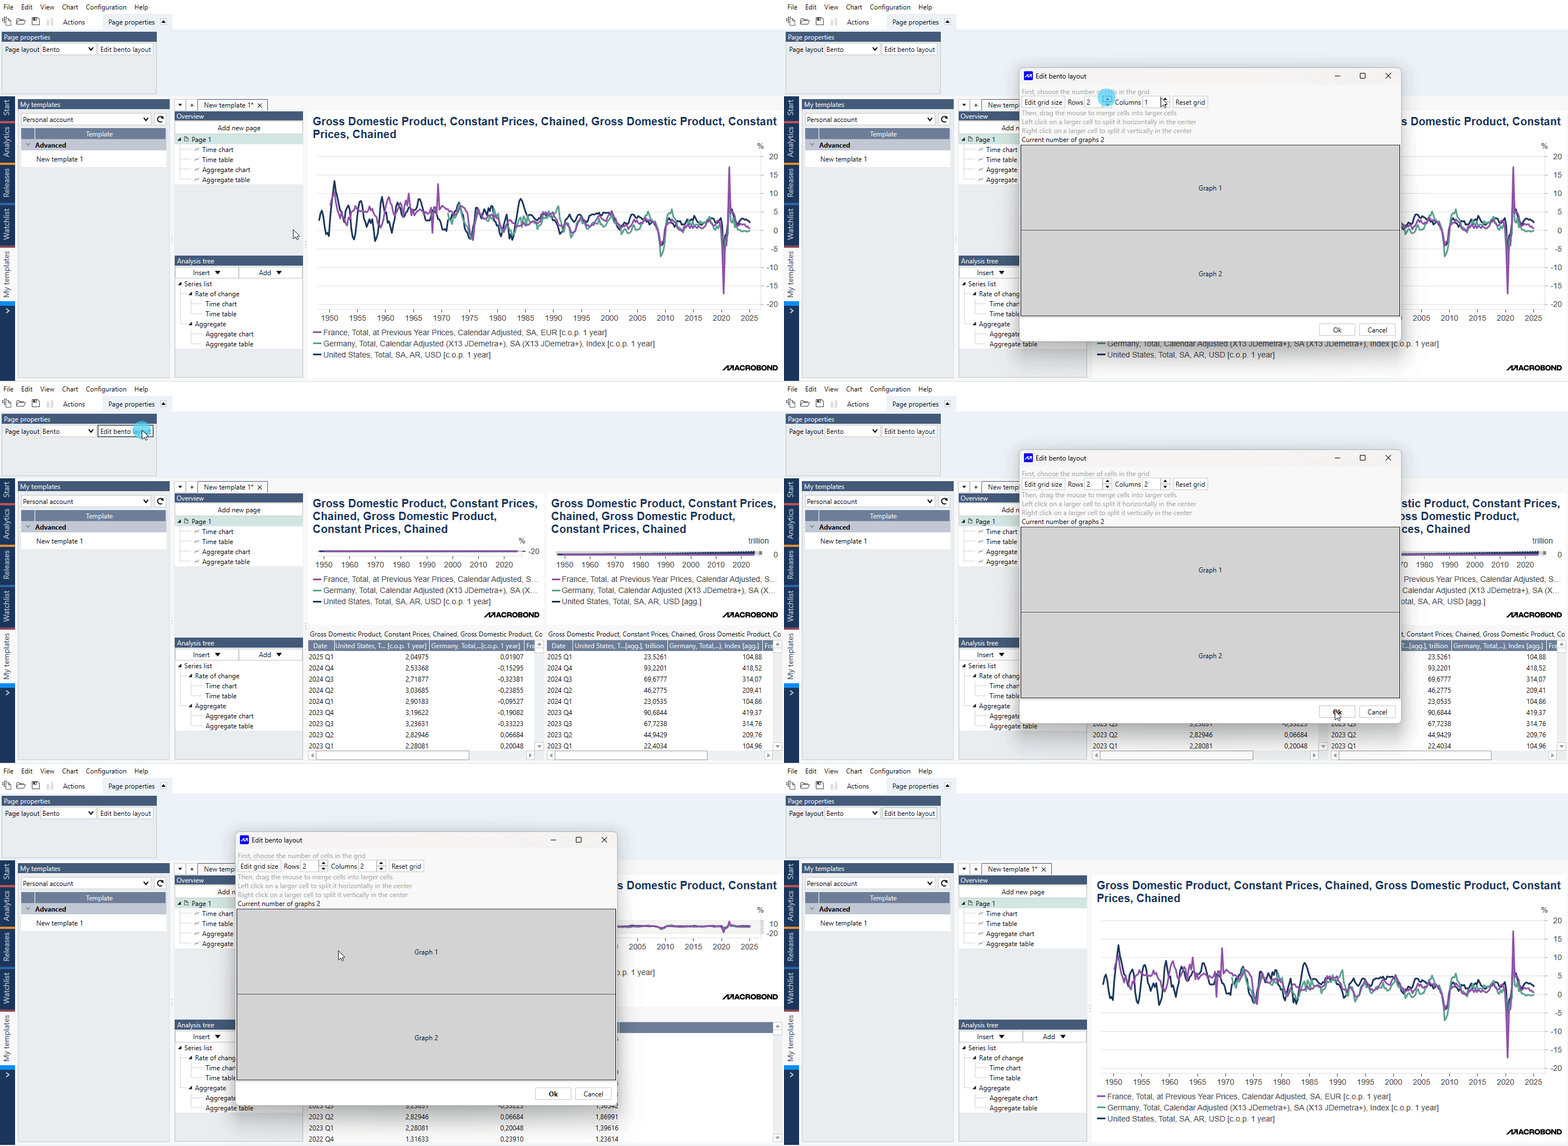
Click on a 'page' and you will see ‘Page properties’ panel in Actions ribbon. For additional customization, you can use the Bento setting.
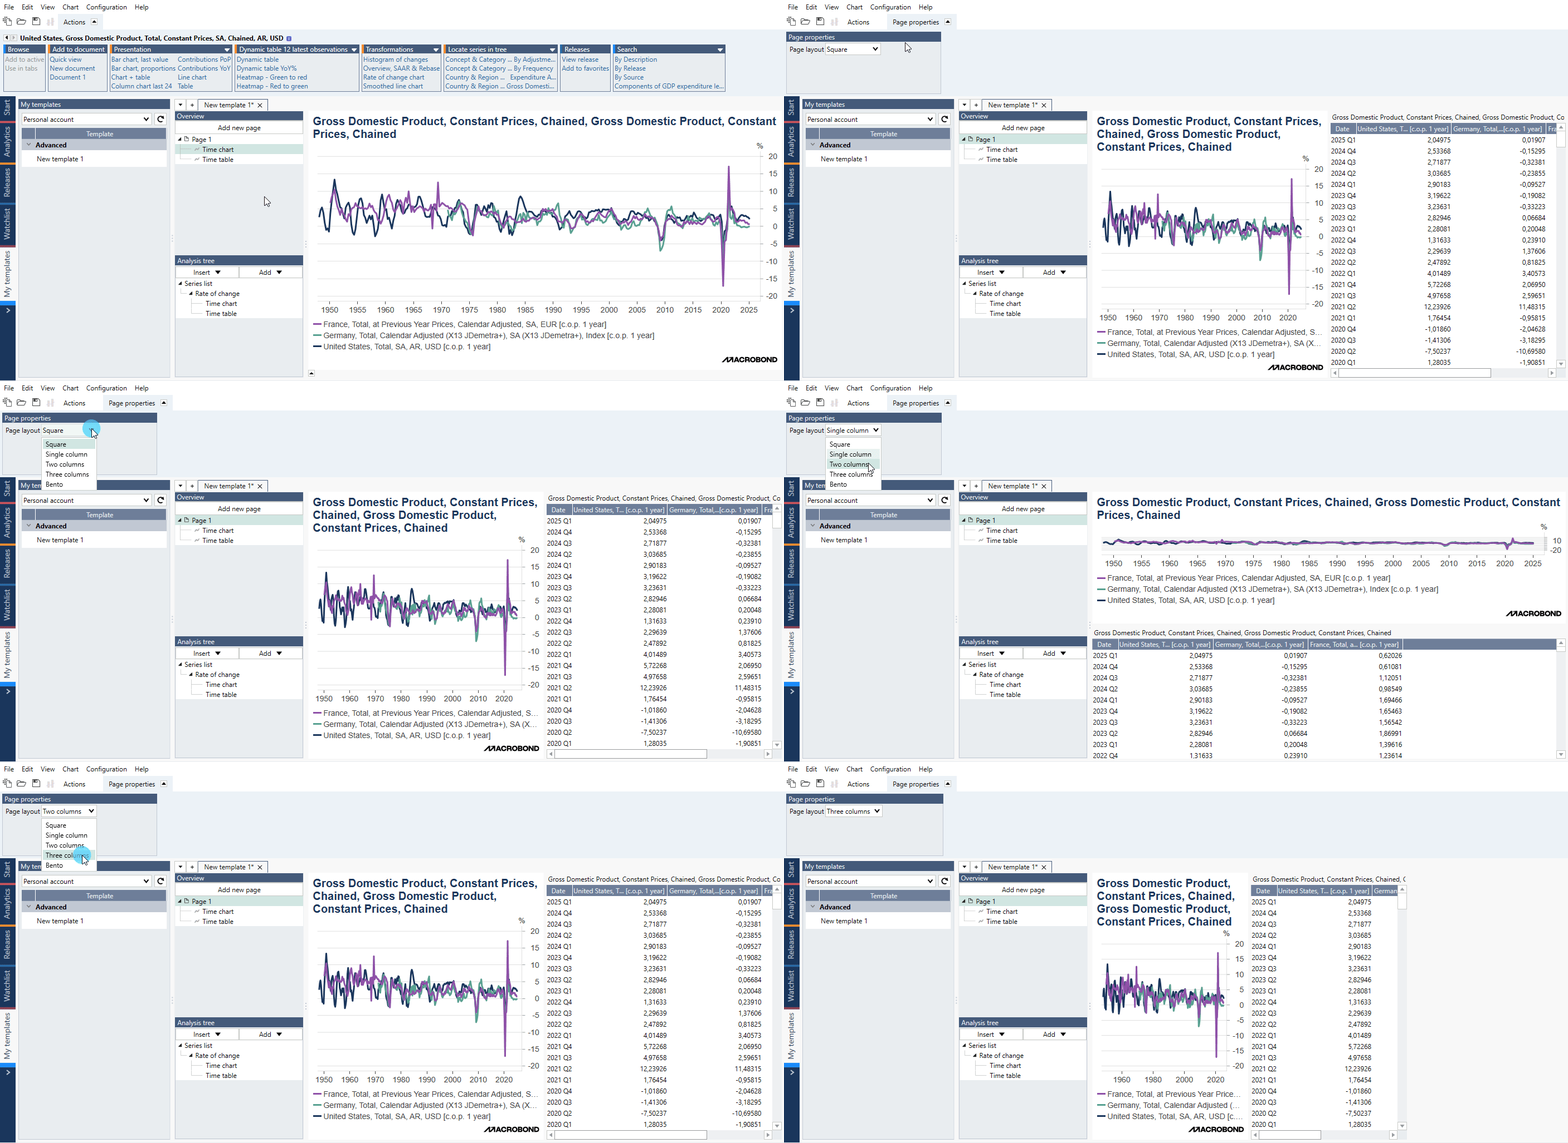
With Bento, you define first the number of rows and columns you want to split the layout into. You can also merge cells, or ‘graphs’ as we call them, by dragging them together.
Creating multiple pages in one Quick View
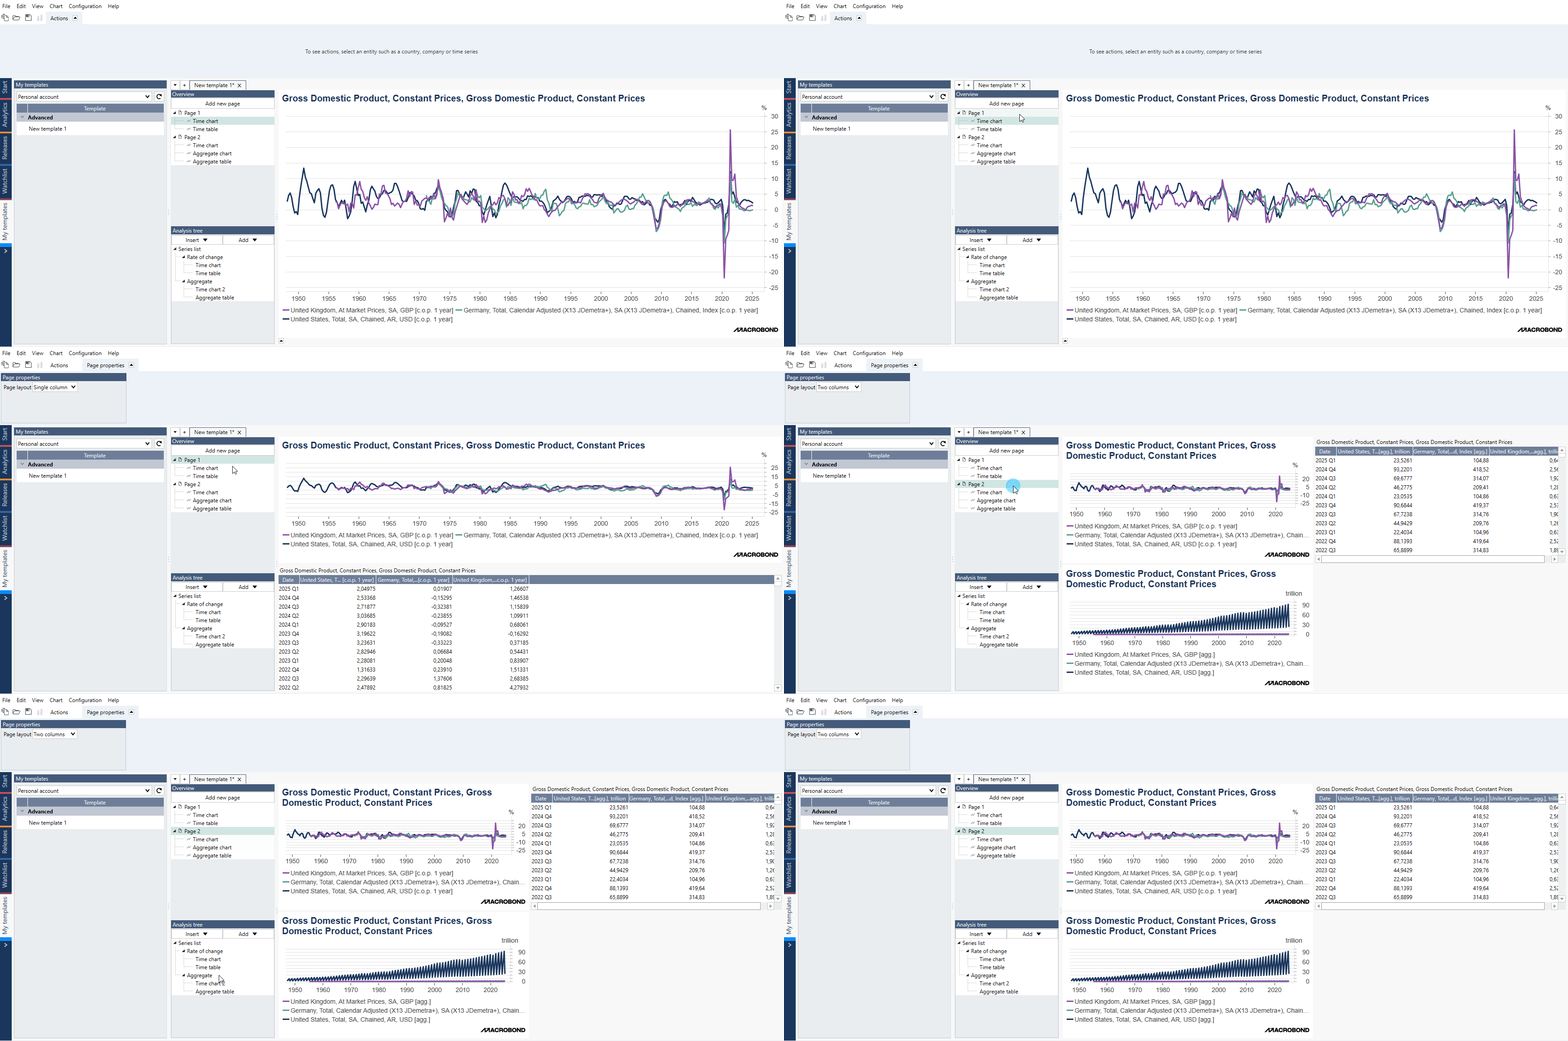
You can also create a Quick View containing multiple pages. This would allow you to have a first page with a main overview, together with additional pages presenting different calculations or details instead of creating several independent Quick Views.
Saving the Quick View
To save template go to File > Save as…. In new window select account, name and group:
