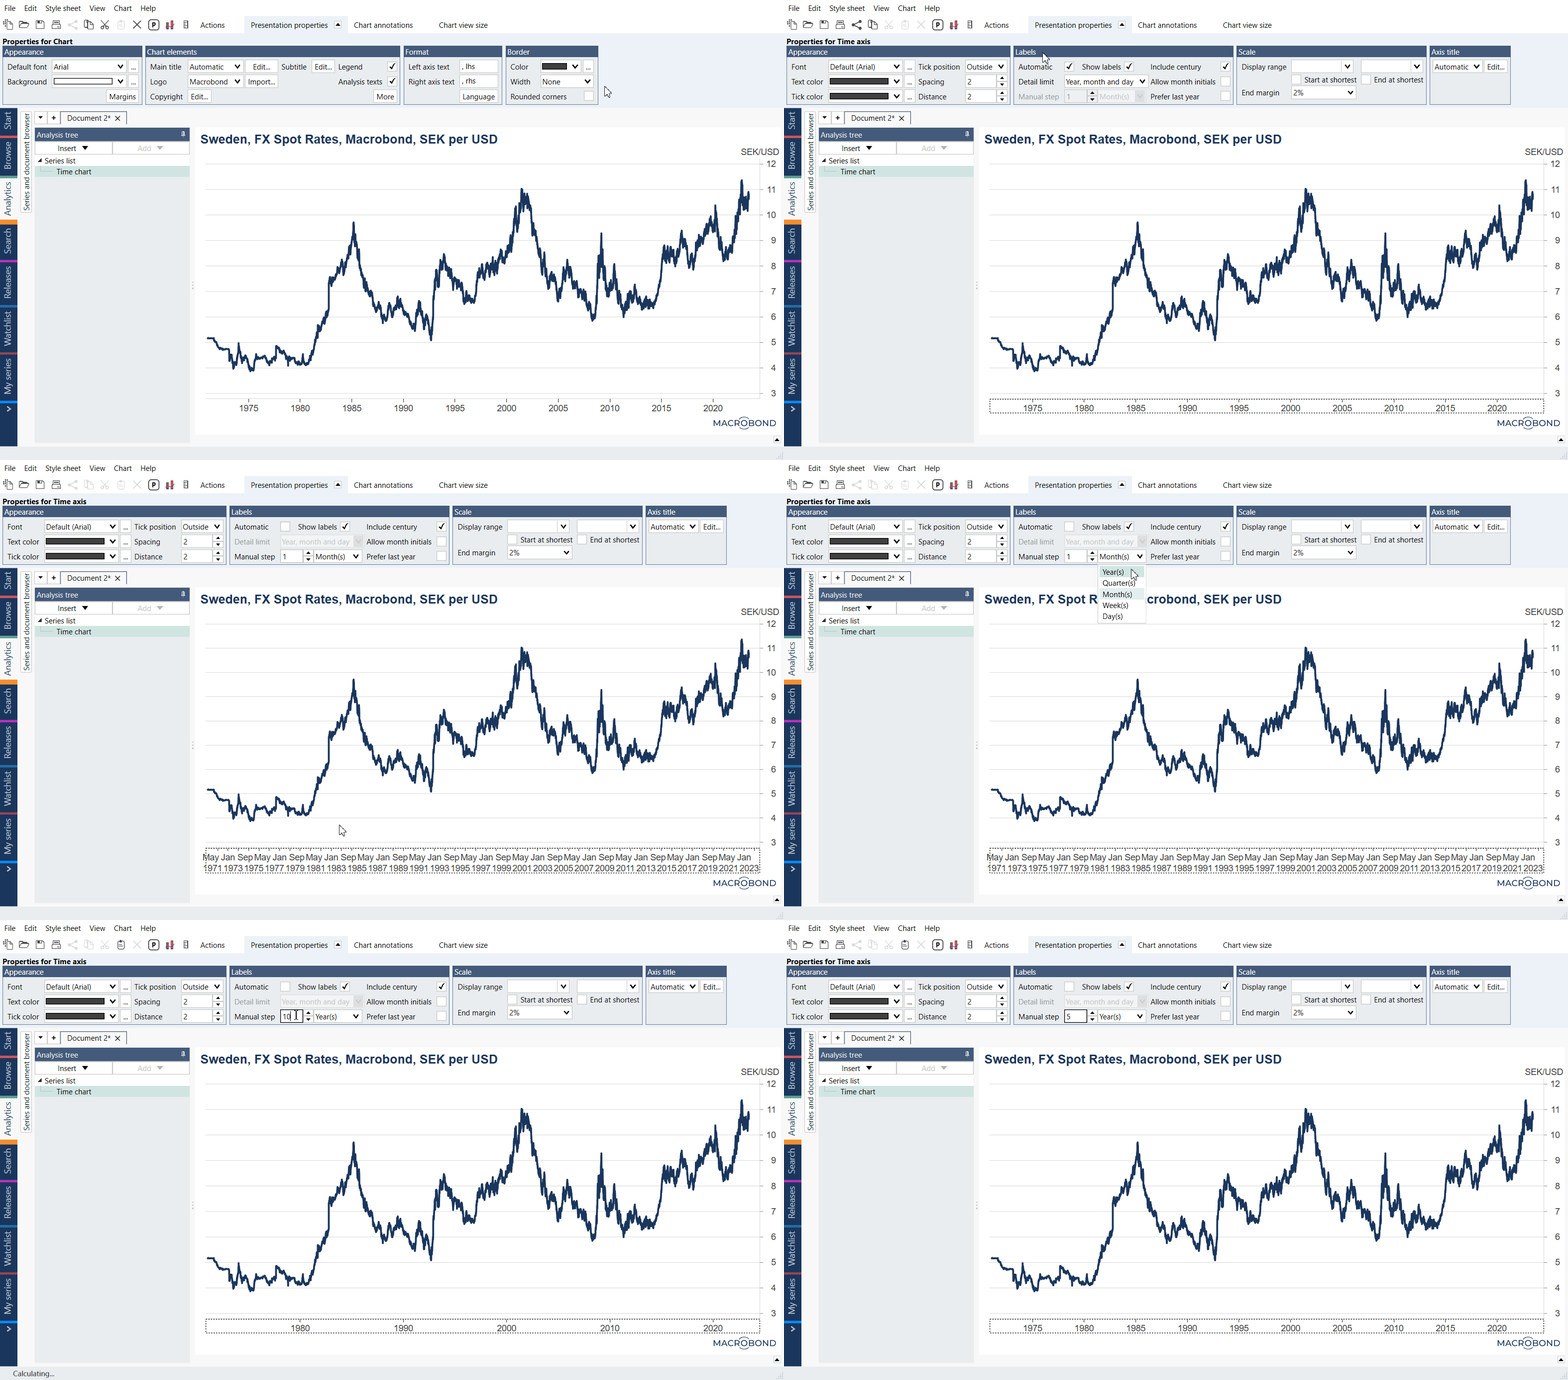
Click on the x-axis and open the Presentation properties tab at the top of the window. In the Labels group you can manipulate the scaling of the axis.
The automatic setting will label the scale with the frequency that allows for the best view. Unchecking it will enable you to use the manual step option which lets you specify another frequency for the axis.
 See here pre-1.27 version view
For more information: