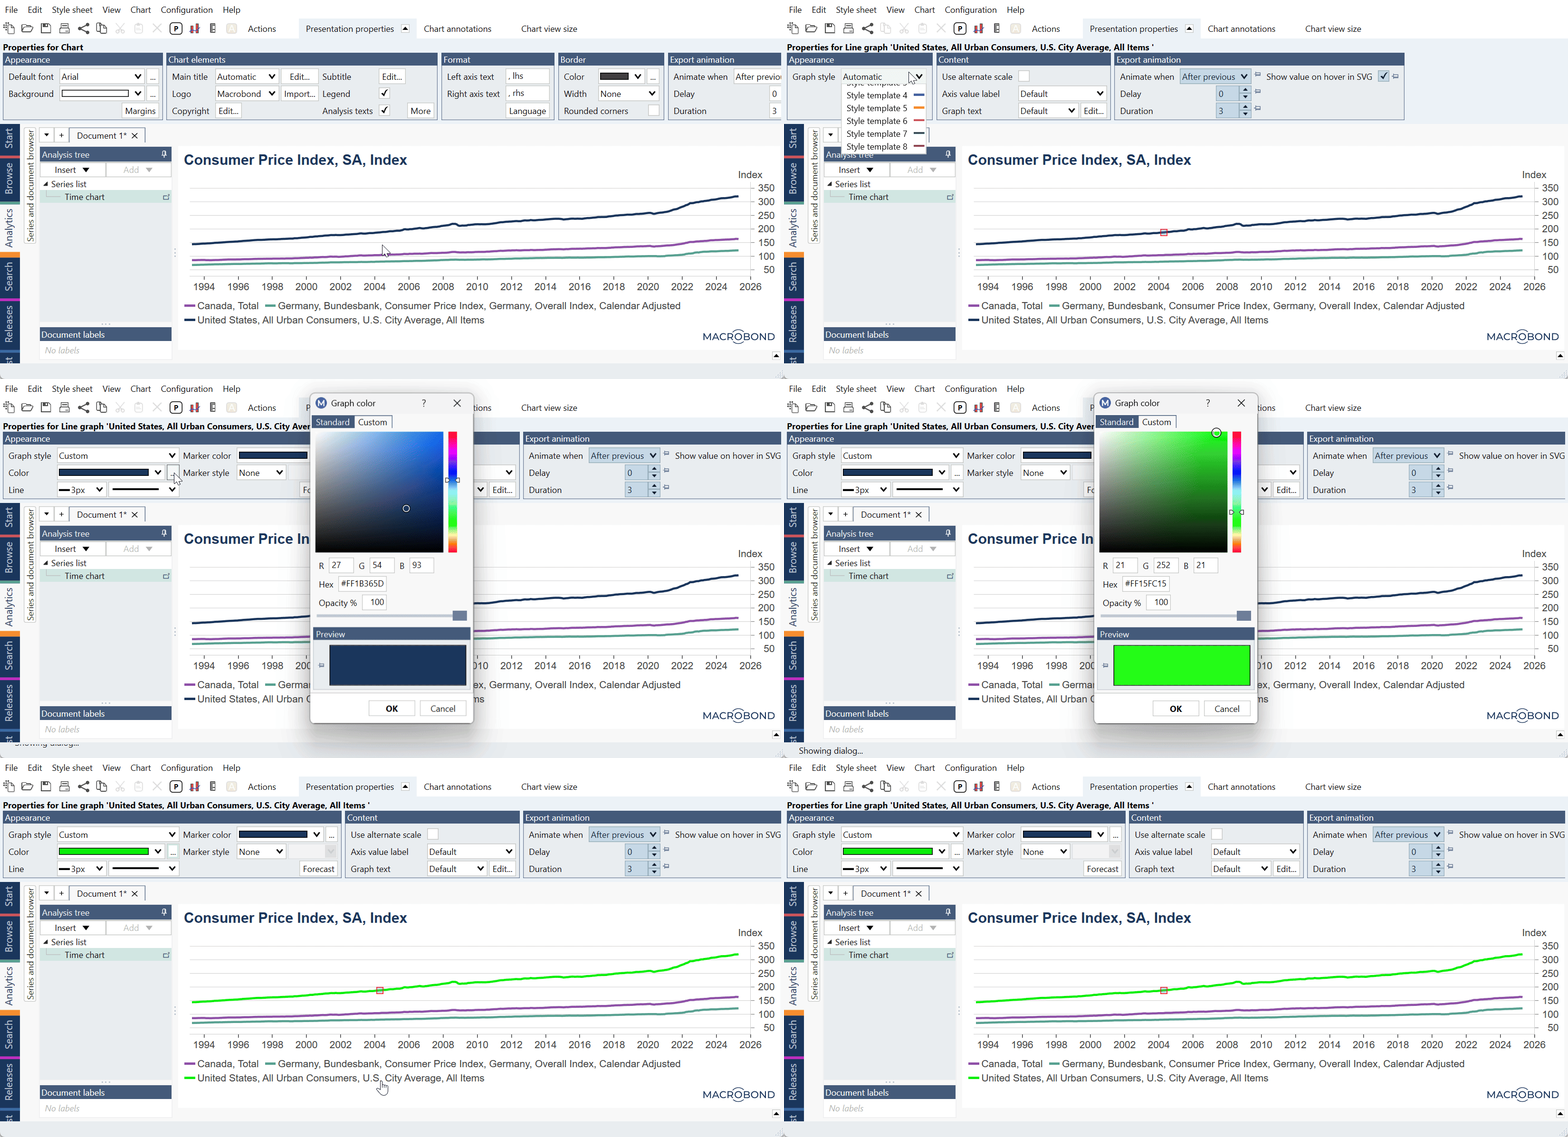
If you want to change it only on one chart, please click on an element and under Presentation properties > Appearance > Graph style select 'Custom'. You will see new options including color selector under [...] button:
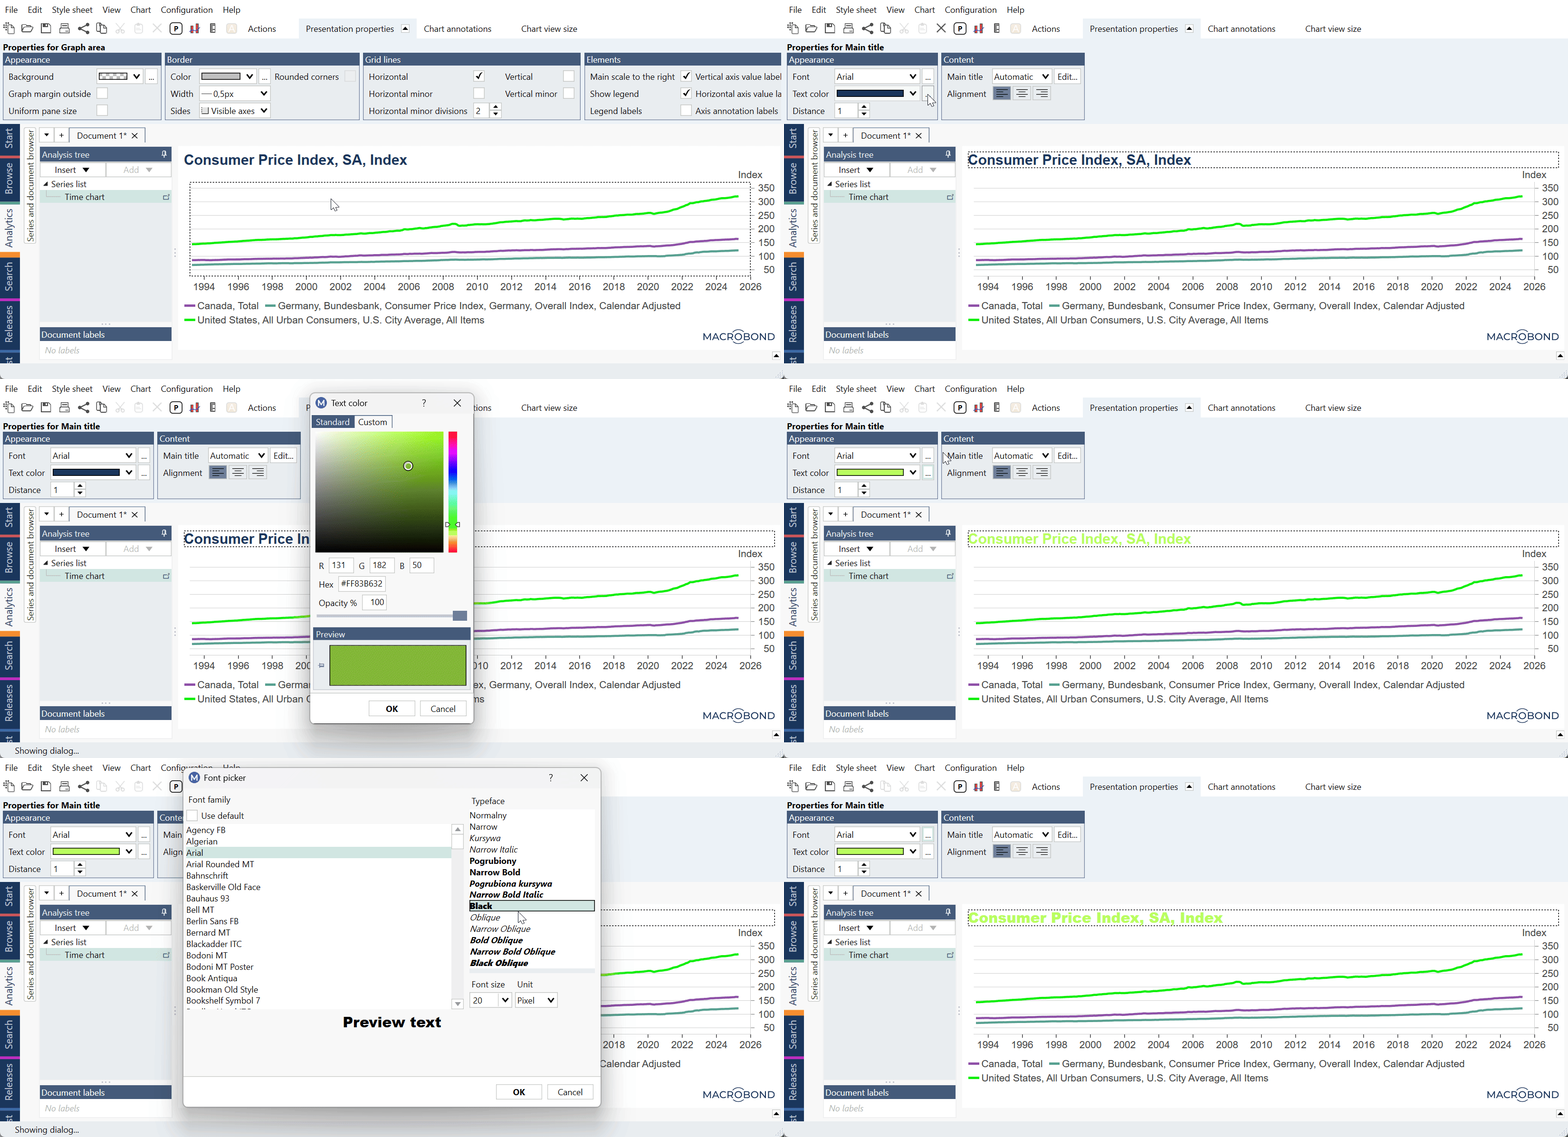
 Text parts of chart will have this under Presentation properties > Appearance > Text color > [...] button:
 If you want to change Style sheet’s colors, please go to Style sheet tab, open style sheet, apply changes, save it. Go to the original chart and reapply template.
For more information: