Overview
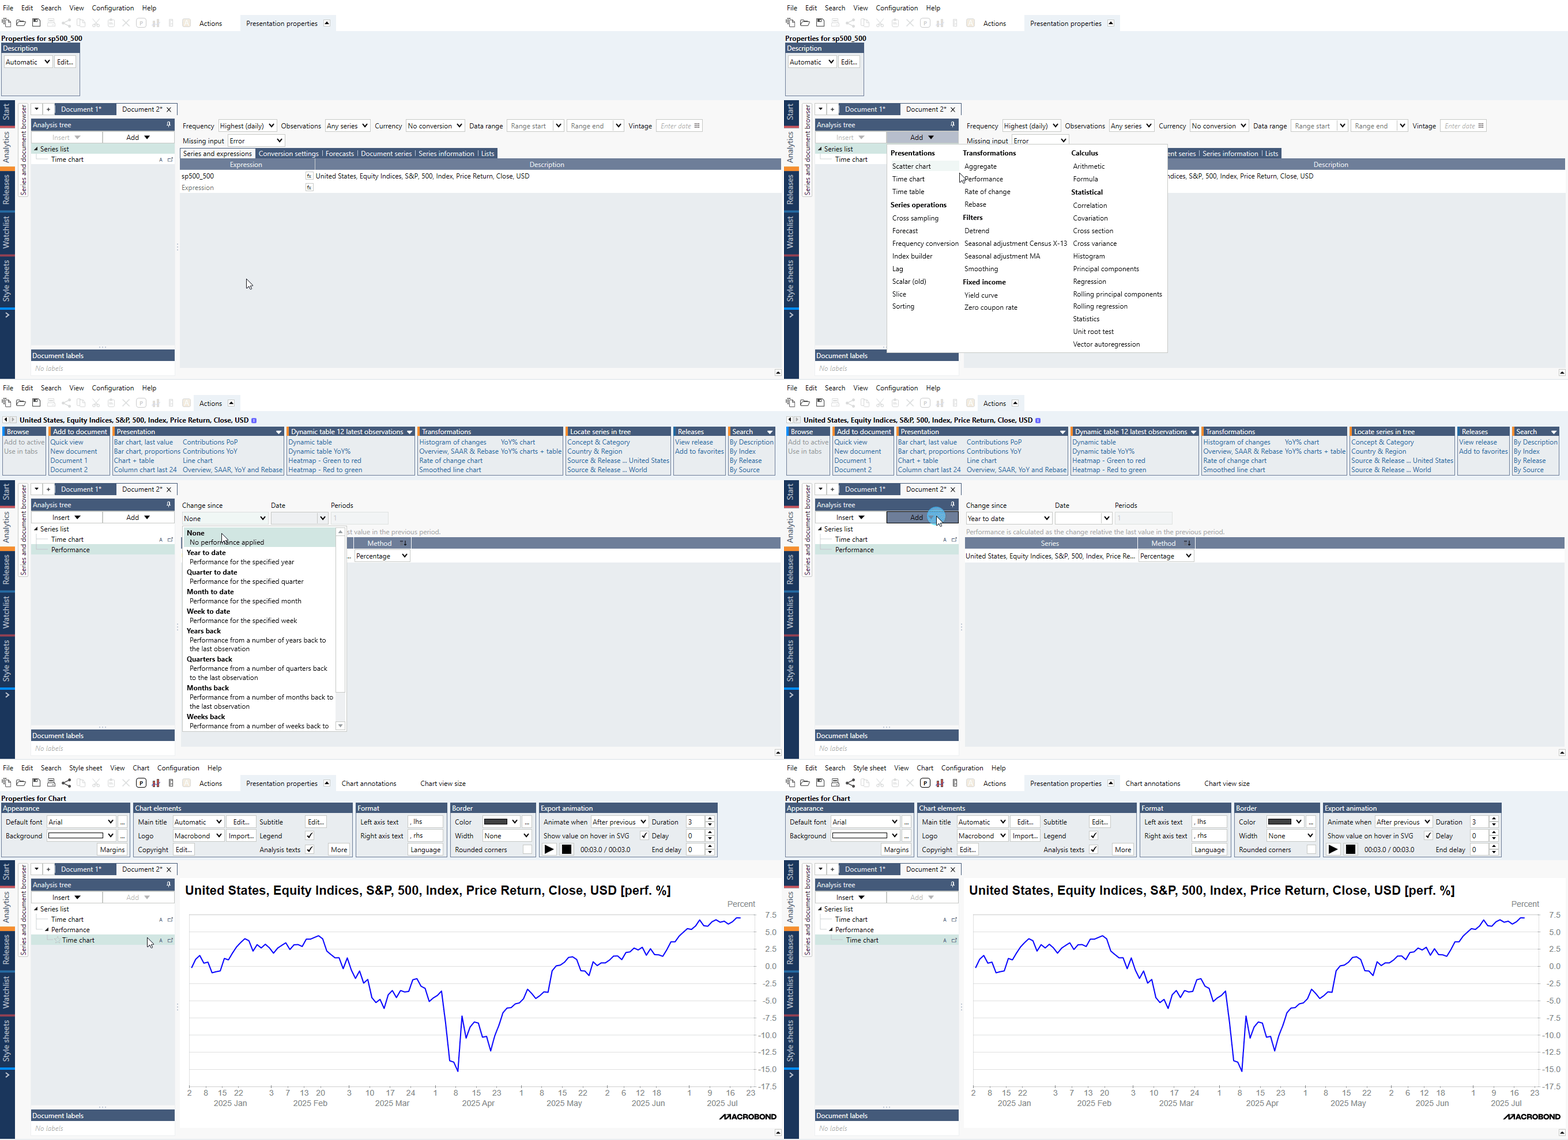
Example of general use of Performance analysis calculating Year to date for current year (in percentage):

The Performance analysis allows you to see how a time series has changed in relation to some point in the past. It’s different from the rate of change analysis in that performance calculates the change from a specific point in time, whereas rate of change calculates changes over time.
Settings
Change since, date and period
Specify the period in which to calculate performance.
Note that the performance will be calculated relative to the first value before the specified starting point.
Year to date, Quarter to date, Month to date, Week to date
- Calculate the performance during a year, quarter, month, or week
- Enter a date to select a specific period
- If no date is specified, the last period of the series will be used
Years back, Quarter back, Months back, Weeks back
- Calculate the performance in the last years, quarters, months, or weeks
- Specify the number of periods back at which to start the calculation
Specific date
- Calculate the performance starting at a specific date until the end of the series
Method
Select whether to measure performance as a percentage change, value, or logarithmic change.
Value
Calculate the change in value over the time.
Percentage
Calculate the percentage change over the time.
Logarithm
Calculate the logarithmic percentage change over the time.
Examples
We calculated the percentage change since the beginning of the year for a group of equity indices using the performance analysis. We selected 'Year to date' under change since and 'Percentage' under method.
We calculated the percentage change since the beginning of the year with formulas and cut series at the certain date.
Add '0' before the outcome from Performance analysis.
Questions
Why does the output doesn't start with 0?
The Performance analysis calculates the change from the observation that is before the specified start date. In other words, the observation prior to the start date is the value '0'.
If you want a performance chart that starts with 0 as the first value, you can use formulas to as in this example:
File: Perf YTD% with formulas
or push '0' before the beginning of each series as in: Performance with added 0.
Why Year-to-date isn't calculated till selected date?
When you select Year to date, Quarter to date, Month to date or Week to date, the analysis will calculate the performance during a year, quarter, month, or week. The period is selected by a date, but not all parts of the date will be used to identify the period. If you select YTD, only the year of the date is relevant.