Overview
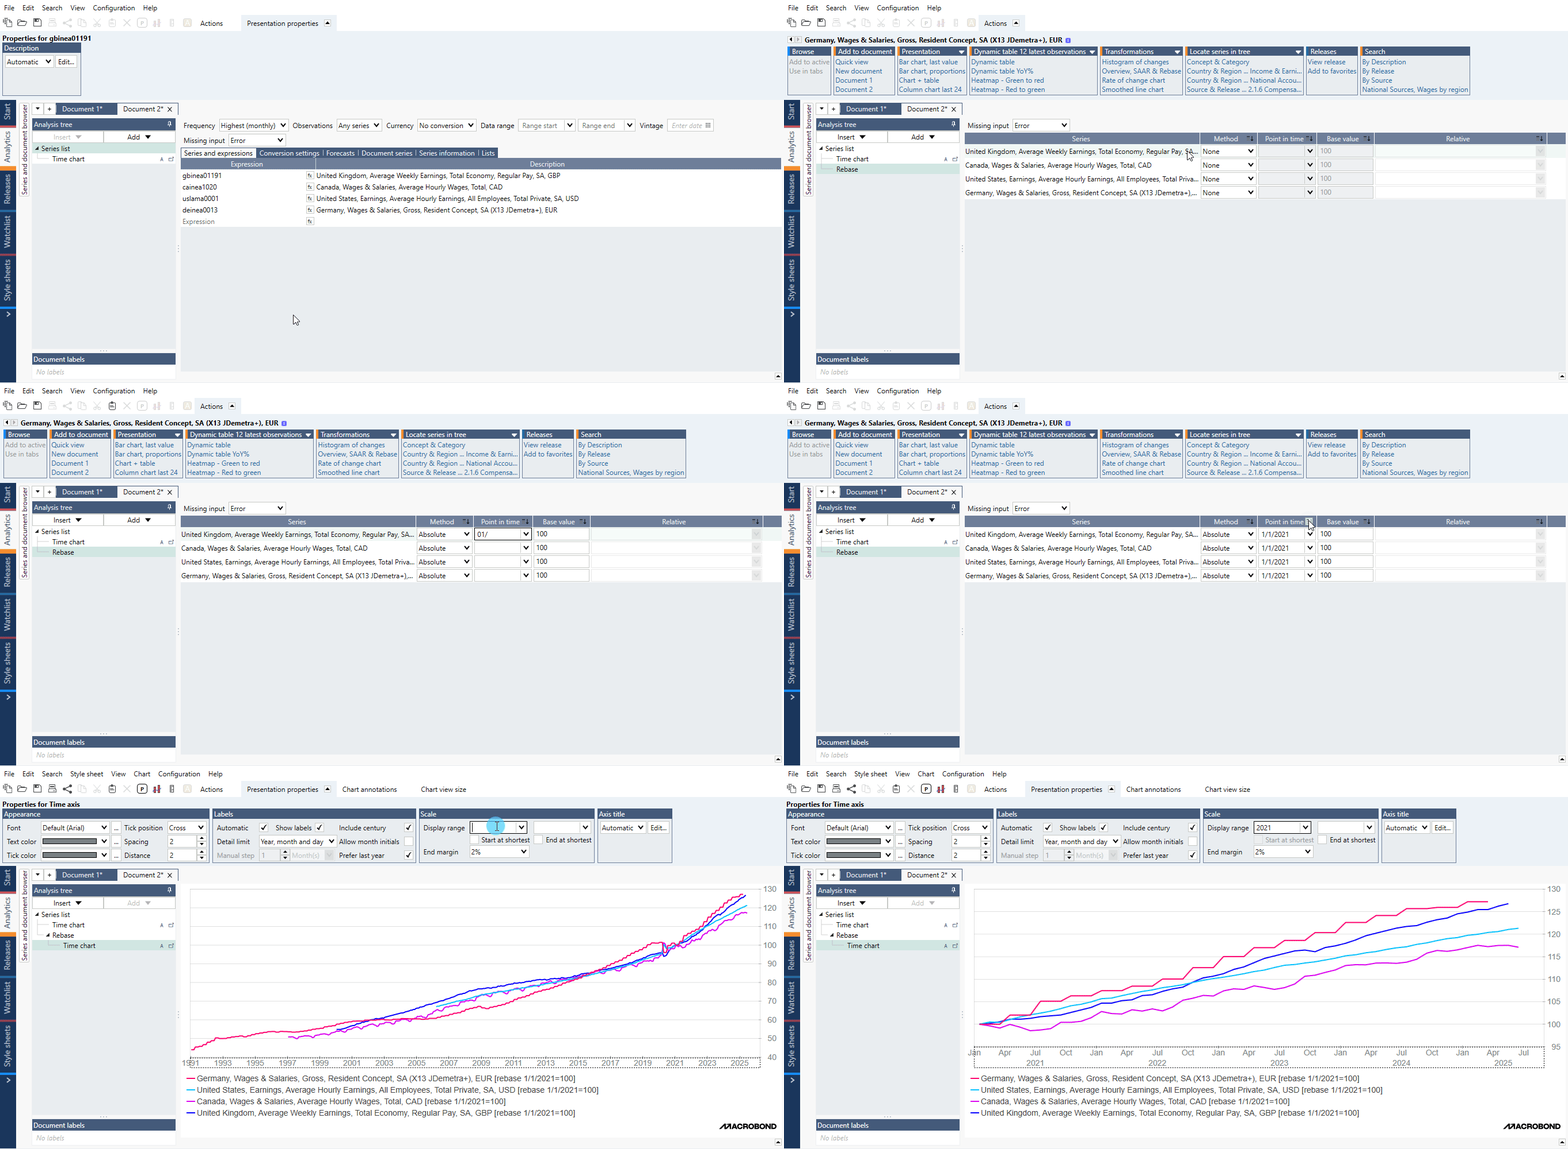
Example of general use of Rebase analysis for a group of series:

To index or compare series with different scales, one way to make the comparison easier is to apply Rebase analysis. It also allows you to show the change from a specific date.
Method
The Rebase analysis allows you to attribute a base value – usually 100 – at a specific point in time for the time series and calculates all observations relative to your chosen reference point as in: (x/xt)*100. In other words, the analysis performs a multiplicative scaling of the series from the date you have chosen.
Negative values
When xt (in (x/xt)*100) is a negative number, the series is multiplied and divided by negative number - making all of the negative numbers positive and other way around.
Settings
Absolute Method
Assigns a base value at a specific point in time by which all observations are calculated.
Relative Method
Assigns a base value equal to another series at a specified point in time. Useful when you want to compare a time series to another one without changing the scale on all of them.
Point in time
This refers to the date at which the base value is assigned.
The way the date is entered may affect the calculation:
- Absolute date: typing the year only (i.e., '2000') as the point in time for a series with a higher frequency than annual will rebase the series using the average value of the year. This principle is also applied if you type only the year and month (i.e., '2000-01') to rebase a series with a higher frequency than monthly: the rebase will then be performed using the average value of the month.
- Relative date: you can rebase series using a relative date. For instance, typing '-5y' will rebase the series 5 years prior to its last observation (or prior last observation in common calendar if there are more series). The base date will therefore change every time a new value is available. See Indicating point in time for more options.
If you do not specify a point in time, Macrobond will use the first observation of the series as base value.
Examples
This document compares the GDP of several Euro Area countries by rebasing all series to Q1 2008 at 100. This provides an indication of how the GDP of these countries has recovered from pre-crisis levels
This example compares two equity indices: the FTSE 100 and the S&P 500.
Since these series have different scales, one way to compare them would be to rebase the FTSE 100 relative to the value of the S&P 500 on January 1st 2000 (meaning that we will assign to the FTSE 100 the value of the S&P 500 on January 1st 2000, and rebase it accordingly).
It's not possible to set '0' in Rebase analysis but using Statistics and Arithmetic you can achieve this.
Note, it is also possible to recreate such analysis in Slice with Additive rebase with base value functionality.
Questions
How to chain link the indices and rebase same month each year?
To make series as chain linked and rebase for same month each year use below formula:
- for every January of each year
uscpi/At(uscpi, StartofYear())*100
- for every June of each year
uscpi/At(uscpi, StartOfYear()+MonthsLength(5))*100