There are two ways to access Macrobond data in Excel. You can either start in Excel, perform a direct download using the Macrobond add-in. Or you can start in the application and download the calculations you’ve performed there to Excel. Both ways will be described below.
Direct download from Excel add-in
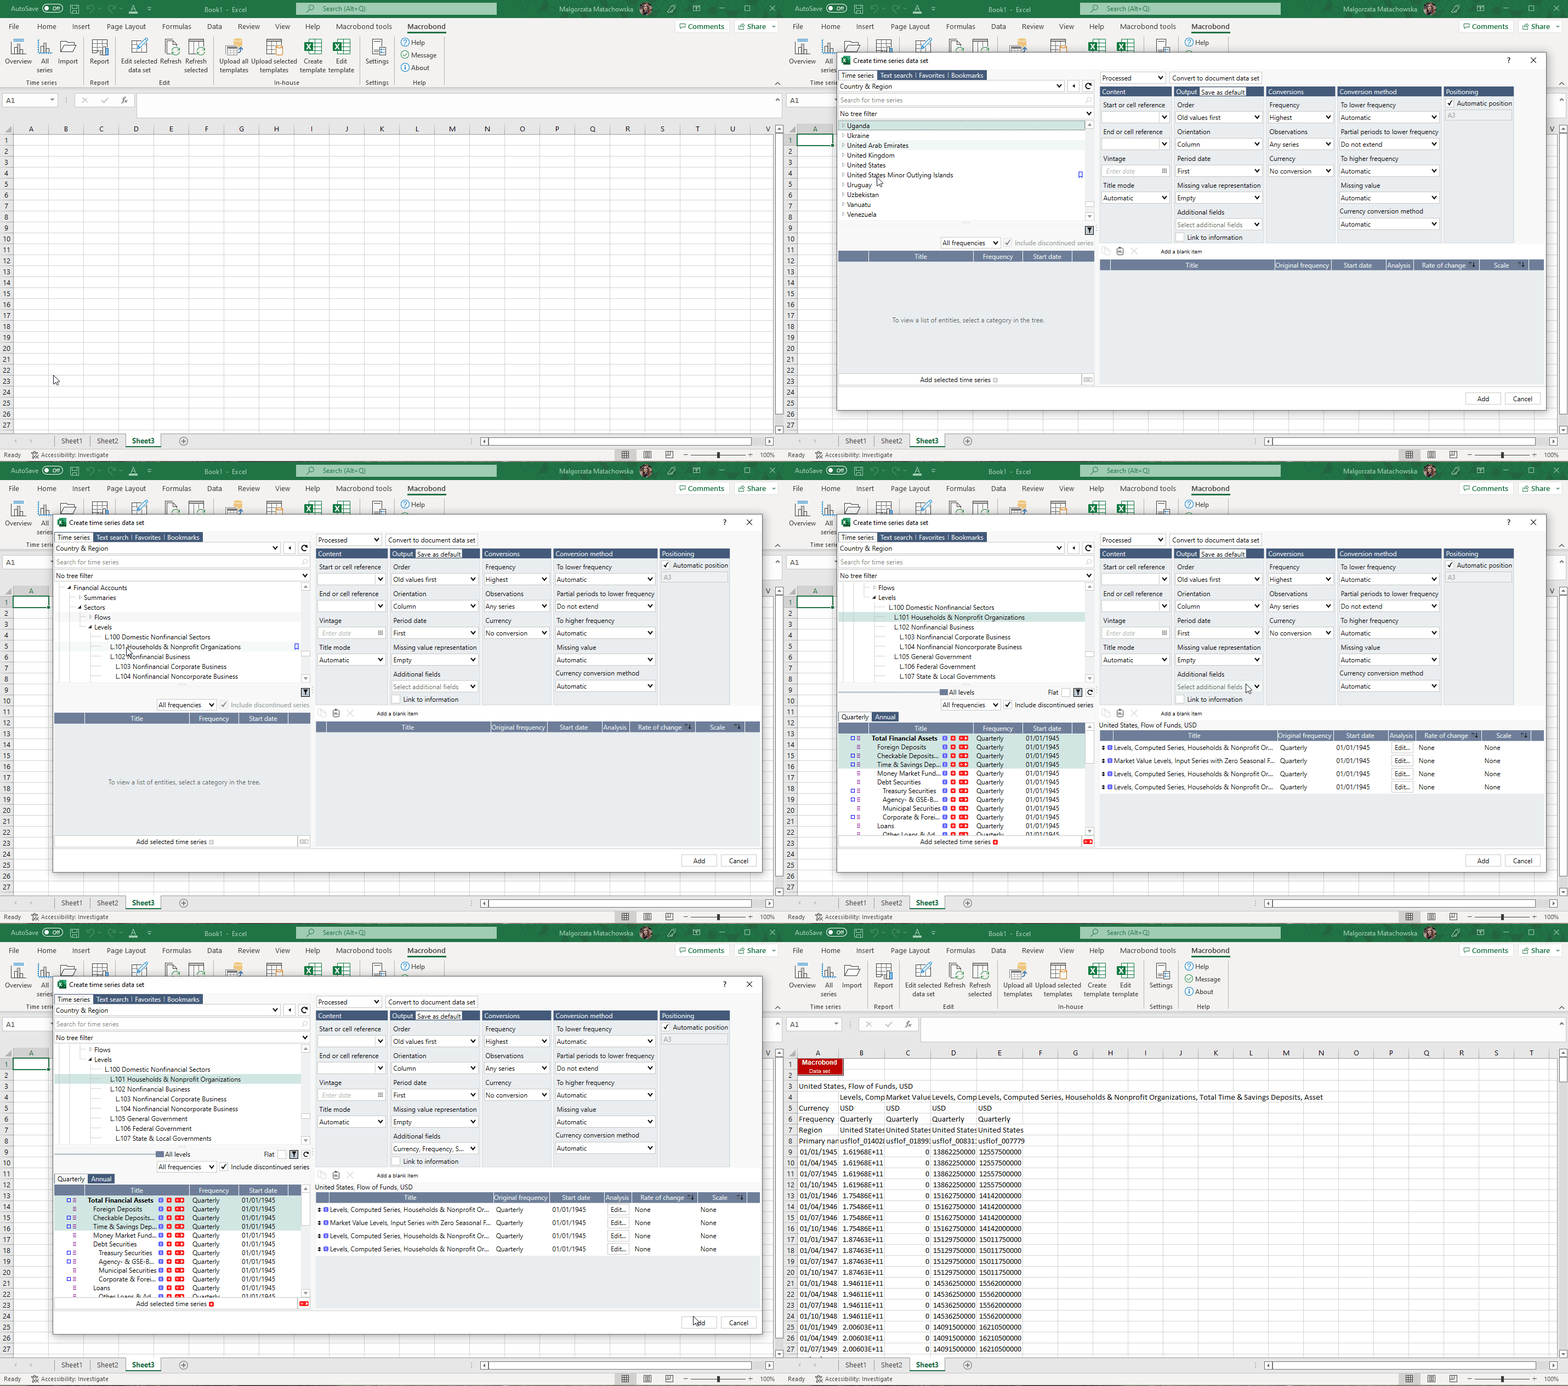
If you’re working in Excel and would like to download data directly, you’ll use the Overview or All series buttons under the Macrobond tab.
You can either select from a list of key indicators or from all the data in the application. As a quick example let’s look into Flow of Funds data for the US. This gives you the option of going through all the different categories to select what you’d like to download. Once downloaded the data will be organized in the same way as it is presented when selecting it. You can also view series metadata.

Copy as Excel data set from Macrobond
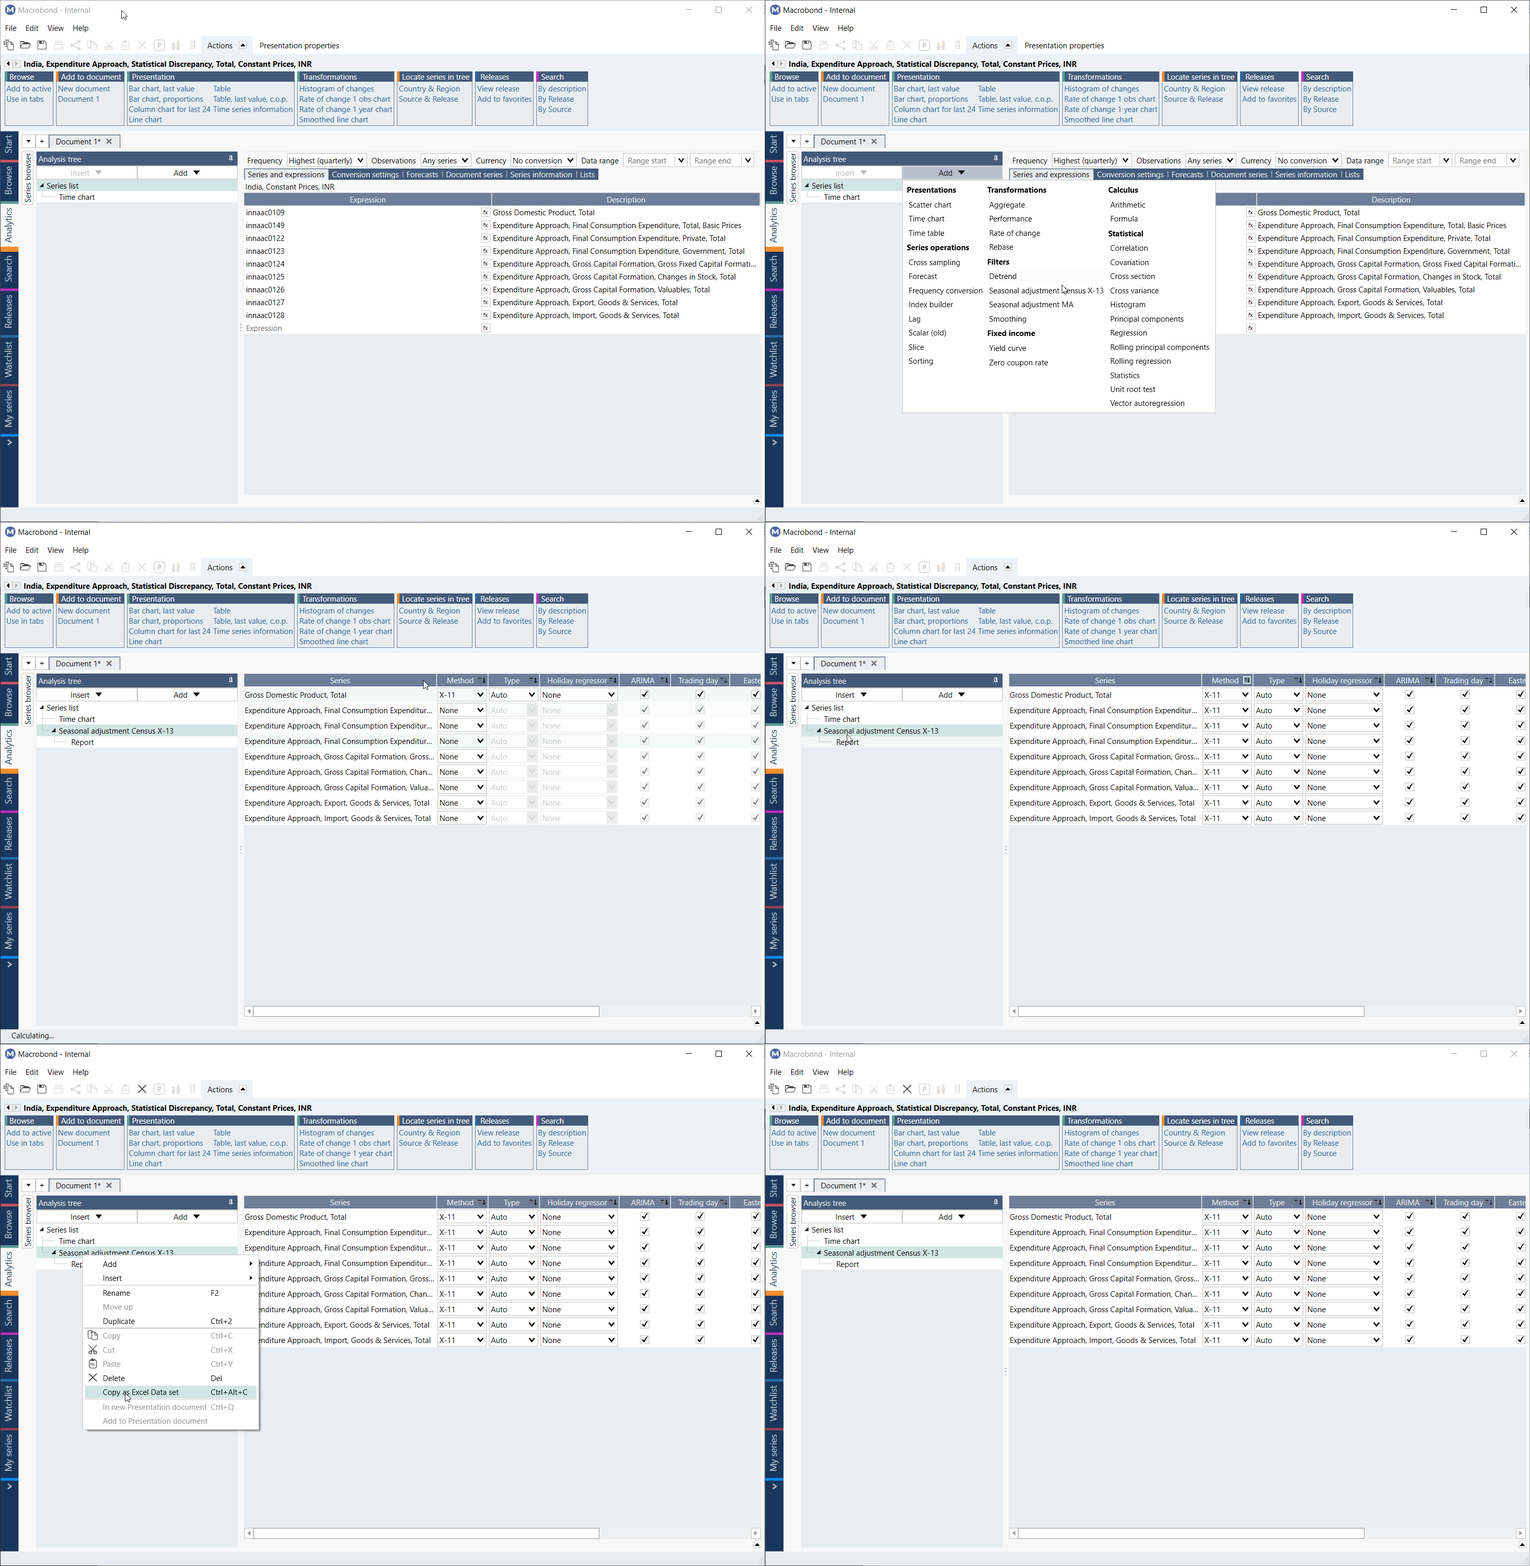
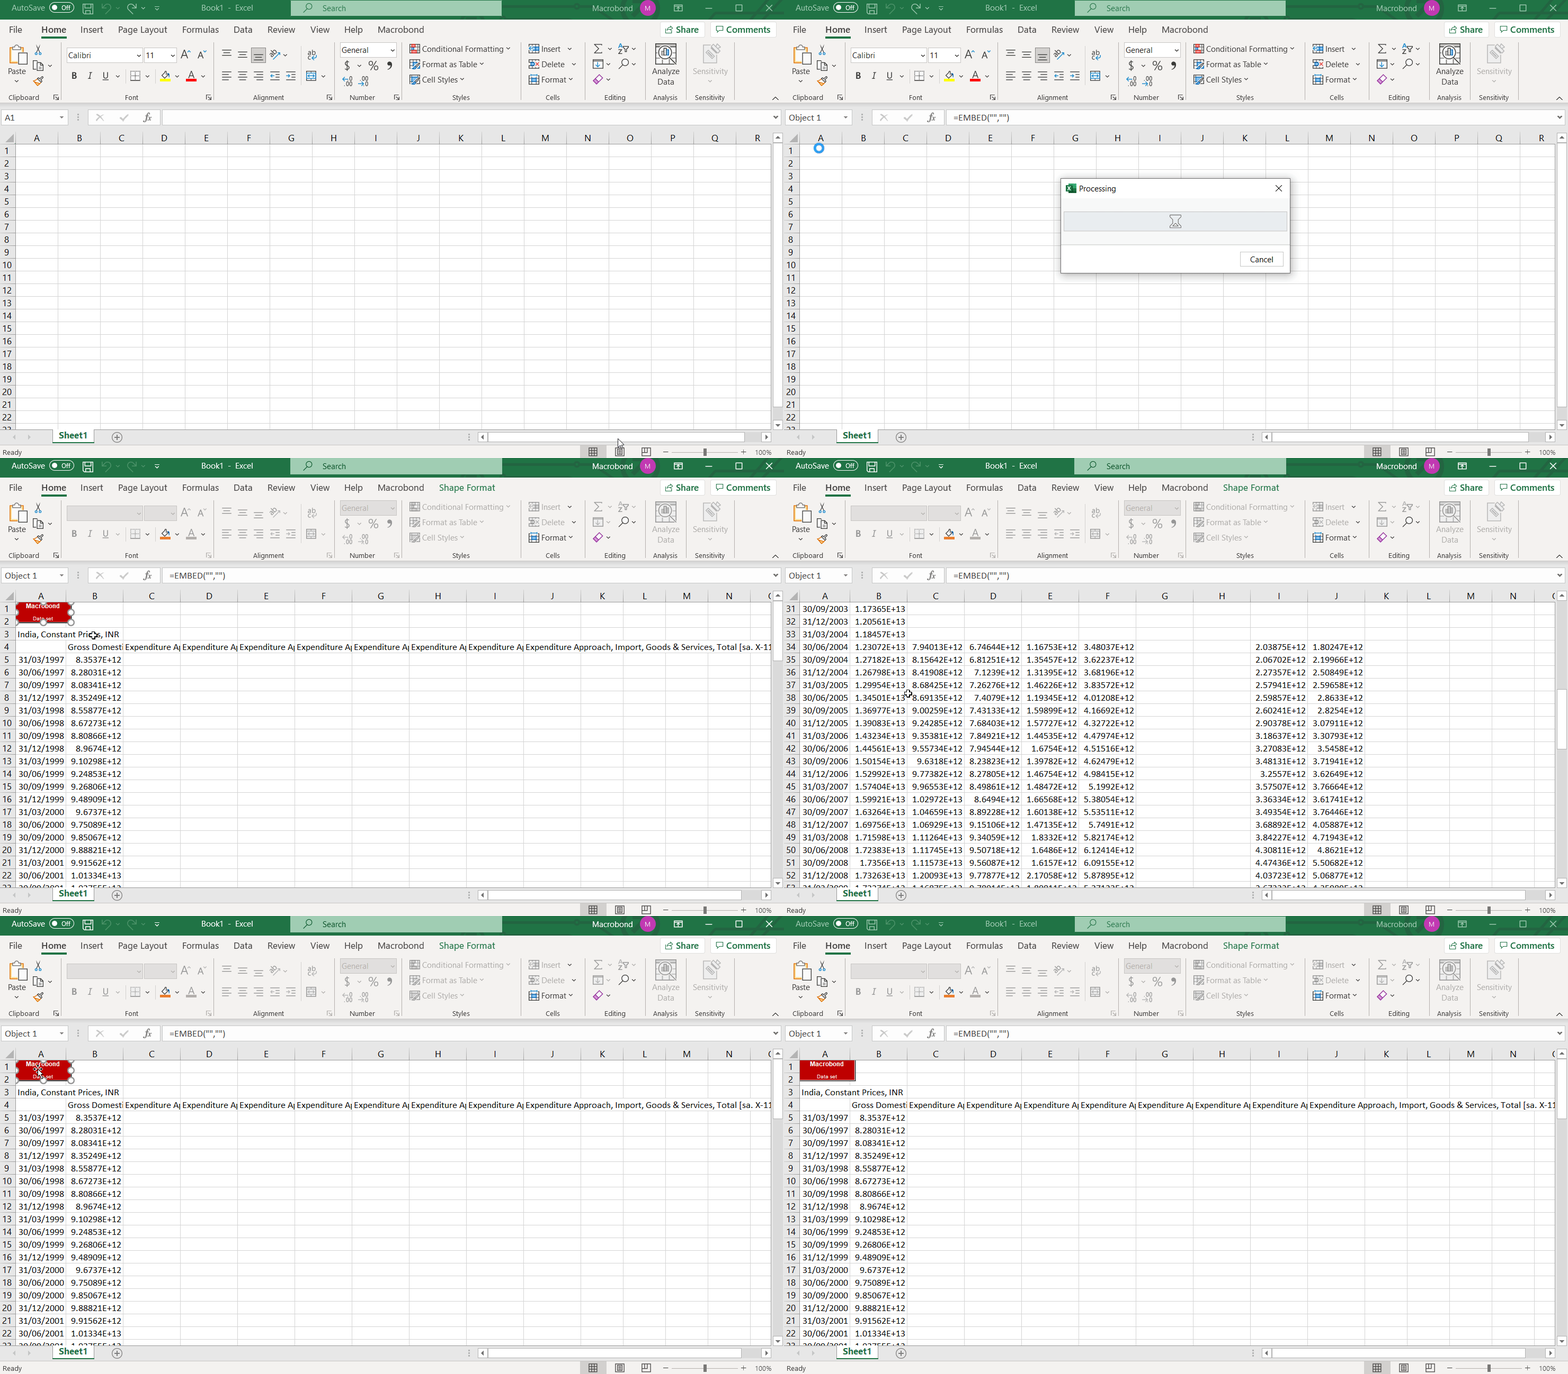
Let’s say you’d like to apply more advanced calculations to the data, then 'Copy as Excel Data set' is a good method to use. It is typically much simpler to apply certain analyses in the application than it would be to use an Excel formula to do so. To demonstrate, let’s look into the National Accounts data for India. These time series are not seasonally adjusted so, after finding the data, you’d perform the analysis in Macrobond and then simply copy the analyzed data by right clicking on analysis and choosing 'Copy as Excel Data set'. After this you can paste it into Excel by pressing Ctrl+V.

This will create red block in Excel, which is called the Data set object. It contains all the information about the downloaded data set. It also acts as a reference for where the data is located in the sheet. So, don’t delete it. If you’d like to move or make changes to the data set object have a look at Working with All series mode article.

Updating data sets in Excel
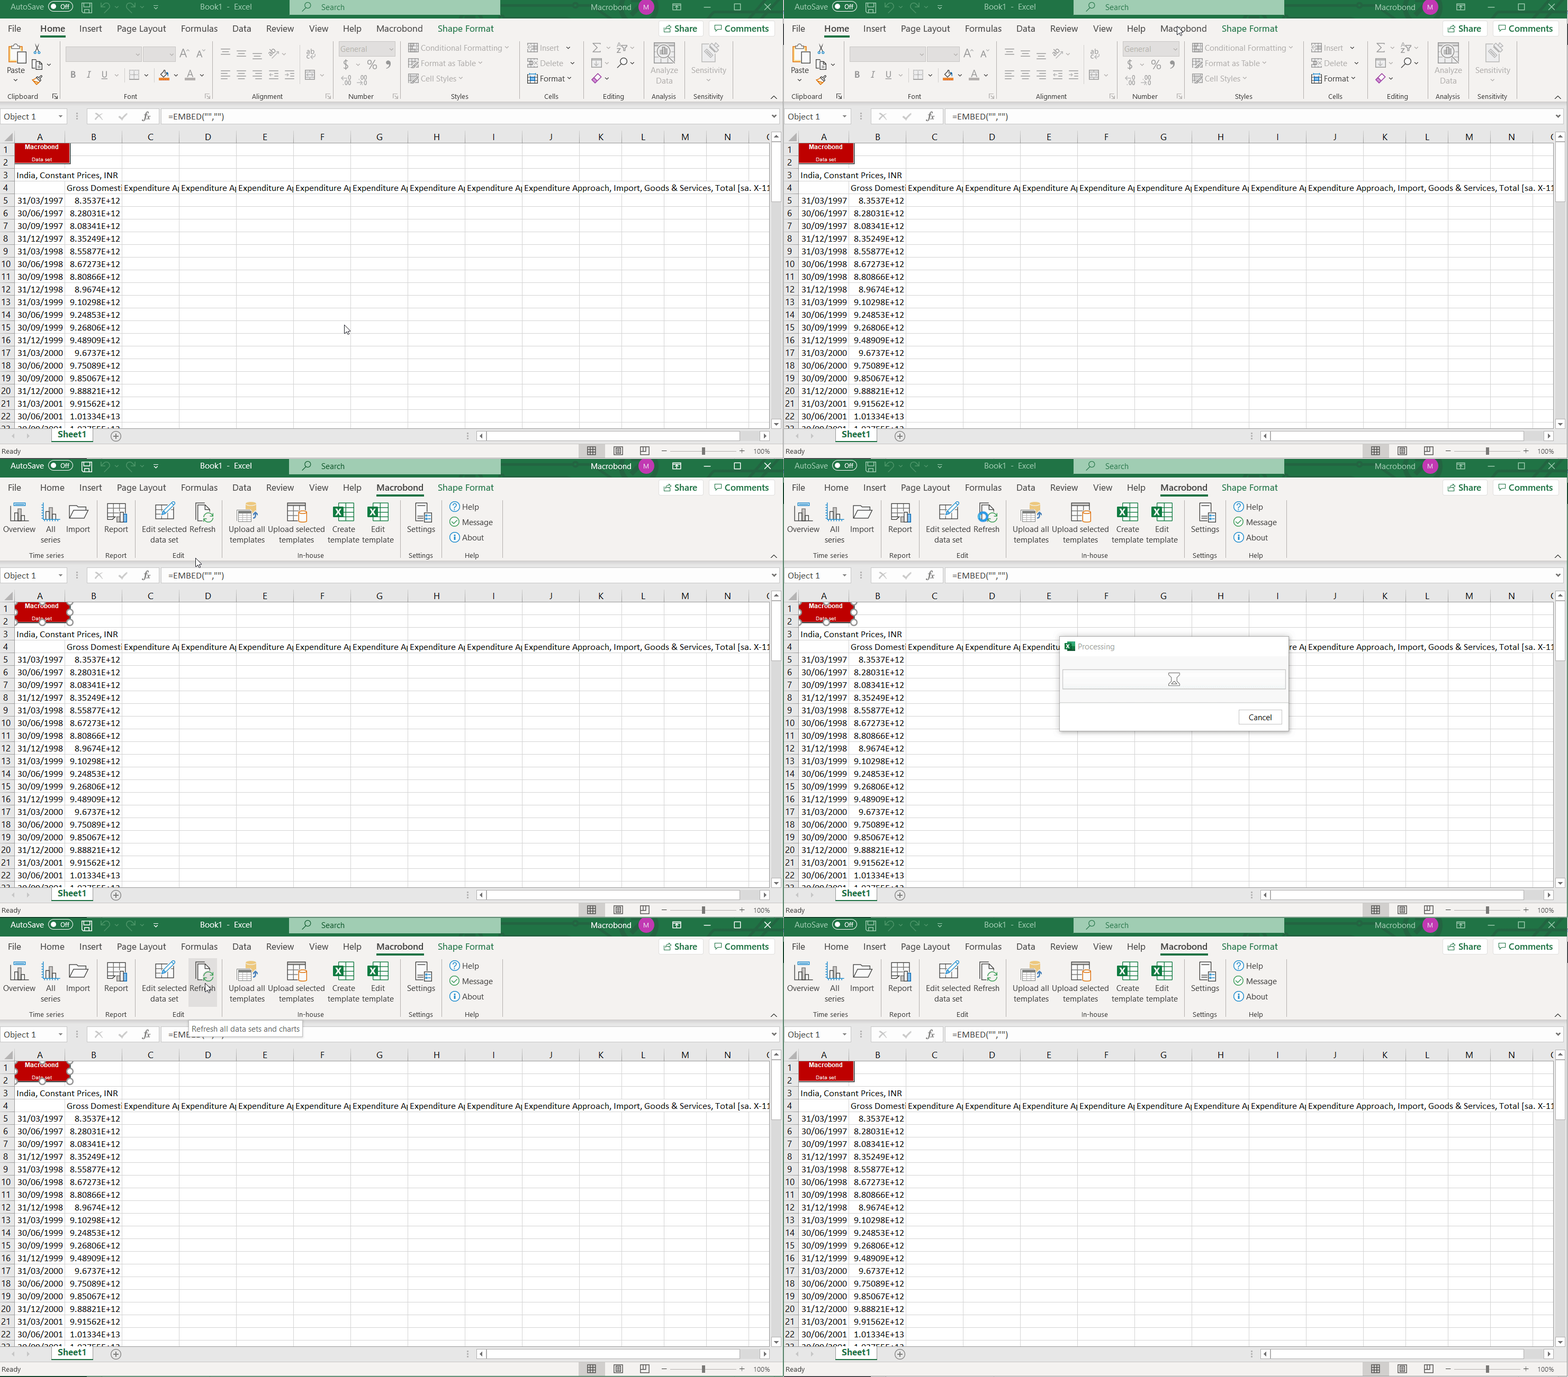
If you want to update the downloaded data sets to reflect the latest data release, click on Refresh. Charts are also automatically updated using the same mechanism.
