This feature is available in Macrobond Analysis 1.33 and later. For Macrobond Analysis 1.32 version please see here.
- Overview
- Interactive variables
- Creating an interactive variable
- Using an interactive variable
- Deleting interactive variable
- How to build a chart with interactive feature - walkthrough
- Examples
Overview
This feature is available in Macrobond Analysis 1.33 and later. For Macrobond Analysis 1.32 version please see here.
This feature allows you to replace various variables inside Macrobond document with interactive ones. Those variables can be then activated on the chart under the 'Variables' tab, unlocking new possibilities of showing data.
This feature is designed to work the best with our new product – Macrobond Amplify. It's an online platform for sharing interactive research. For more information about it, see Macrobond Amplify page.
Interactive variables
Variables tab
On the Series list you will find a new tab - Variables - which is a command center for interactive variables. From here you can add, delete, and manage variables being used in the document.

Types of variables
All available interactive variables can be found under All types drop down menu:
- Boolean
- Date
- Date and Time
- Decimal
- Integer
- List (since MB 1.33)
- Point in time
- Rate of change method
- Statistics calculation method (since MB 1.33)

Creating an interactive variable
From Variables tab
To add new variable, select one of the variable types from under ‘All types’ drop down (or press button next to it). You can then assign such a variable to a selected field.
From field
You can create interactive variable from various fields inside the application. Press open arrow next to the field and select ‘Create a new variable...' . Note that you will be able to create only that type of variable which will work in that field.
Variable will automatically appear in Variables tab where you can manage it. 
Using an interactive variable
Assigning variable
Press open arrow next to the field and select the variable. When the interactive variable is assigned to the field the open arrow becomes full arrow: ![]()
Interactive properties tab
Go to the chart, see tab Interactive properties. You may select variable(s) which you want to use on this chart. 
Slider
You can create slider controlling your variable. To activate it, go to Series list > Variables tab. Click Edit button next to your variable. Tick Constrain and select frequency (for example, document frequency) and dates/values which will be Min and Max limit of a slider. 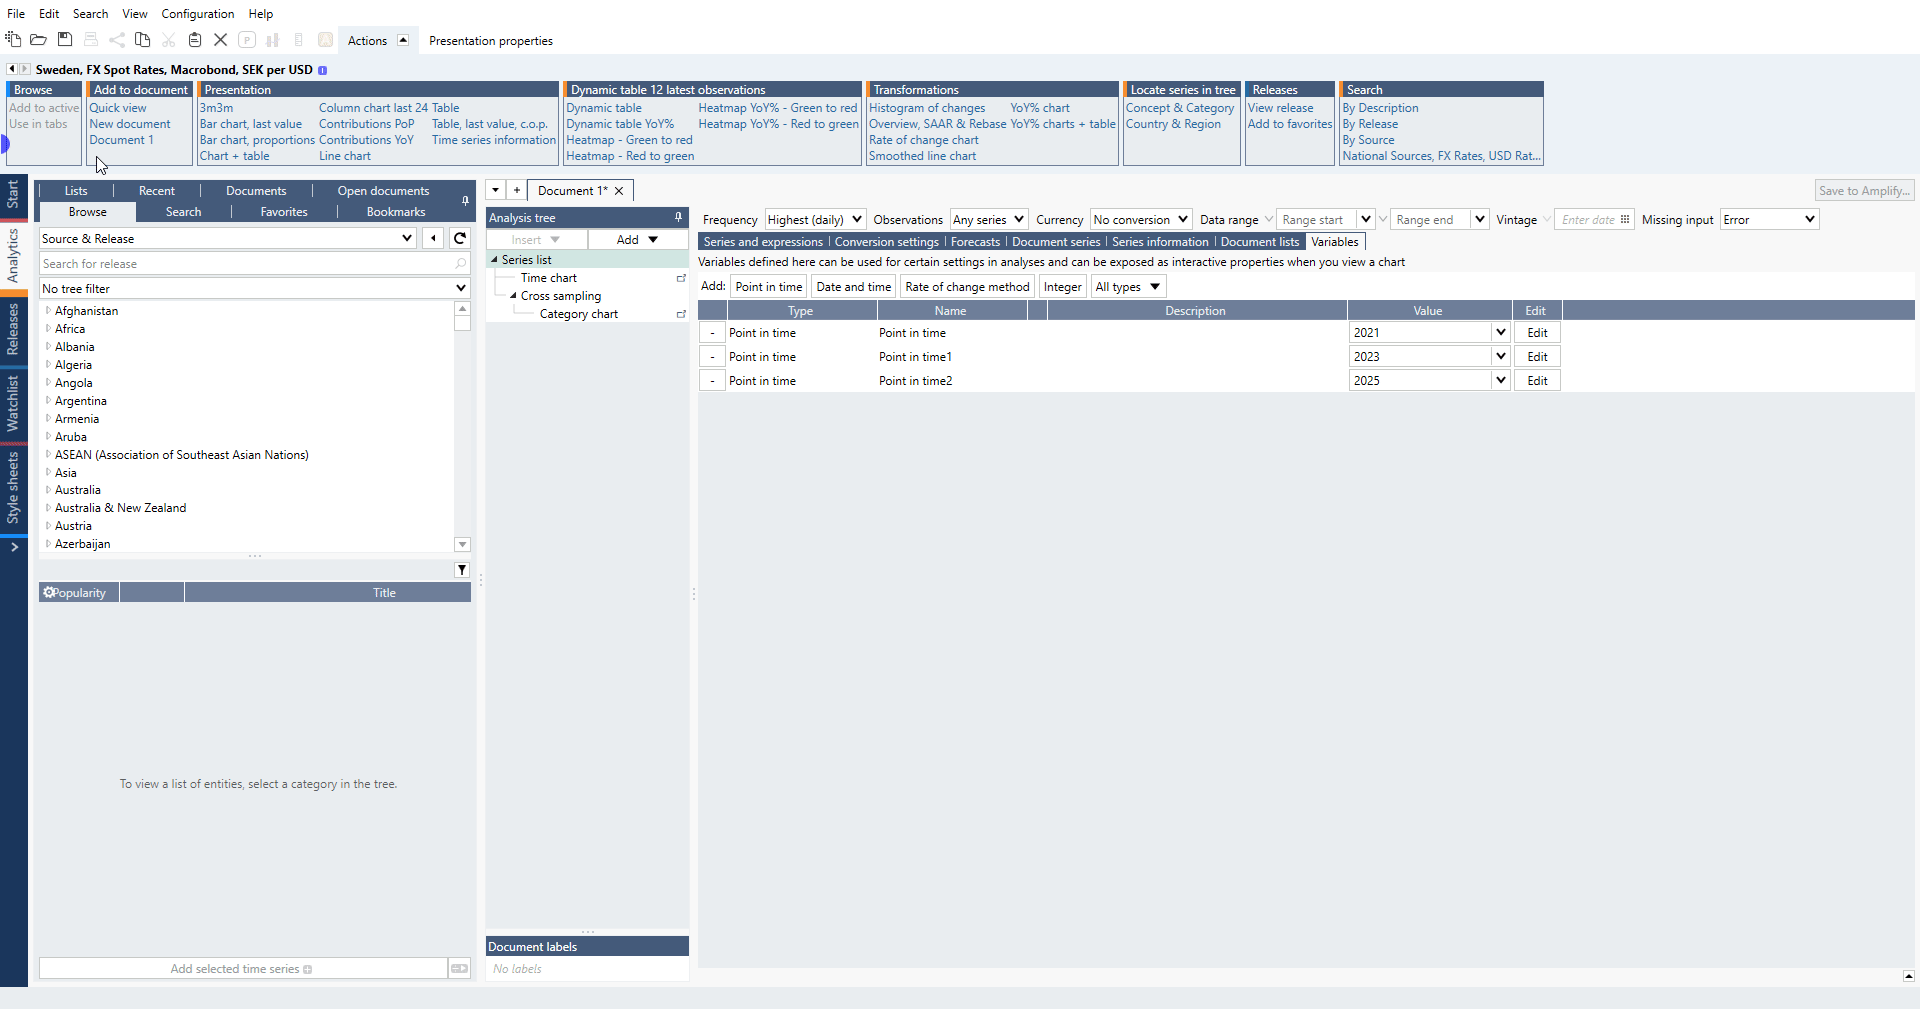
Changing value/date
You can control Interactive variable from one of the below places:
- in Interactive properties tab if activated;
- in the Series list > Variables tab > Value field.
Changing one of them automatically changes value/date in another.
Changing value/date directly in the field where it was assigned will disable interactivity. The full arrow will change into open arrow: 
Deleting an interactive variable
Under Series list > Variables tab:
- right-click and select 'Delete';
- press ' - ' icon on the left side of variable

How to build a chart with interactive feature - walkthrough
Point in time
See below an example:
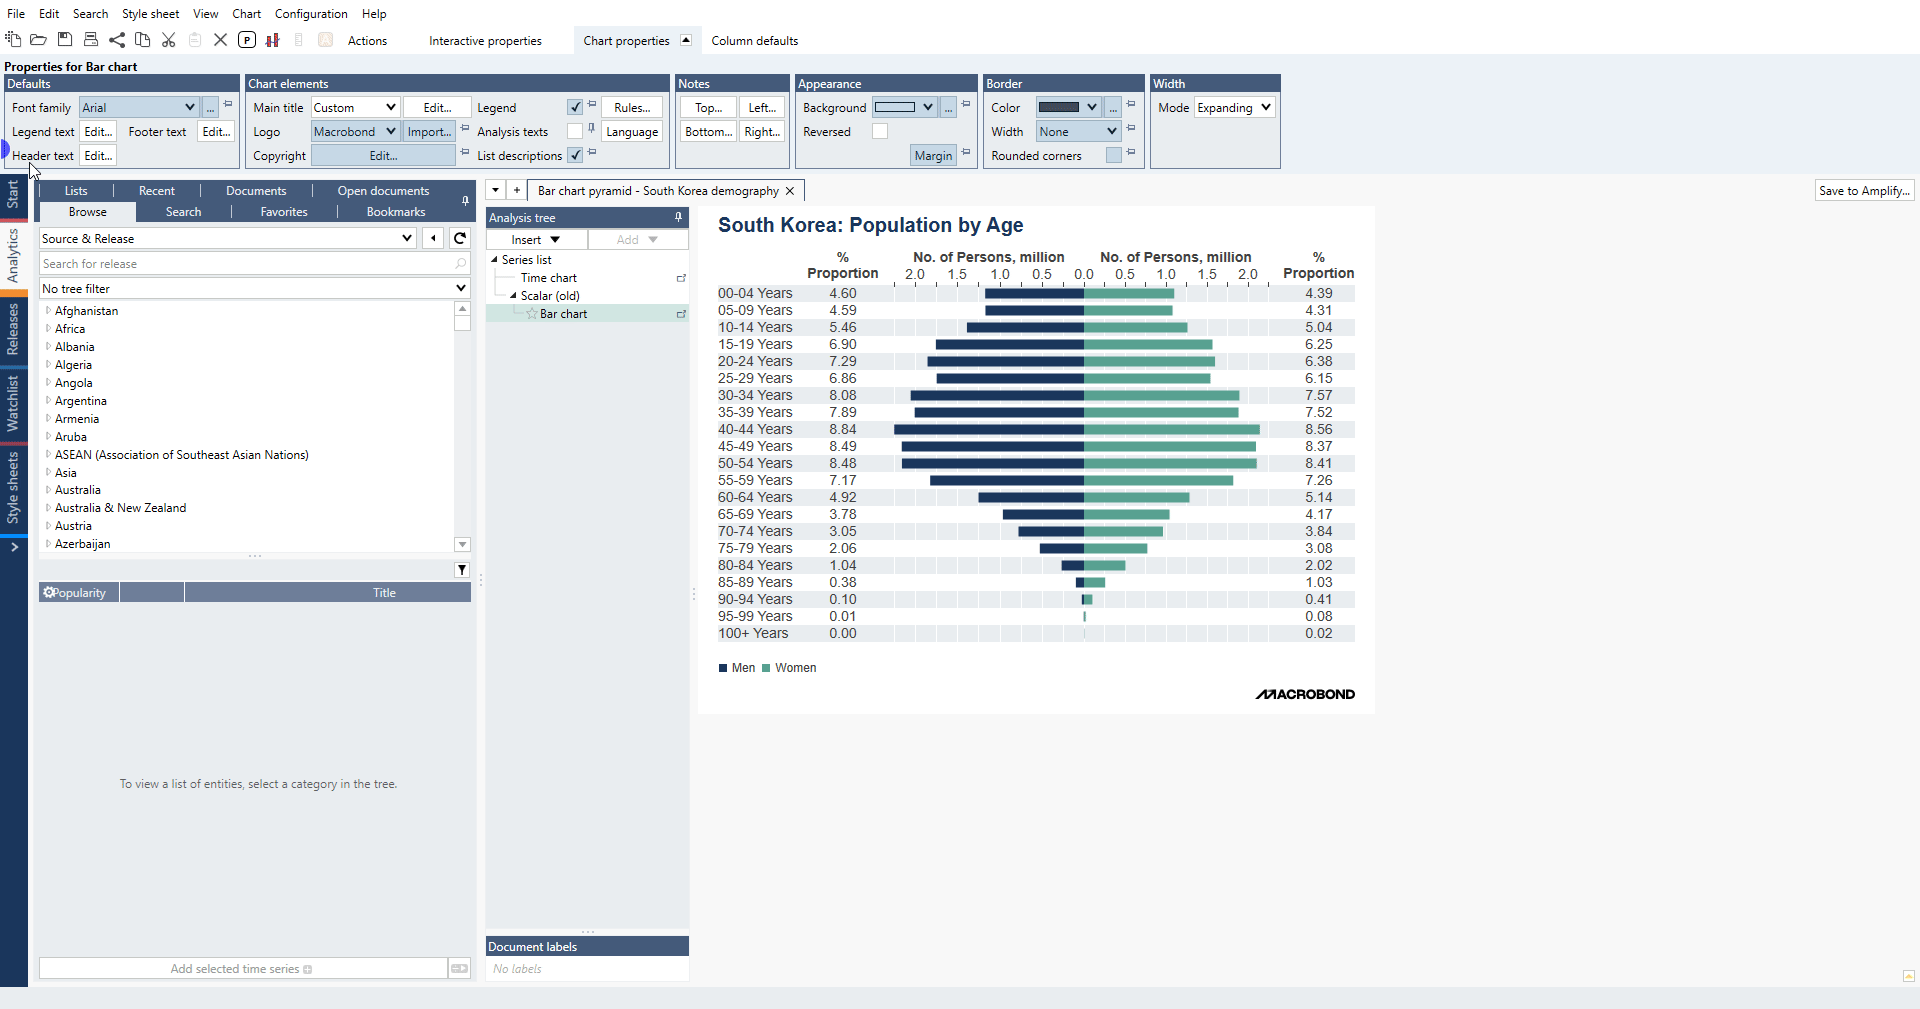
- Open the Macrobond chart from the Macrobond library: Macrobond chart library : 3. Feature Examples/Chart Types/Bar Charts/Bar chart pyramid - South Korea demography
- In the Calculations section, next to Value at, click the grey arrow.
- Select ‘+ Create new variable’.
- Enable the Constrain option and set the range to Min: 1950 and Max: 2025.
- Click OK to confirm.
- Next to Percentage in the Calculations section, click the grey arrow and apply the previously created Point in Time variable.
- Go to the Bar chart view. In the Actions ribbon, open the Interactive properties panel and enable Point in Time.
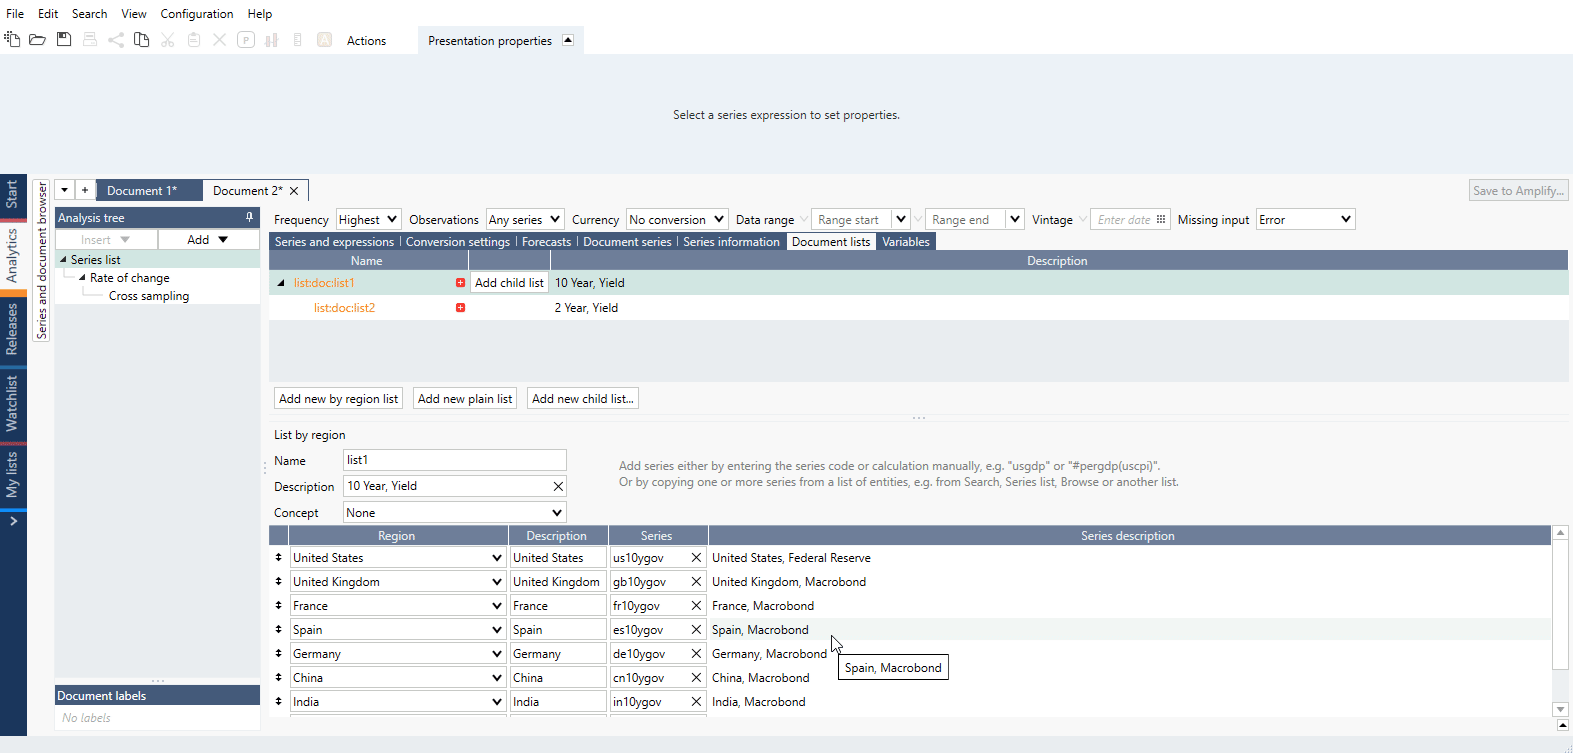
List
- Create two lists – one as a child of another
- Go to variables tab and select 'All types' – select 'List'.
- Under 'Constraint'” click on 'Add', then choose lists from Document lists.
- Repeat the process for second list and click 'OK'.
- Add the list using red '+' button.
- After that, you can tick the list variable under Interactive properties and use the functionality.
Examples
Interactive variable used on our standard chart Bar chart dashboard - Currencies.
Bar chart with Rate of change method and length controlled dynamically.
Bubble chart with Interactive variable's time slider.
Interactive variable used on our standard chart Bar chart HeatMap pictograms.
Interactive variable used on our standard chart Bar chart HeatMap ranking.
Interactive variable used in Statistics analysis on our standard chart Mean and standard deviations.
Using interactive variable, we narrow the date range and changing starting point for calculating performance.
Interactive variable used on our standard chart Bar chart mini pie - Population in South America to see changes in ranking throughout time.
Interactive variable used with vintage data. Note that you need to have Data+/Professional/Enterprise license.
Interactive variable used on our standard chart Bar chart pyramid - South Korea demography.
Interactive variables control std dev band around smoothed series.
Interactive variables lets you switch between two lists of series.