For elements not mentioned here see Elements of the chart.
Overview
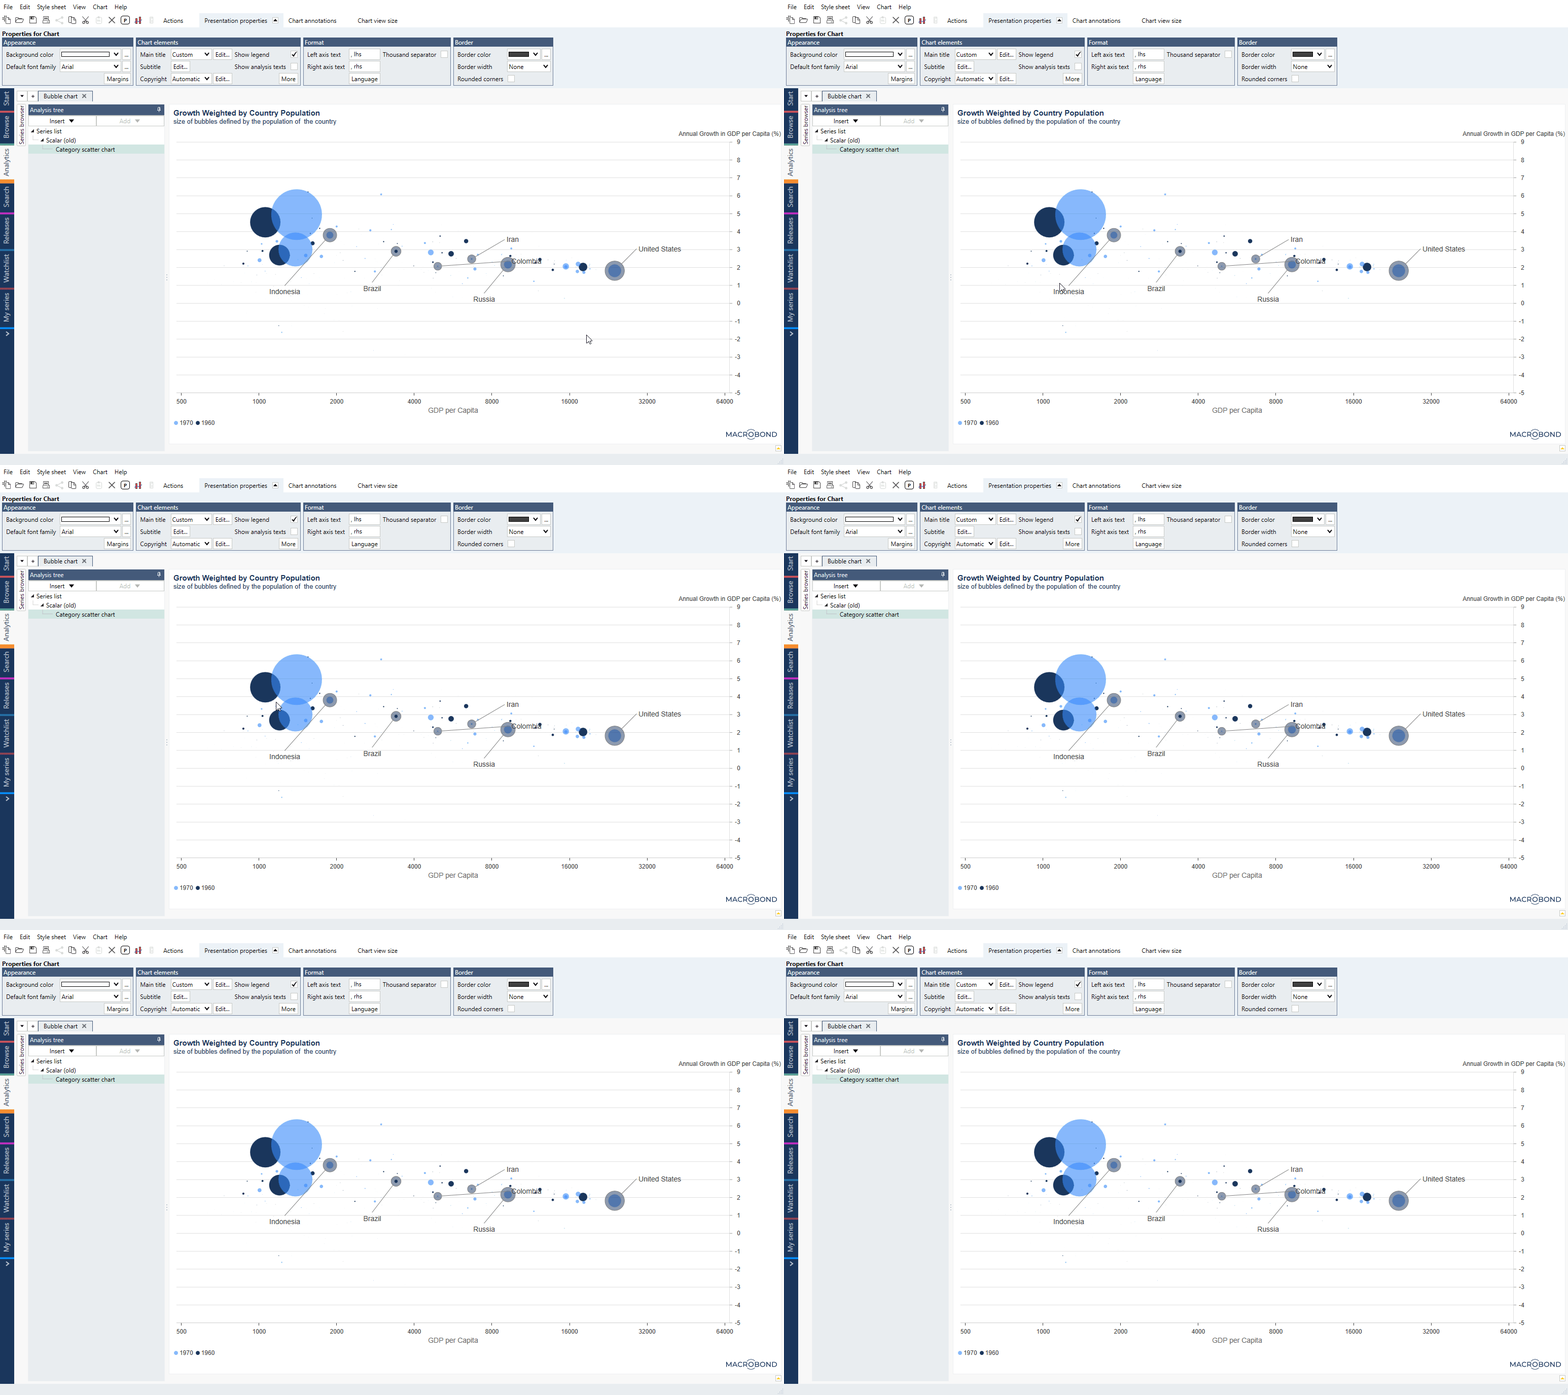
Bubble chart is graph type which displays three dimensions of data. It can be considered as variation of scatter chart where data points are replaced with bubbles.
What this type of chart needs?
This graph type needs three series, as the 1st series in the list is applied to the X-axis, the 2nd to the Y-axis and the 3rd series will be used to define the size of the bubbles.
Settings
Size of bubble
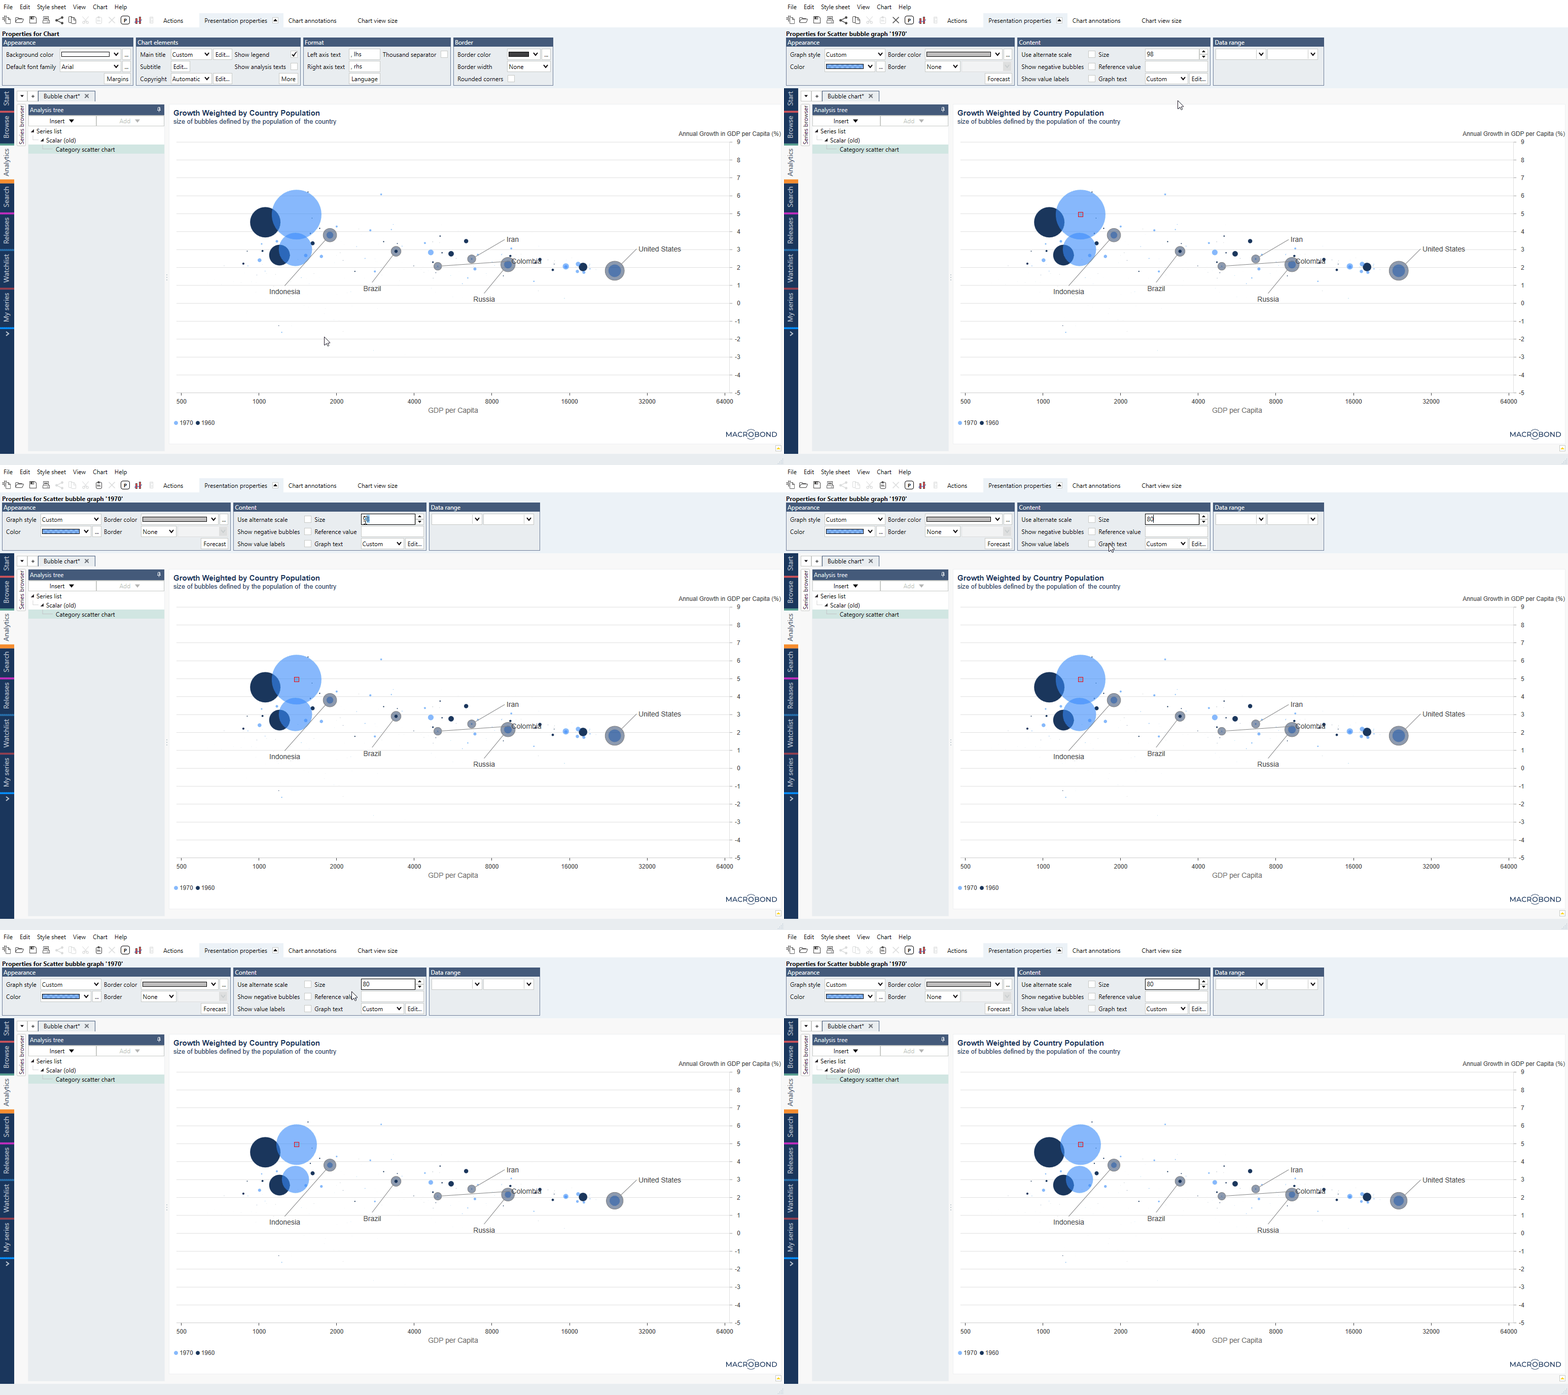
To adjust the size of the bubbles, click on one of them. You’ll find the size settings under the presentation properties tab, here. The value is given in pixels. This number will set the size of the biggest bubble (highest value in series), all others will be adjusted proportionally.
Reference value
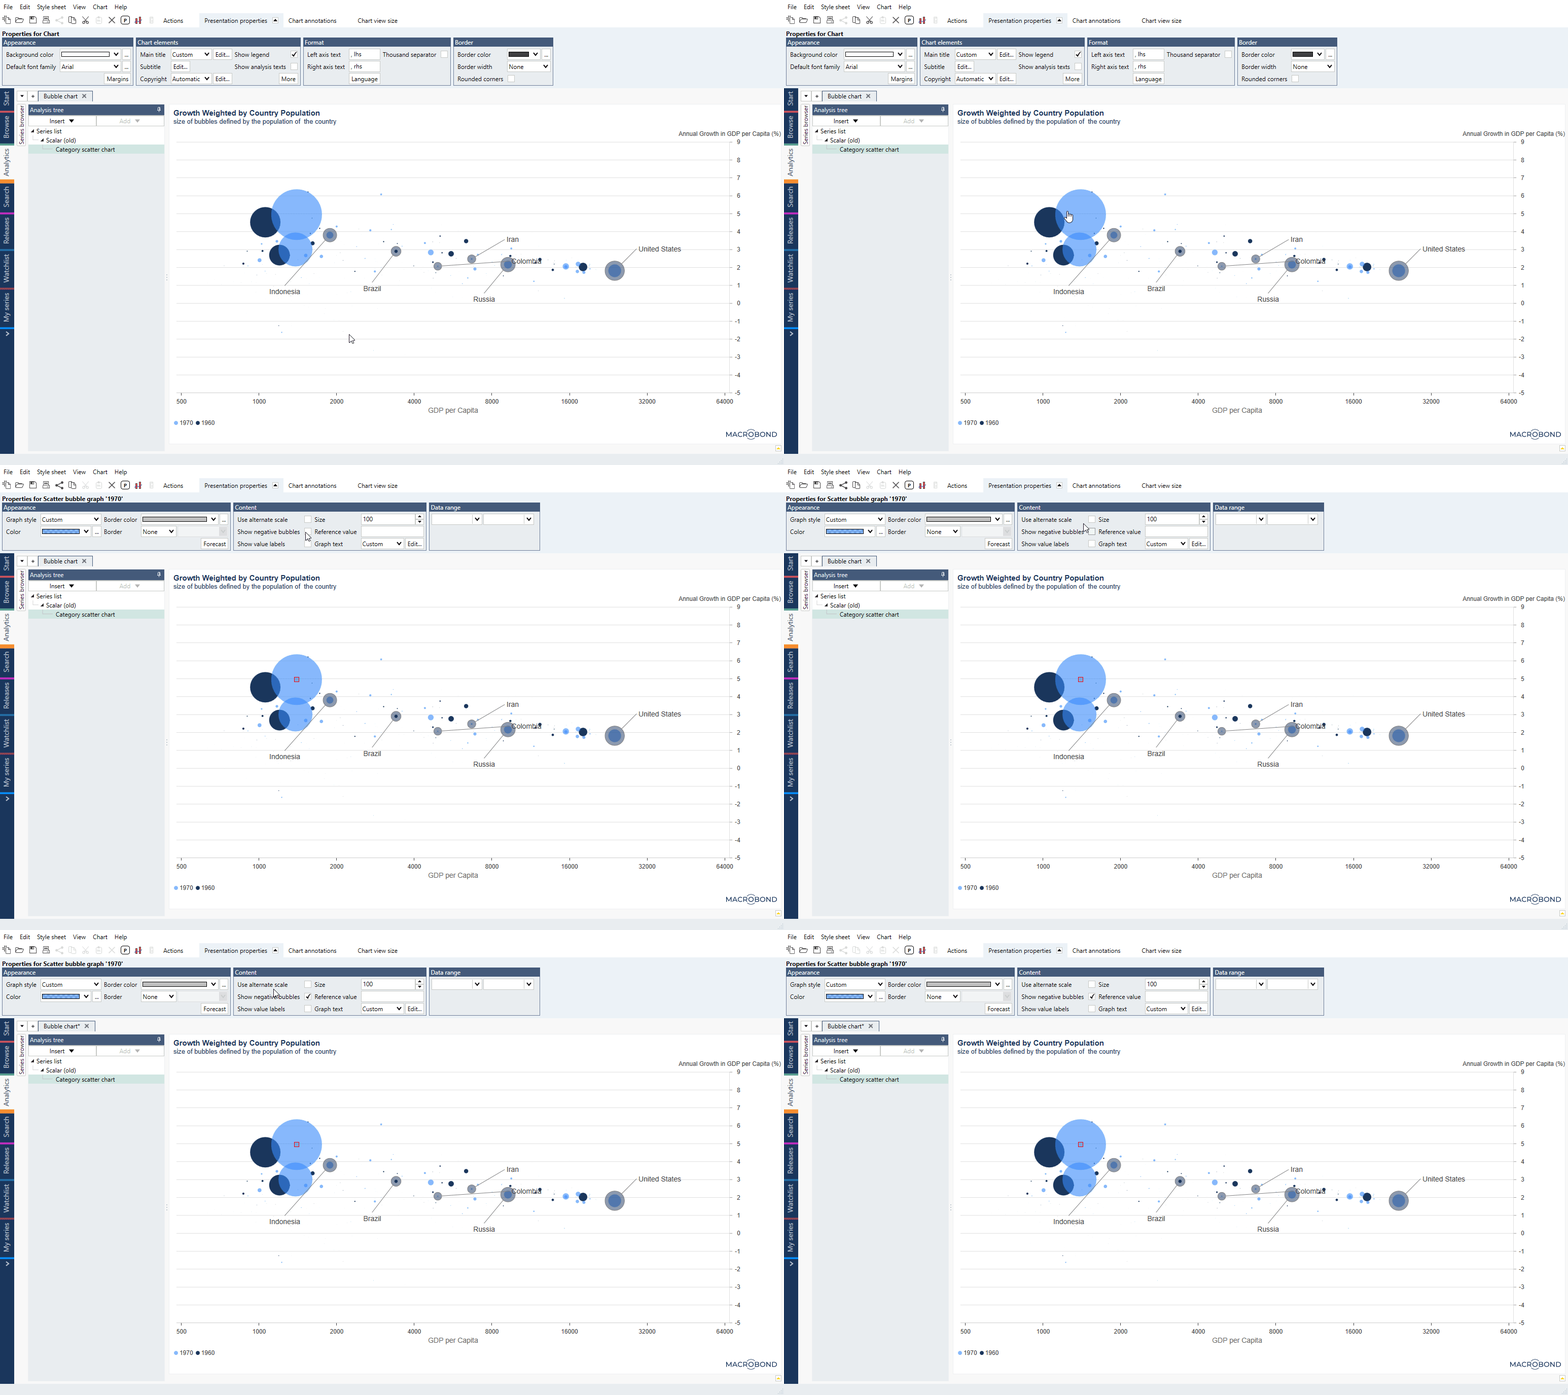
If this field is empty the 'Size' from field above it (representing bubble width in px) will be assigned to the largest value.
If you type in for example '50' the bubble will have width as stated in 'Size' when the value in series is '50', all others will be adjusted proportionally.
Negative values
By default, bubbles with negative values are not visualized. Simply mark the check box to include them. When negative bubbles are visualized the size of the bubble is defined by the absolute value of the series.
How Graph layout works?
Graph layout window allows to choose one of graph styles which differs depending on chart type. There are three ways to access Graph layout settings:
- by clicking on Graph layout icon
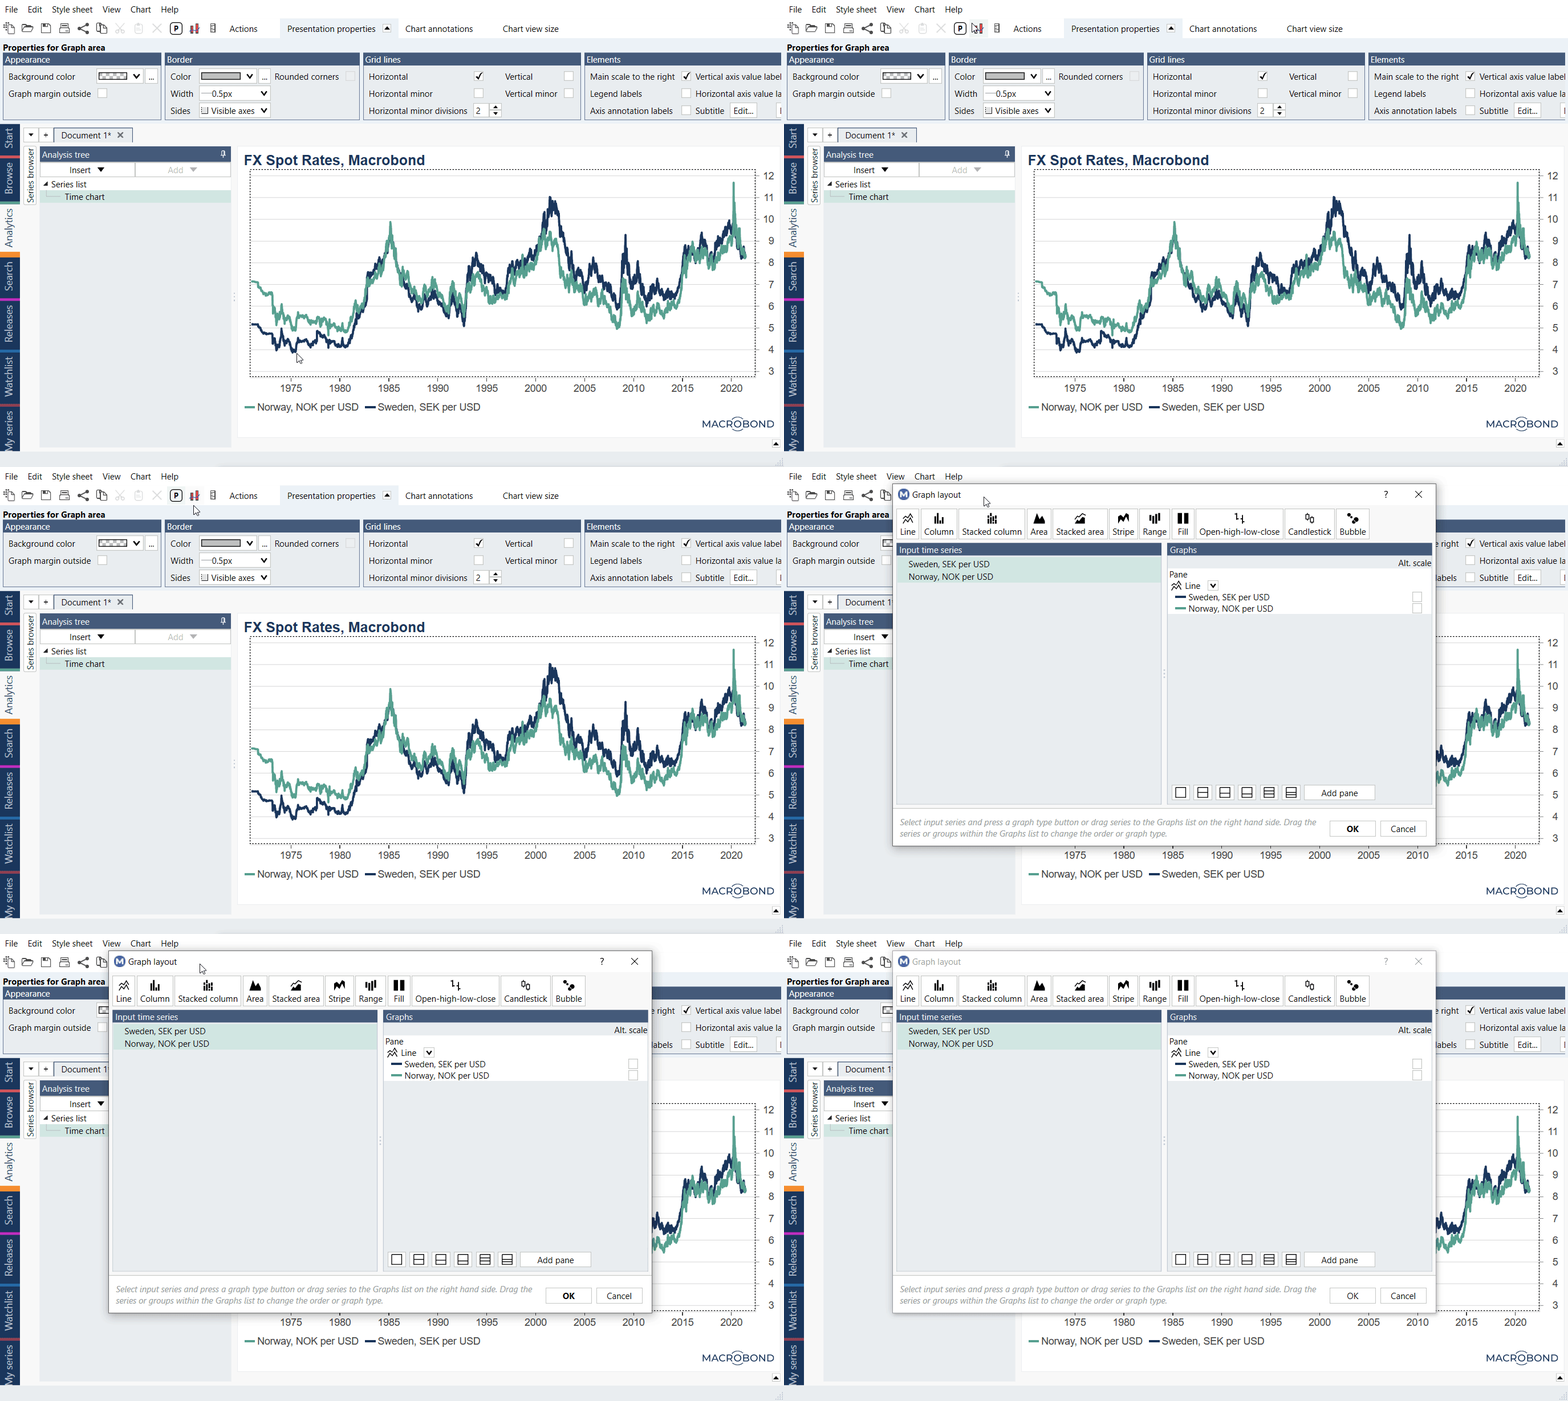
- by right clicking on the chart and selecting Graph layout option
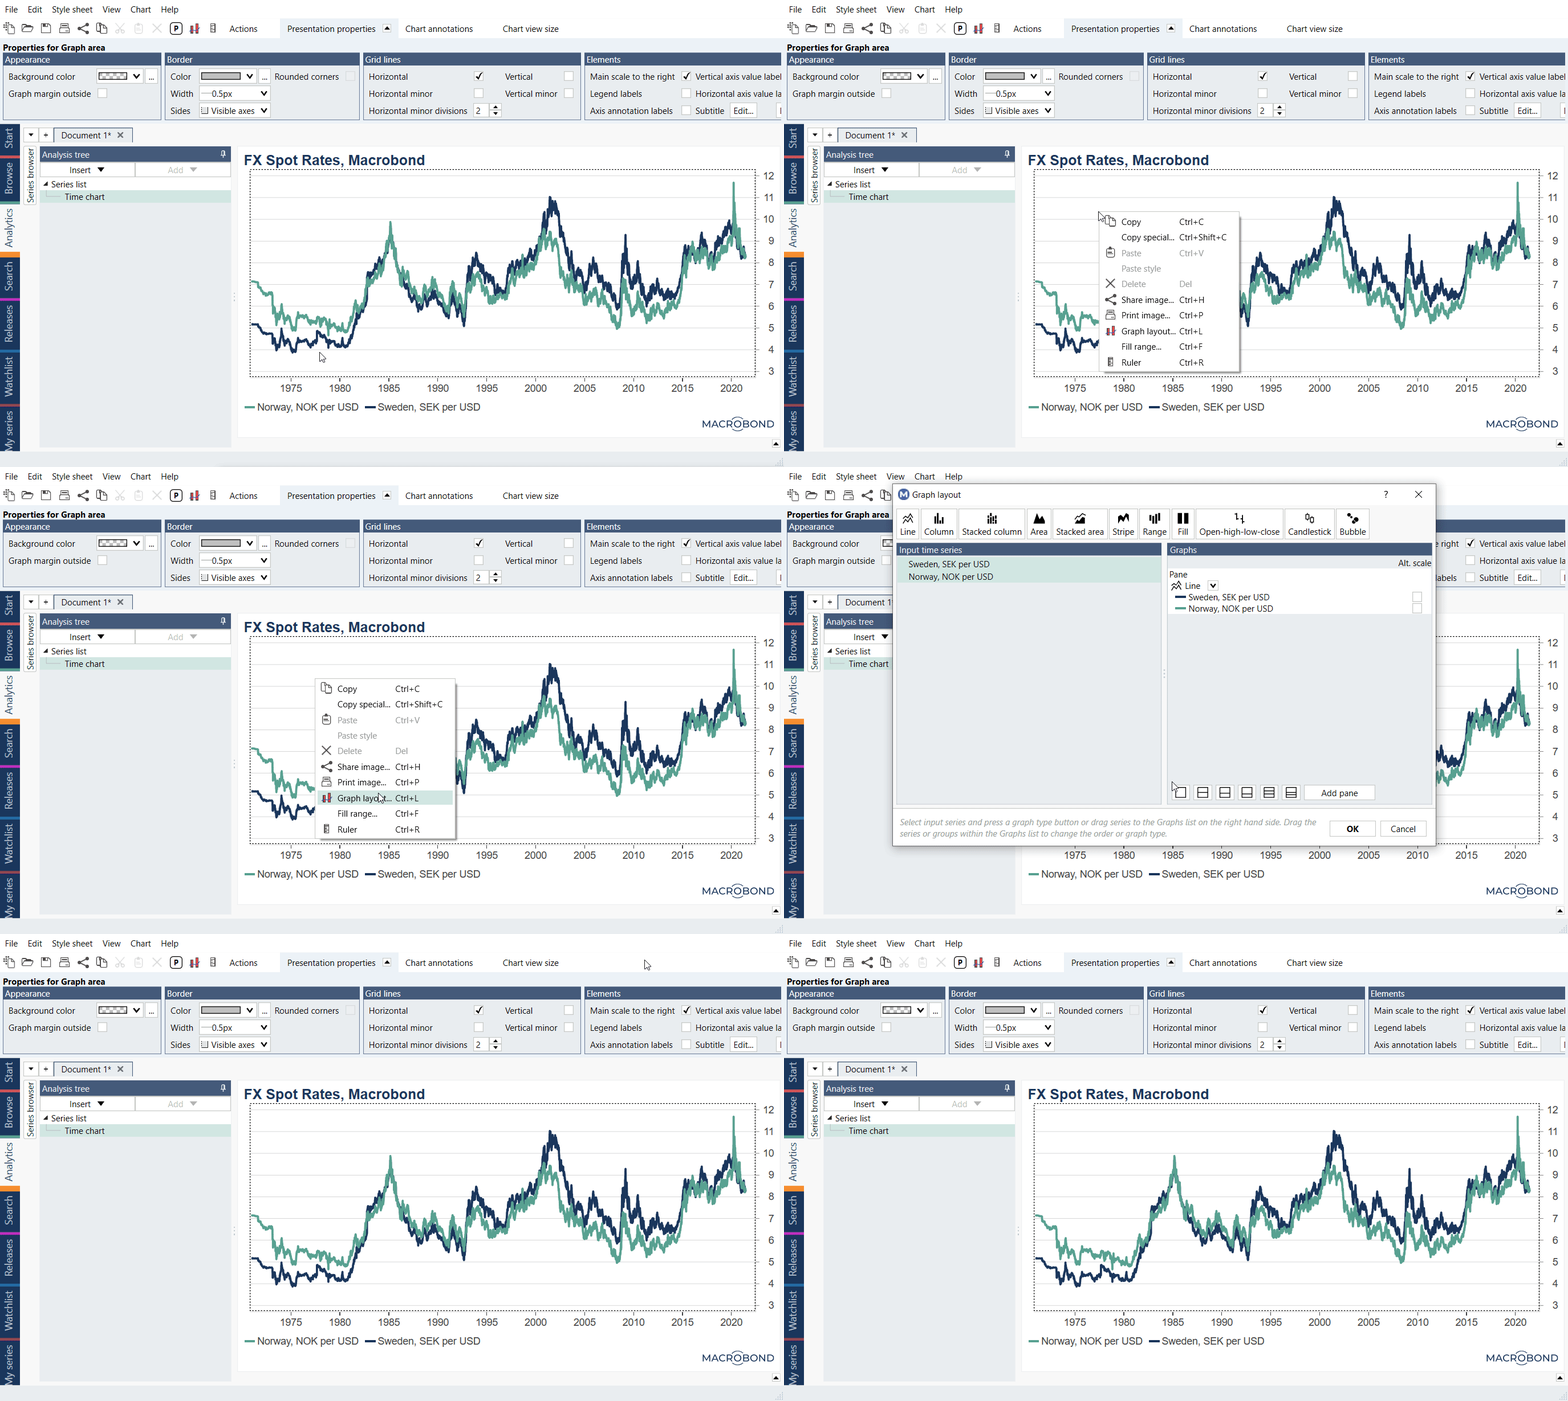
- by using the keyboard shortcut CTRL + L
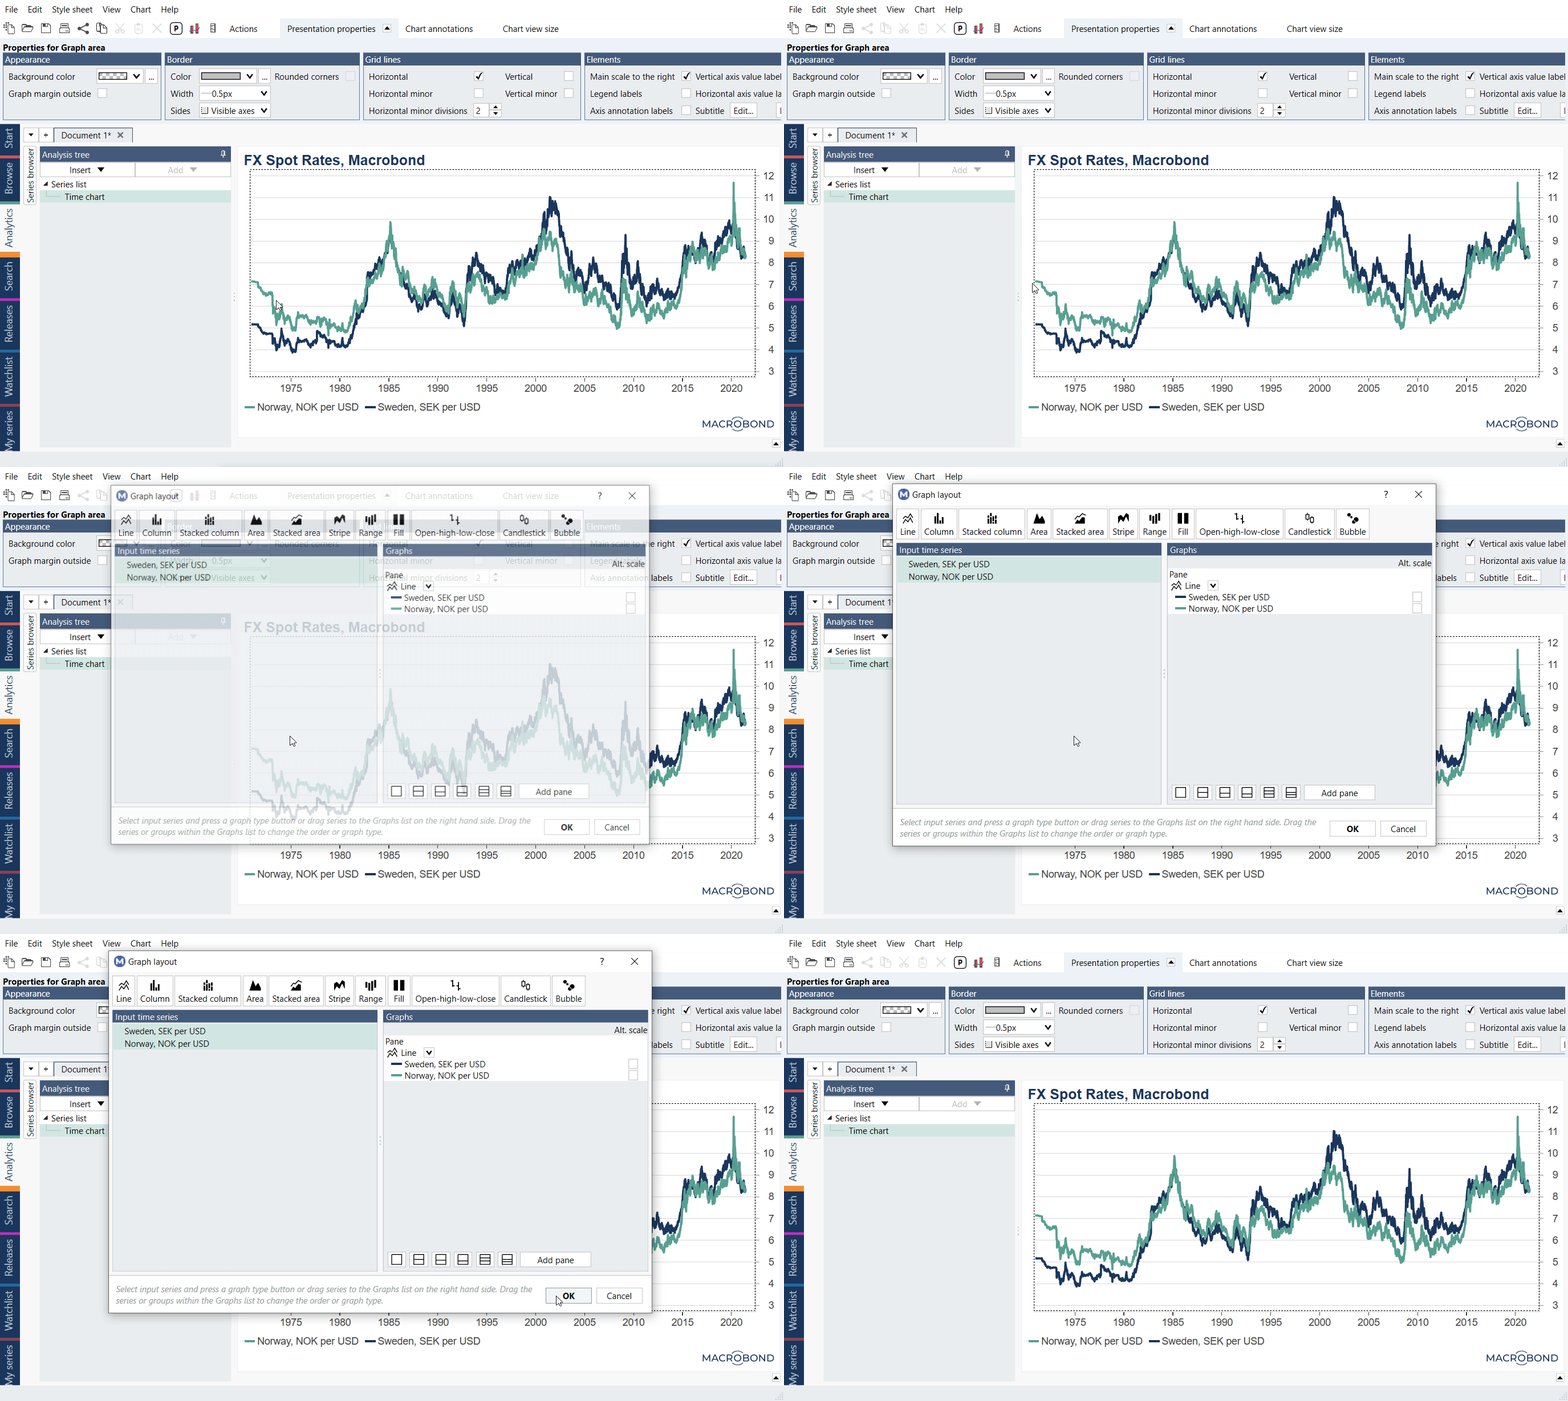
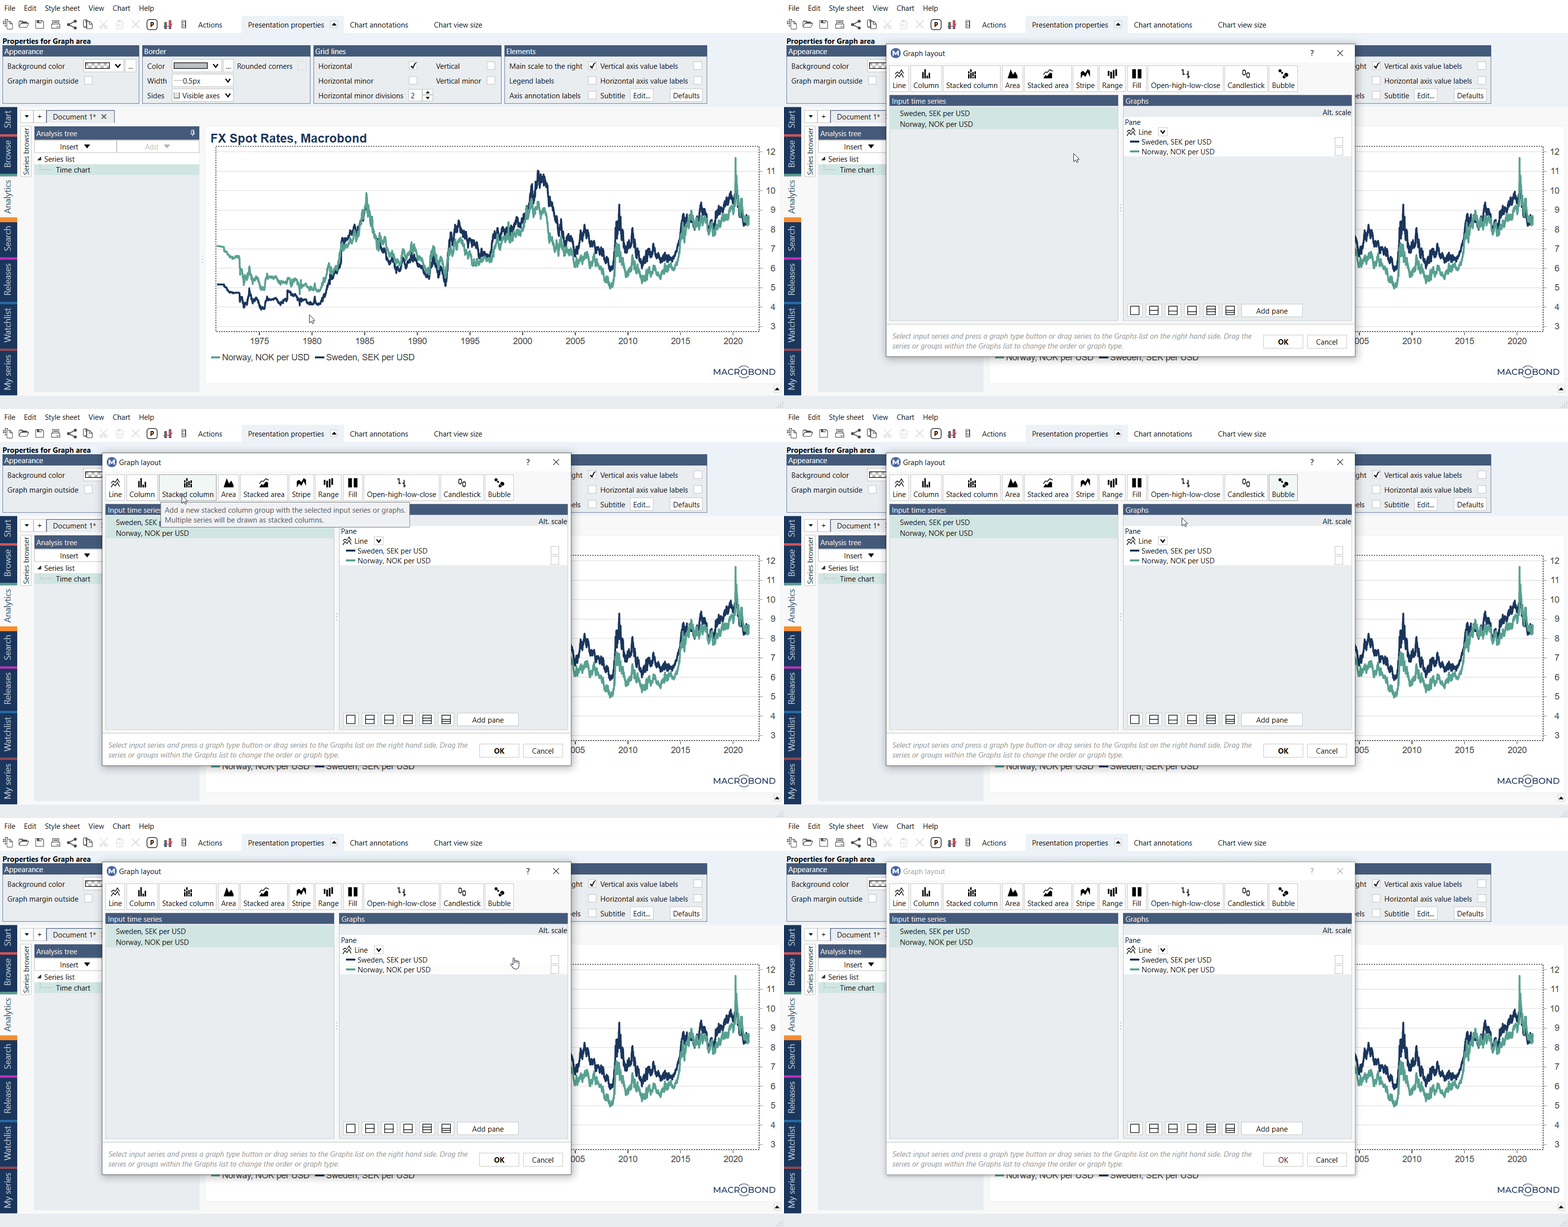
Here, you can define how the graph should be displayed as well as which series corresponds to which axis. On the right side of the window, the graphed pairs of series are displayed under a graph type. The first series of each pair is placed on the x-axis and the second one on the y-axis. Click and drag to move them if you want to switch the axes.
Examples
In this example we presented typical use of Bubble chart.
Bubbles can be also used as weights on Time chart.