Sometimes you want custom label on x-axis. You can this with a little workaround described below.

Add Vertical line
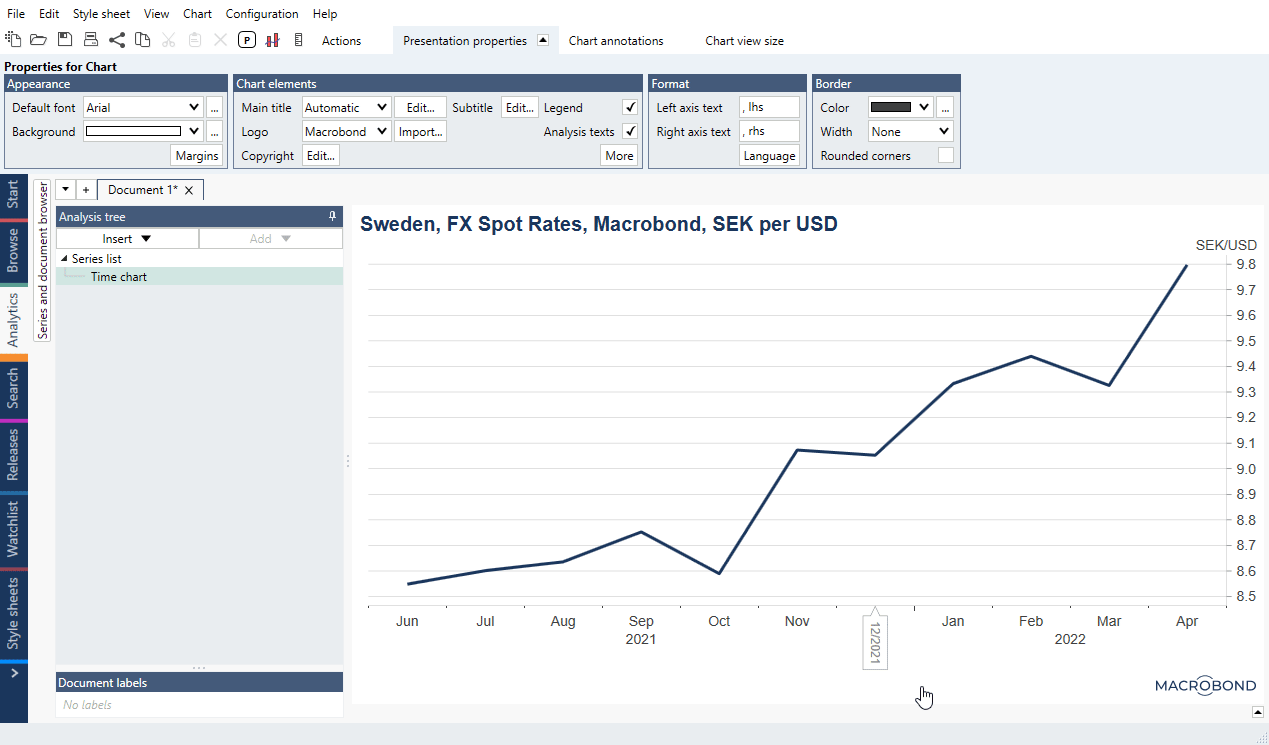
Go to Chart annotations > Annotations and add vertical line anywhere on the chart.

Modify the line
Click on this line and:
- Set Position (for Time chart - date, for Category chart - #0, #1, #2 etc.).
- Check Line > Between observations (since MB Analysis 1.31 it's 'Centered in interval').
- Select Content > Axis value label: 'Show'.
- Check Custom style, go to Appearance > Color > […] and change 'Opacity %' to 0.
Modify label
Click on new label on chart and:
- Check Custom style, under Appearance > Orientation please select 'Horizontal'.
- Under Border > Border width please select 'None'.
- Apply other graphical changes if needed.
Paste in text
Double-click on label and type in new number, date or use Dynamic text.