How adding series works?
By default, when you add a series to a document, the series is automatically visualized in your chart(s). See below how to switch this off.
How to stop series from being added to a chart?
- Click on the background of the chart
- Select the Presentation properties tab
- Click on the More button in the Chart elements group
- Click on 'Include new series automatically' to deselect the setting
As you can see, this setting is chart specific. That way you can continue to create new charts without having to manually add the series to them. Just make sure to switch off the settings every time you finish a chart if you want to keep adding series to your document.
How to add series back to a chart when it disappeared?
If the time series are still in available in the document, they can easily be added to the chart. Go to your chart, right-click on it and choose Graph layout (or use Ctrl+L). Drag the series you lost to the right side of the window to bring them back into the chart.
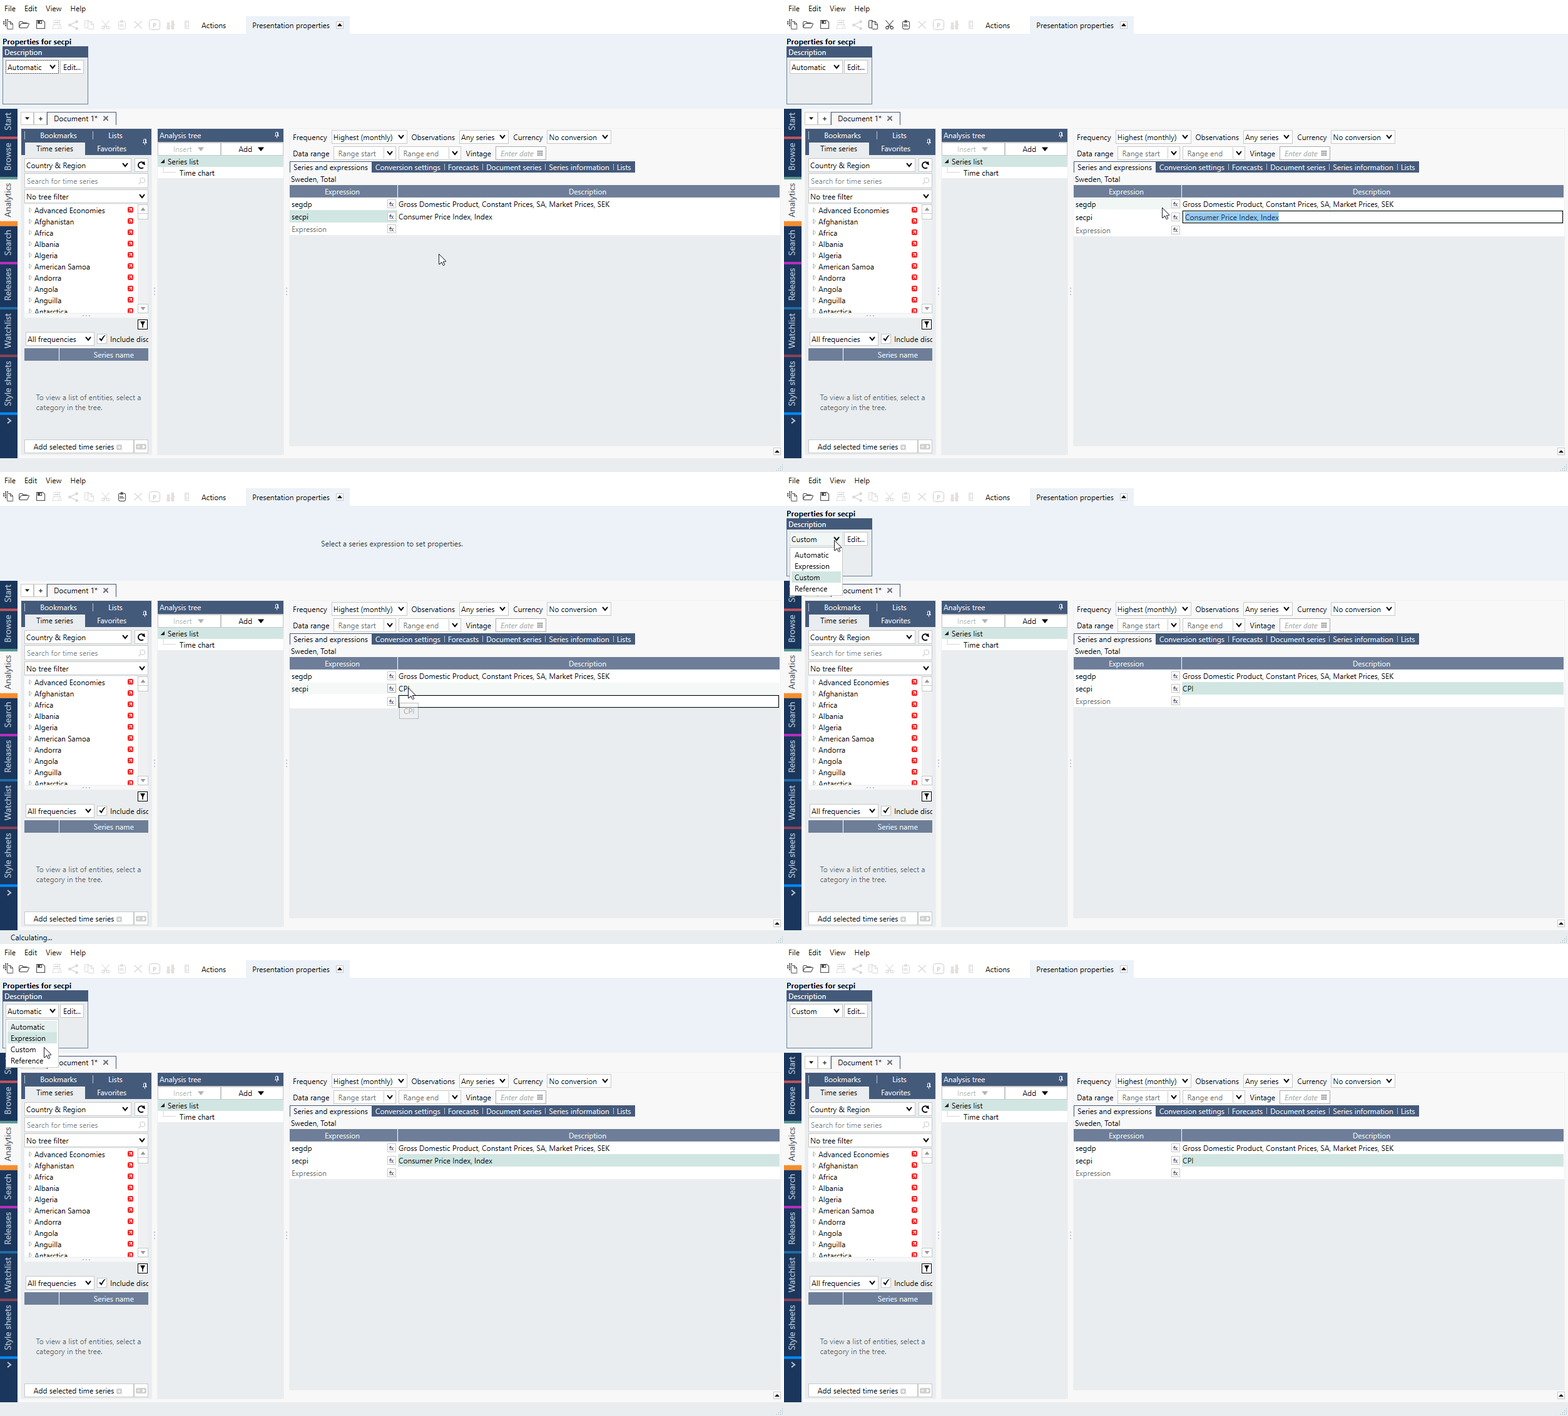
How to change series description?
While on Series list double-click on a Description. Type in new text and leave the cell.

You can also mark the description and select Presentation properties > Description > Edit. Next to Edit button you will see a menu where you can select other options.