Overview
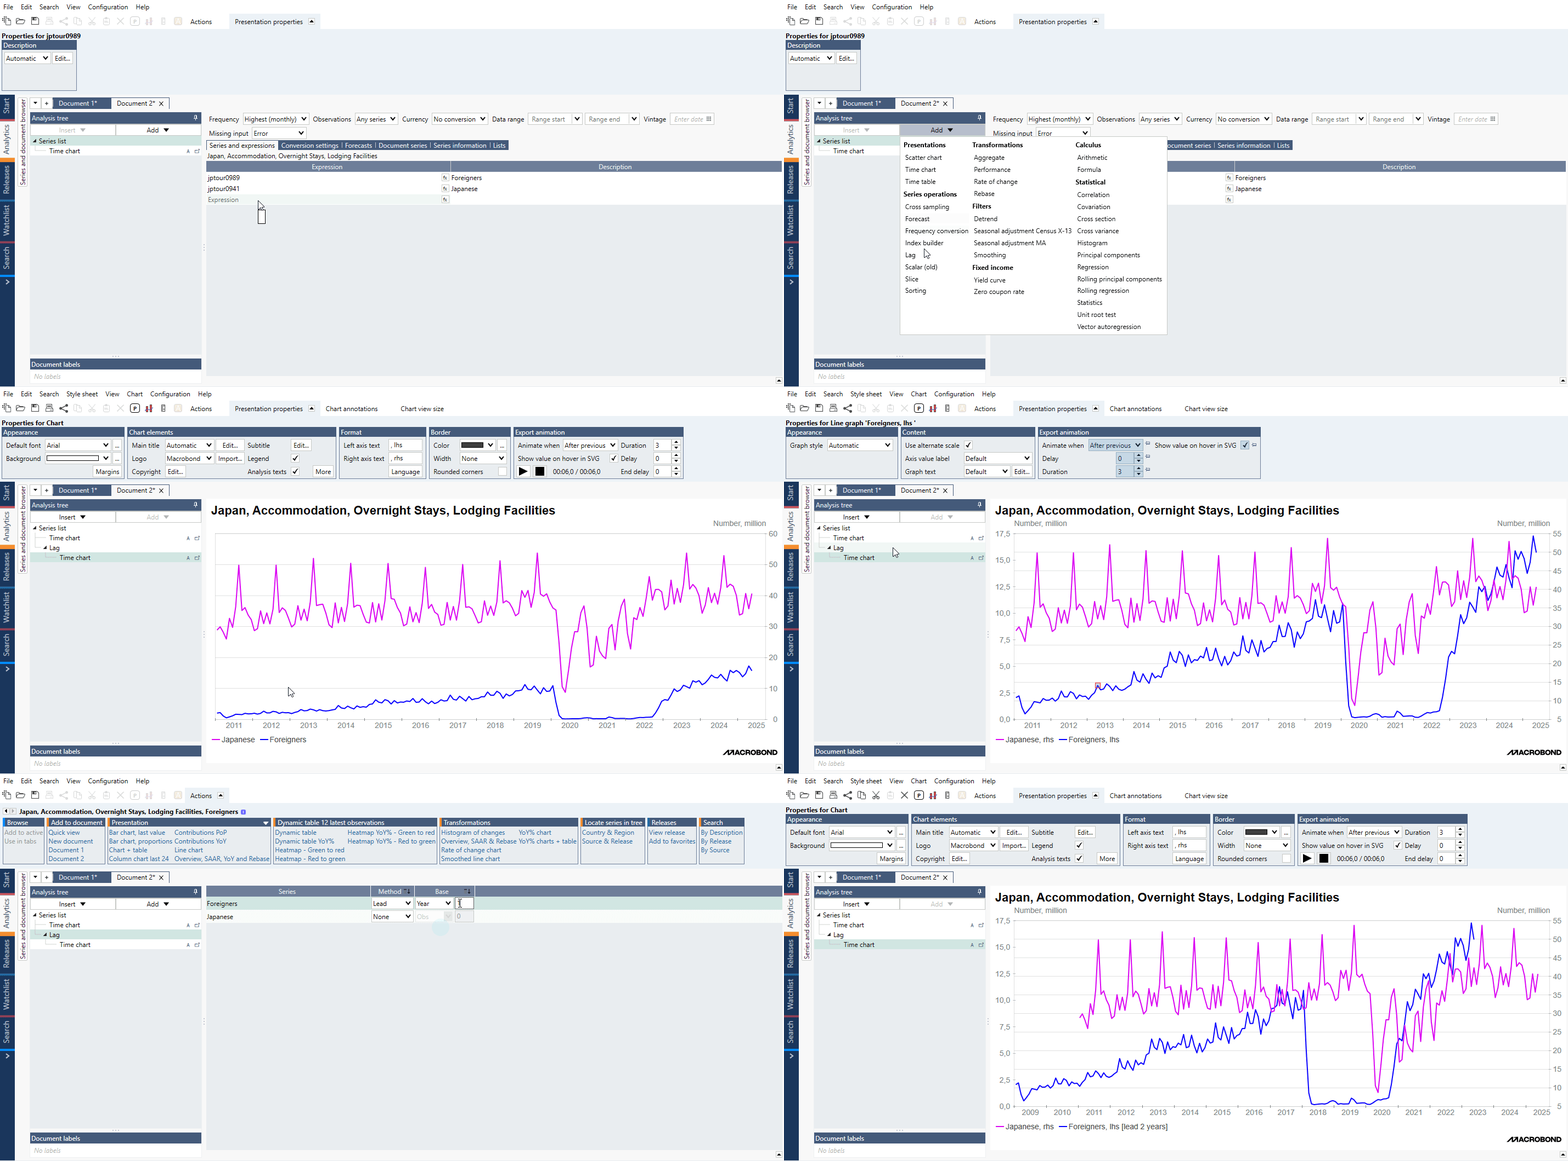
Example of general use of Lag analysis to compare growth trend of two series:

When you are investigating the relationship between series, it can happen that their movements are not synchronized. This is where the Lag analysis becomes useful. It moves values of a series backward or forward in time by the number of observations that you specify. This functionality relates to another analysis, Correlation, which helps you identify the optimal lag setting to get the highest correlation between two series.
Settings
Method
You decide in which direction you want to move the values of the series:
- Lag: moves a series forward by specified length.
- Lead: moves a series backwards by specified length.
Base
Here you specify by how many observations you want to move the series.
Example
In this example, we used the output from the Correlation analysis to decide which settings to apply in the Lag analysis. As a result, we lagged the US ISM PMI by 3 observations the. In the chart, we can now make assumptions on the future movements of Industrial Production, based on the current values of the ISM PMI.
Questions
How do I lag or lead a series?
There are two main possibilities to lead or lag a time series.
- In Lag analysis:
Set the direction as 'Method' and length as 'Base'.
NOTE: 'Lead' moves values backwards in time, while 'Lag' moves values forward.
- With formula:
You can also use the formula:
Lag(series, length)
- The function returns the series lagged by the number of observations specified with the variable 'length'. The 'length' variable is rounded to an integer.
Examples:
Lag(sek, -2)
This will move the series 2 observations backward (meaning 'Lead').
Lag(sek, YearLength())
This will move the series 1 year forward (meaning 'Lag').
For more about Formula and how it's working see Formula analysis.