Overview
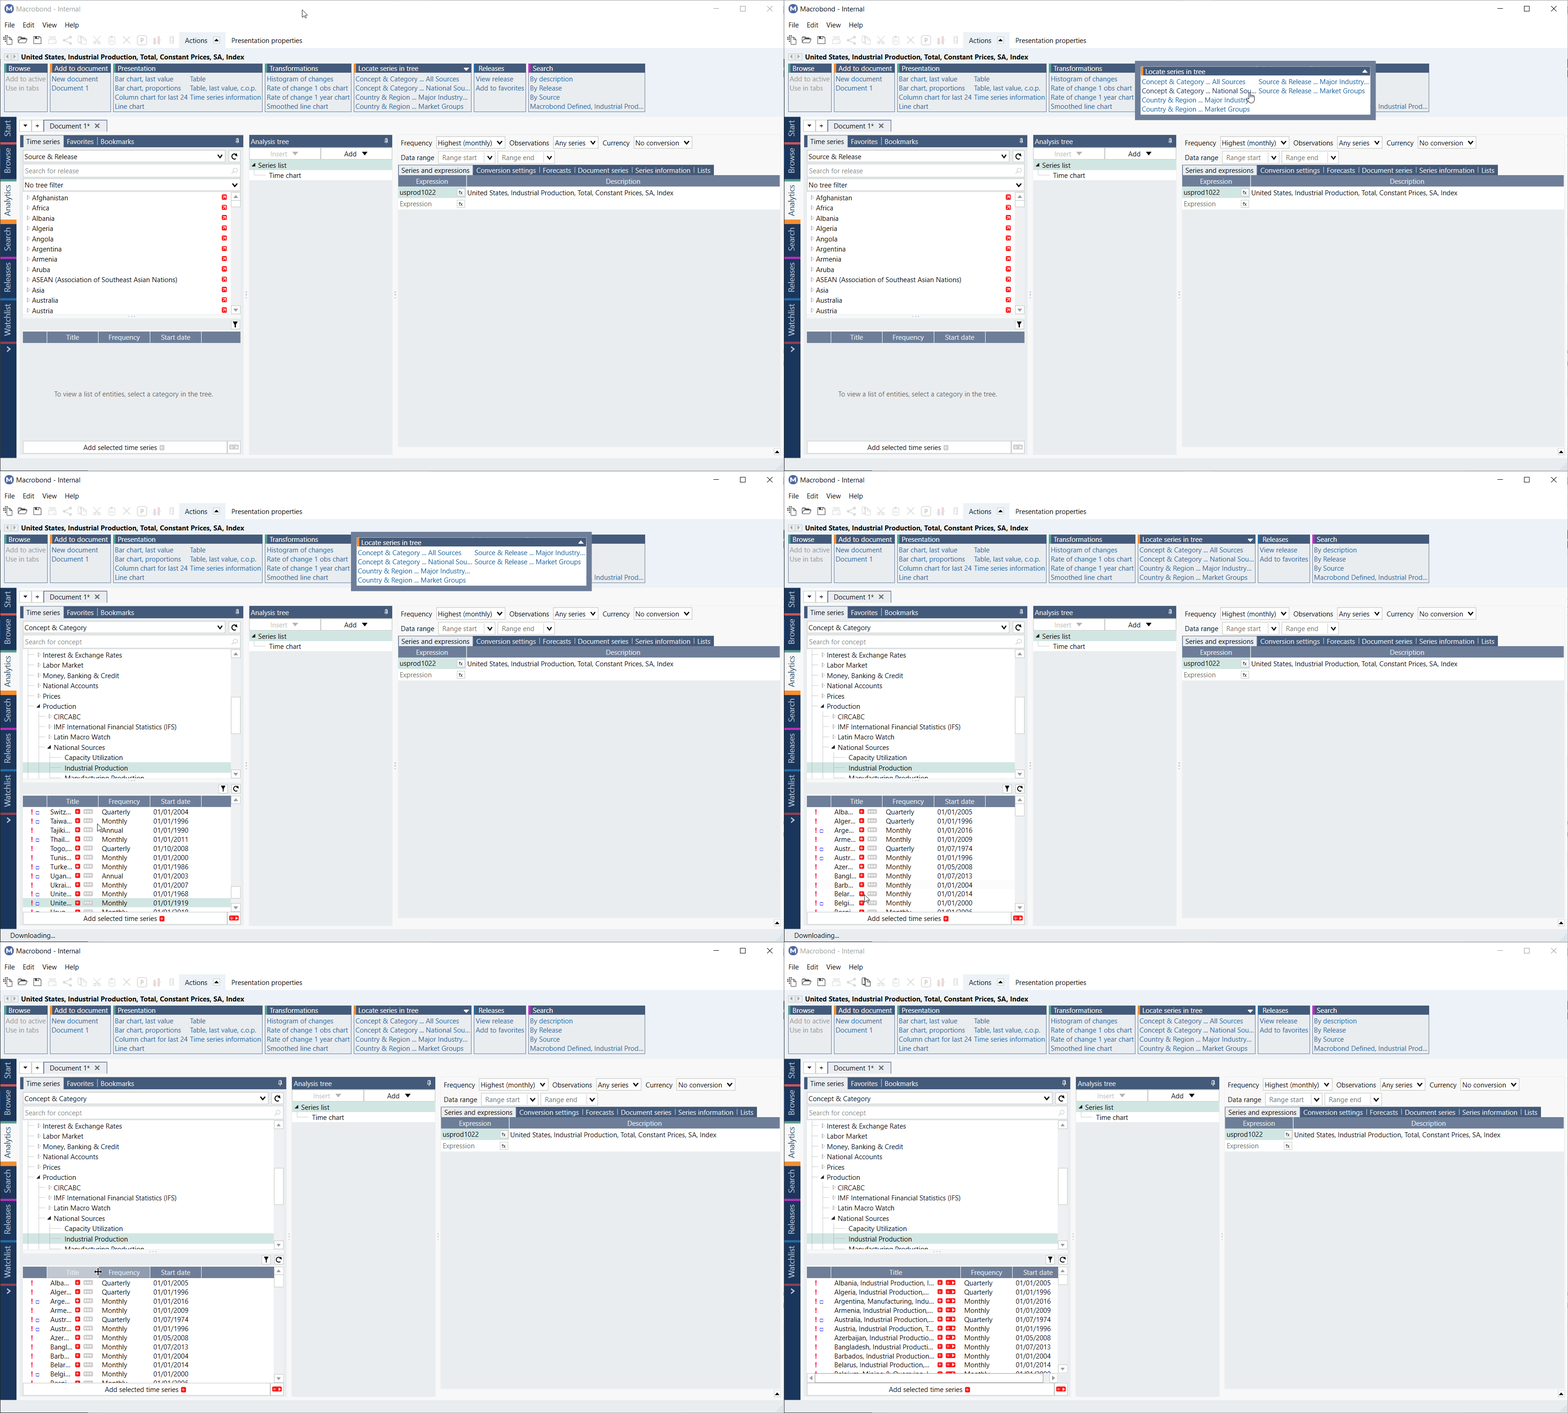
Most time series are available in more than one view of the database, such as Source & Release or Concept & Category. 'Locate series in Tree' is an action that makes it easy to hop between these different views when looking at a particular series.
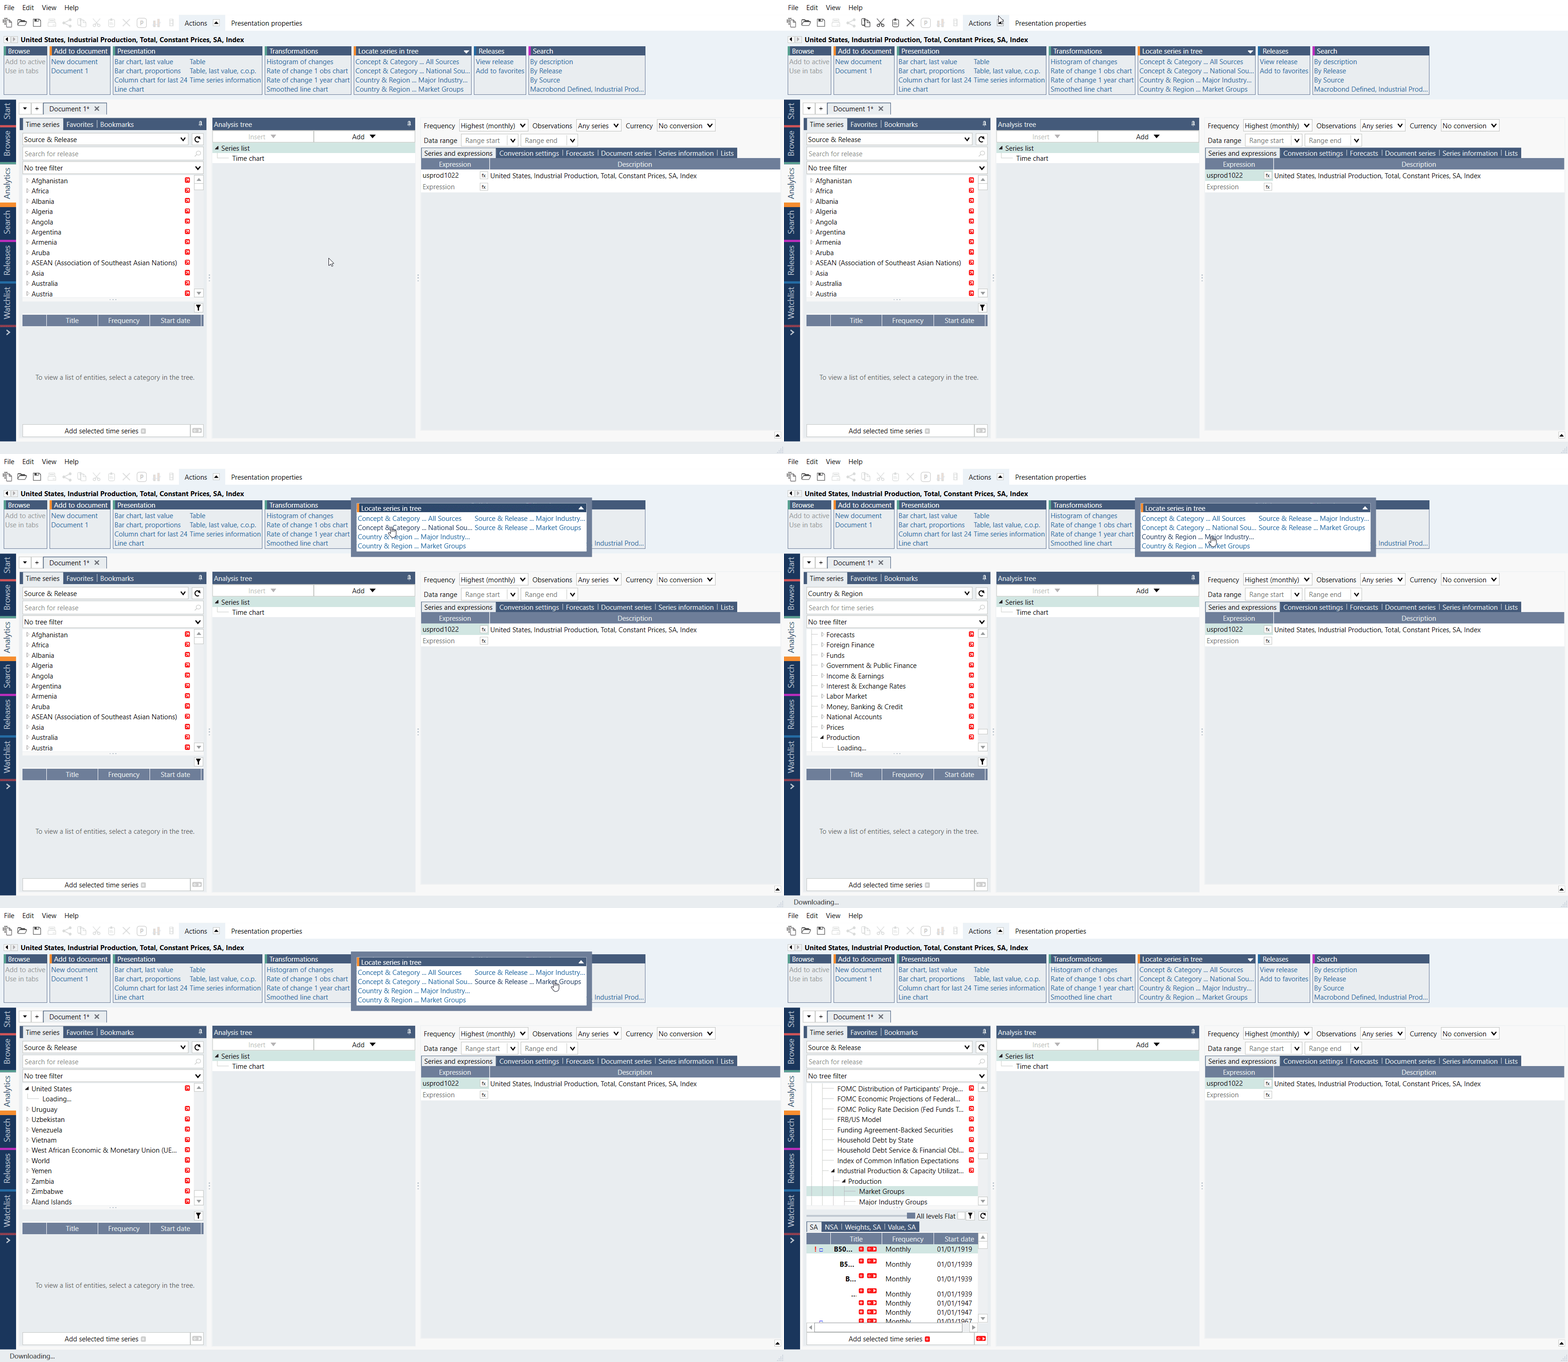
Locate series in tree in
Search activity
The first case we’ll look at is when you come across a series without having looked it up in the Tree, for example, via Search, and want to see where it is located in the Tree. Once you find your series in the list of results, select it, navigate to the actions tab and find the 'Locate in Tree' group. Multiple options will be available, depending on which database views the selected series can be found in.
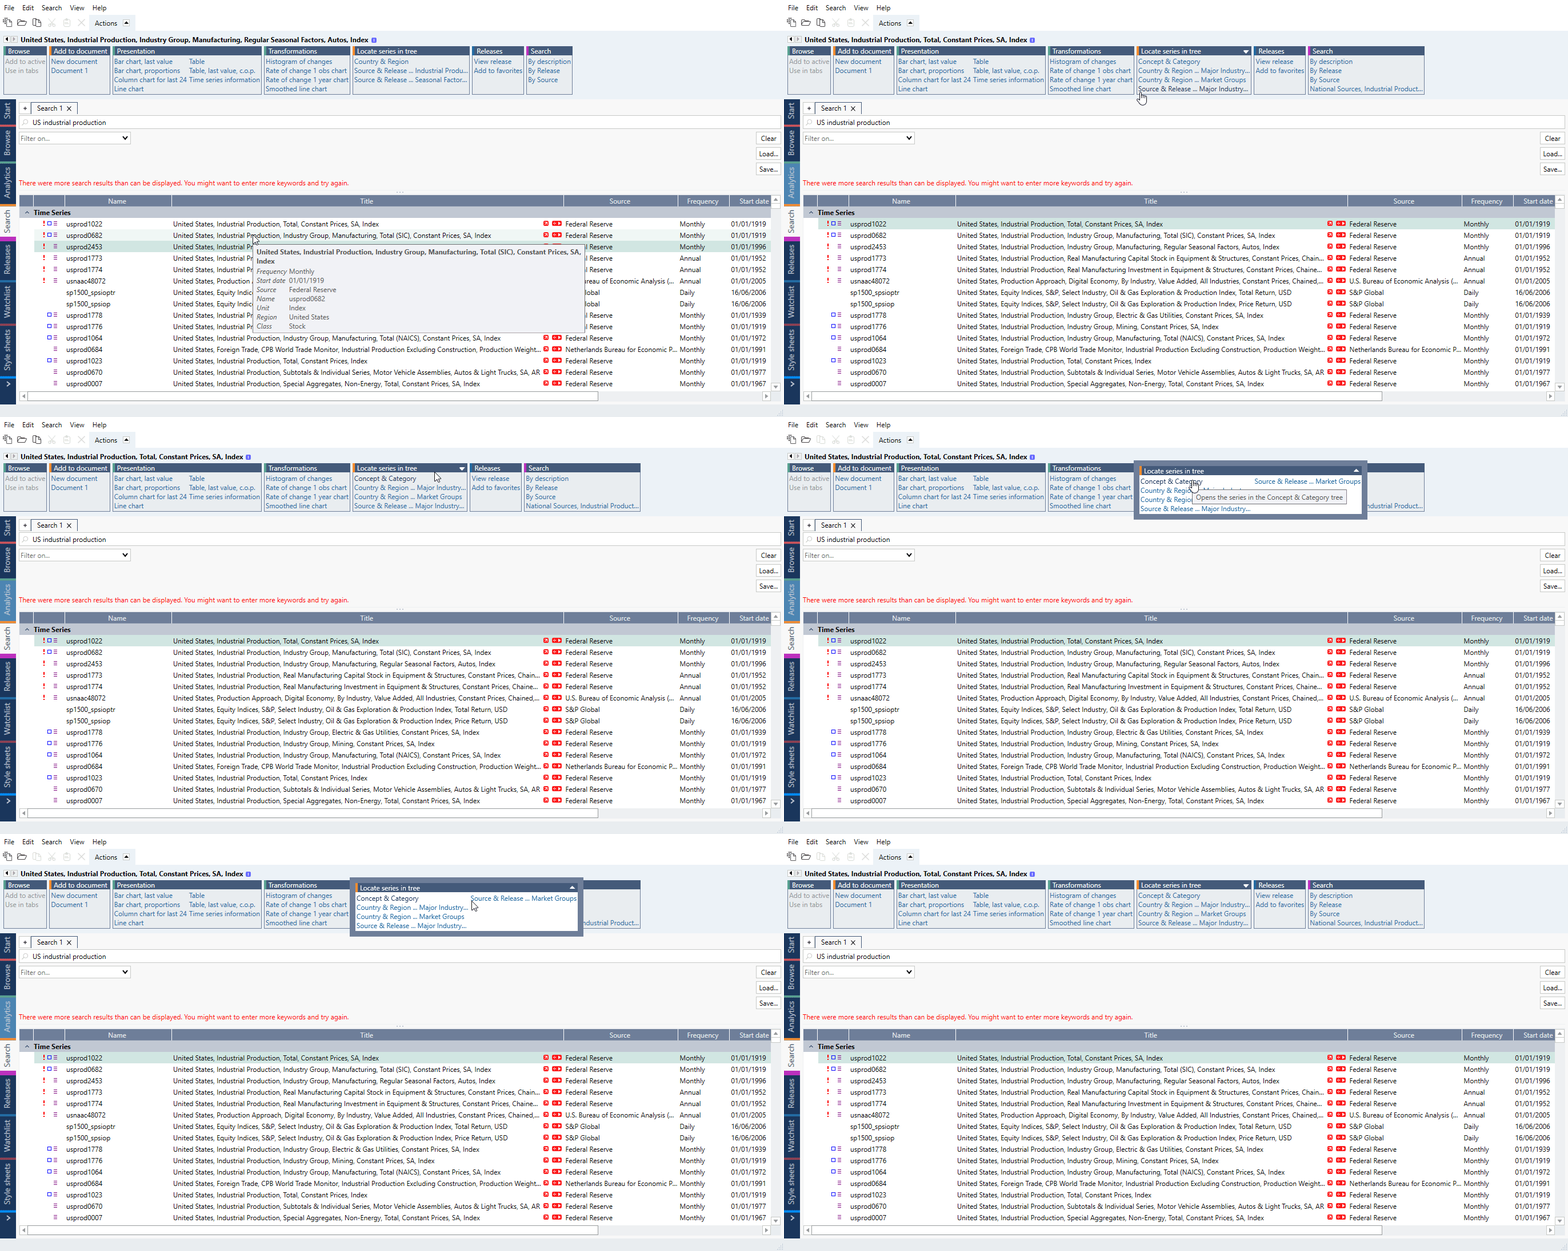
You’ll notice that the actions groups are assigned colors. The color of a group indicates where the action will take place. In this case, the group is orange, the same color as the Analytics tab. So, once you select a database view, the series will be shown in the Analytics tab.
Analytics activity
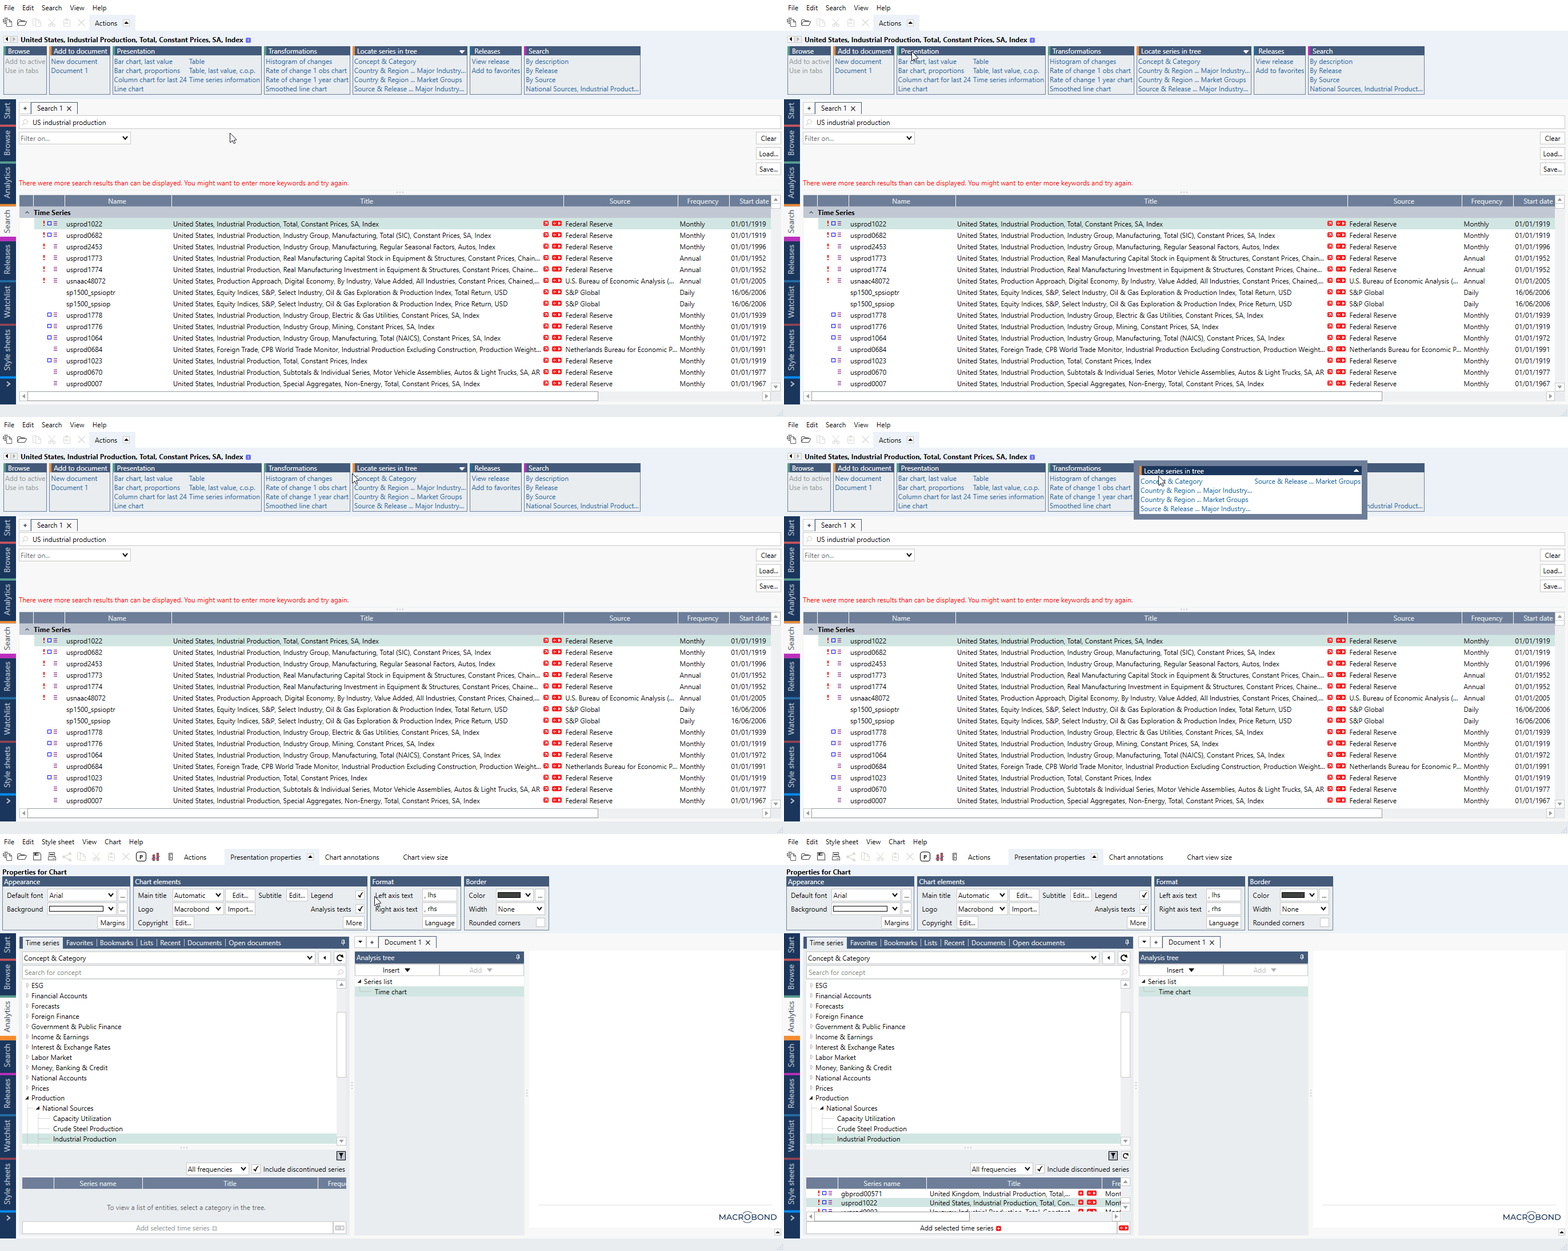
Next, we’ll look at quickly switching between different database views for a selected series, without manually navigating the database. A typical case for using the action this way is when you’re working in Analytics, and want to look into one of the series in a chart. This is especially useful if you’re looking at a chart someone else made, and you want to find out more about the data they used.
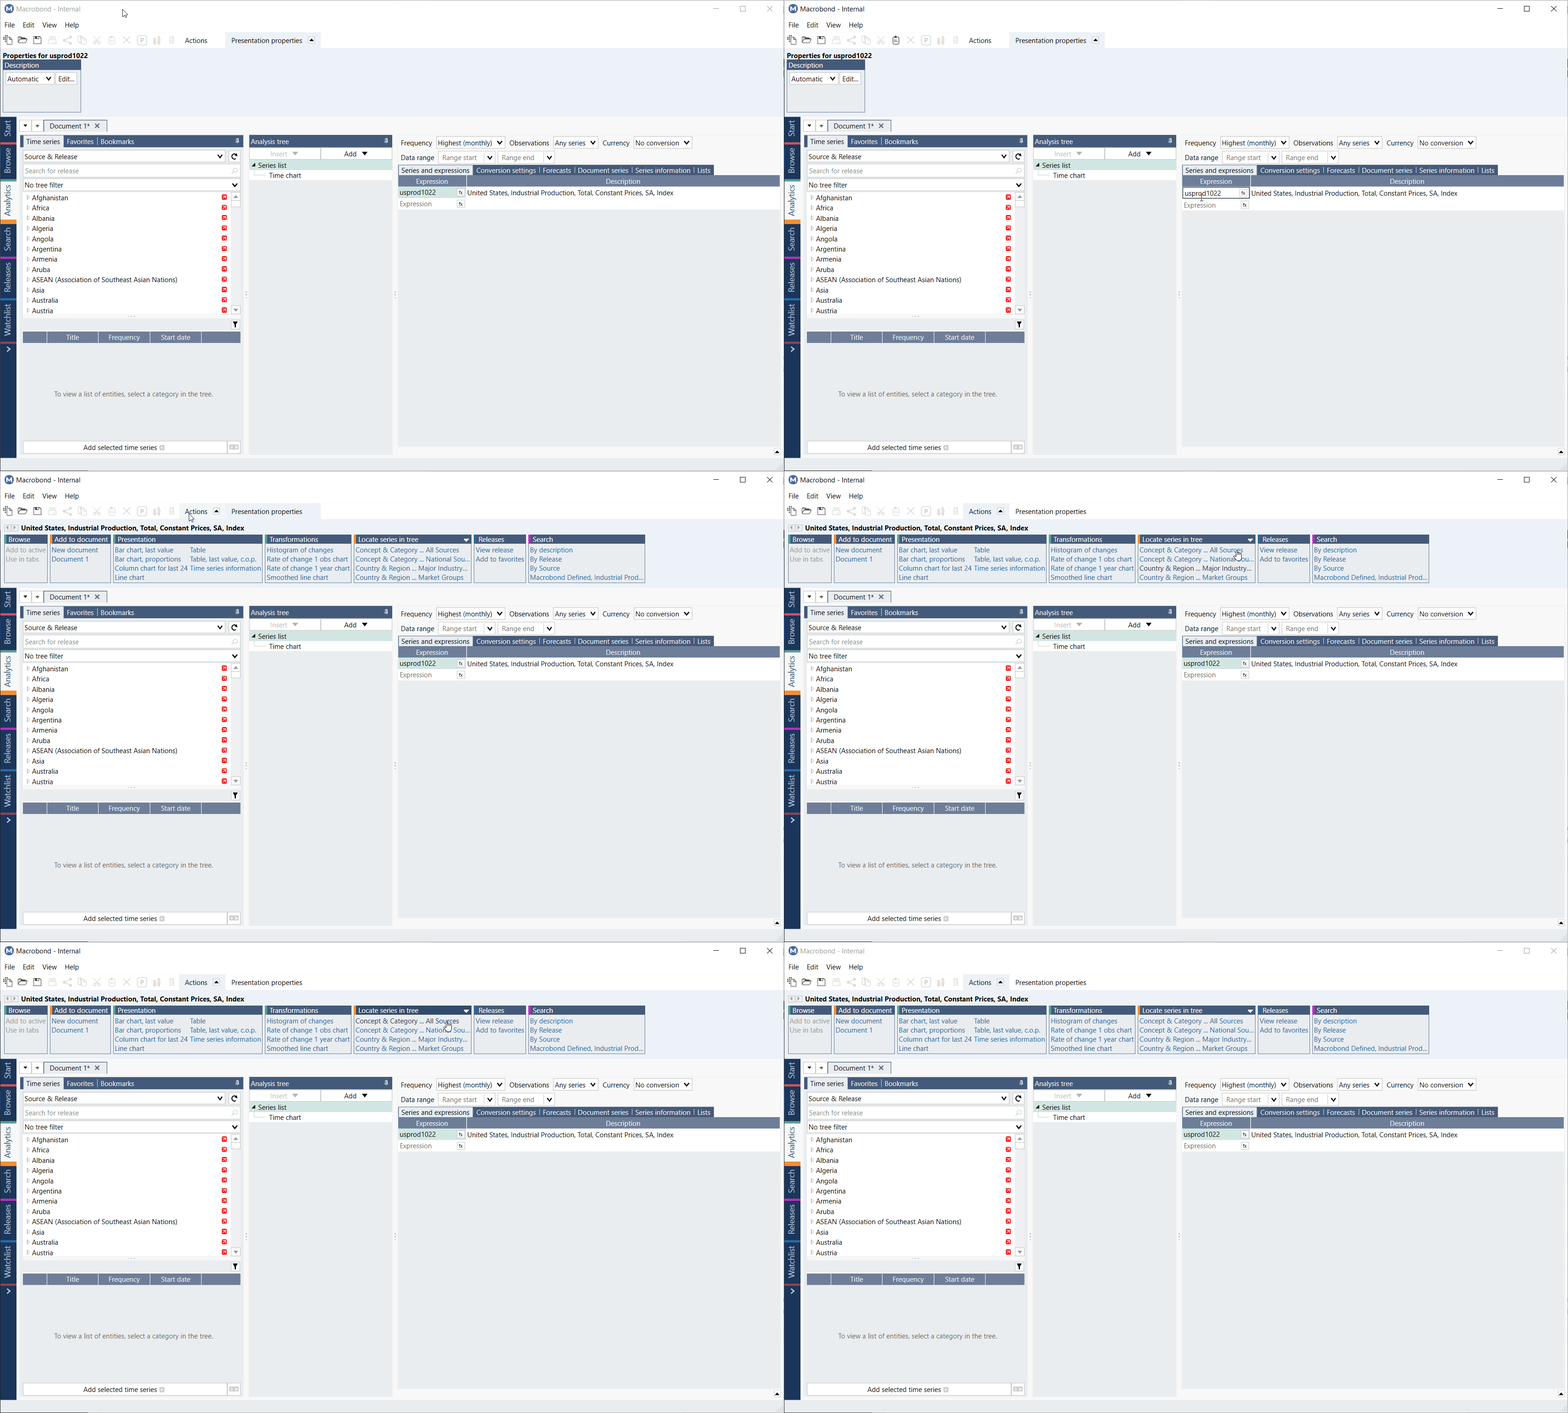
As you can see here, we’ve added the US industrial production series we looked up earlier, to an Analytics document. Let’s say you want to see what other data is available from the source. Navigate up to the Actions tab again, click on by source and you’ll see a new tree structure appear on the left. If you want to see a list of equivalent series for other countries, click on by concept. You’ll notice that this time, the Action group is orange, which is why the data is being displayed in Analytics, and not in Browse, as before.
