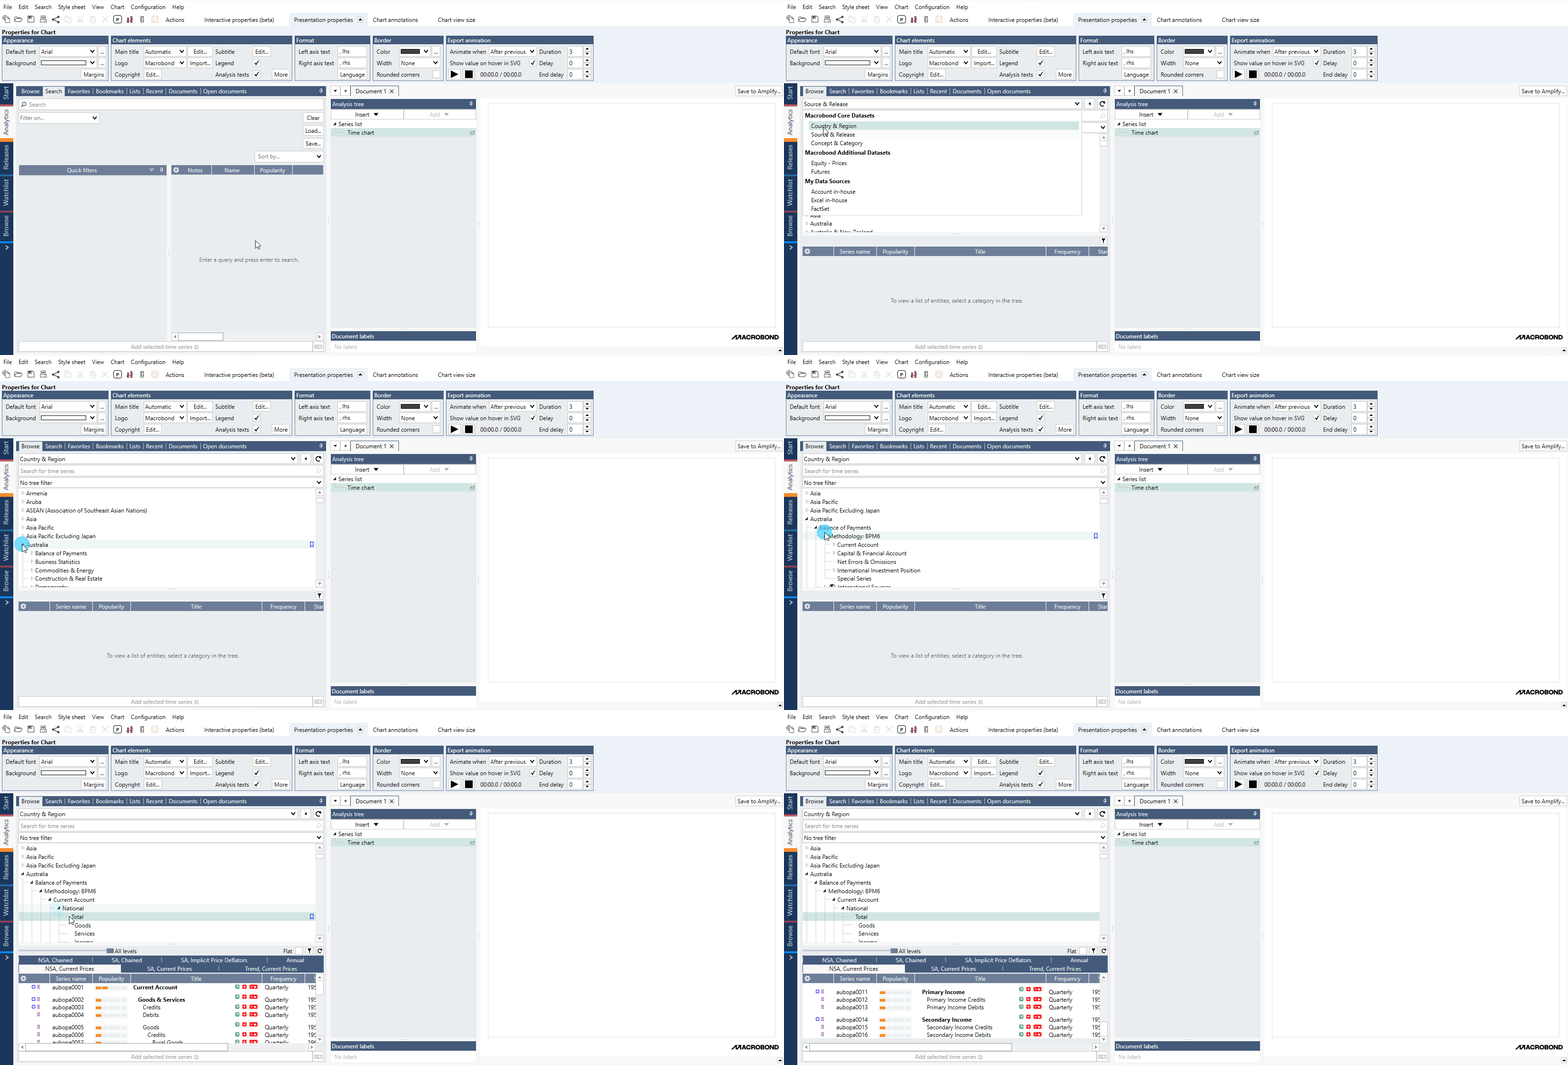
This article will introduce you to the fundamentals of finding data in the application. We’ll take a look at the different activities you can use to find data: Browse, Search and Releases tabs.
Browsing in Analytics tab
When you want to look for data in the application the main option is located inside Analytics tab. The left panel contains Browse tab where you can search through different databases.
The Analytics tab is the powerhouse of the application. If you start by looking for the data here in Analytics, you’ll be able to analyze and chart your work in the same workspace.
You can also use separate Browse tab which is located under Flexi tab (at the bottom of the list under > sign).
How it works?
When opening the drop-down menu, you’ll see three main entry points to navigate the database:
- Country & Region
- Source & Release
- Concept & Category
as well as a list of specialized databases (and your own data) that allow you to access the data separately.
Features for navigating data
Next, let’s look at tree filters, bookmarks and favorites. You can use these to customize and organize the data in a way that suits your work and will make finding data much faster.
Country/region filter
We’ll start with the tree filter. This allows you to define and apply filters based on countries and regions. That way you can limit the data you are shown in the tree to the countries you are interested in, as opposed to having to look through the entire collection.
Bookmarks
Bookmarks are a great way to keep track of the data categories you’re interested in or look at often. What’s good about using bookmarks is that you can view the data in a separate, dedicated tab. Separate tab allows you to keep data well-maintained and tidy in one easily accessible place.
Favorites
Favorites are similar but allow you to highlight specific series, rather than branches of the database as you would with Bookmarks. There are many benefits to saving series as favorites, it's especially helpful as a way to highlight the correct series to use in different cases, if there are a few similar options in the database.
Search tab in Analytics tab
Now, let’s have a look at finding data in Search using keywords. Using the Search tab in Analytics tab allows you to get results from all the databases in the application simultaneously, as opposed to searching in the Browser. For more see Searching through database.
You can also use separate Search tab which is located under Flexi tab (at the bottom of the list under > sign).
Filters
The application contains many millions of time series, so it’s likely that a single keyword relates to multiple series. To get the right results quickly you can use filters to tailor your search. Filters are based on series attributes such as frequency, region, or source. For more see Using the tree filter or Using filters in Search.
Locate in tree
When you’ve found a series via Search it can be helpful to view it in a database tree structure, especially if you’re interested in related series. That’s where Locate in Tree comes in, it’s one of the actions you can take when you click on a series. By choosing one of the views, you’ll be able to see where to find the series in that database and take a look at the other data located there.
Releases tab
To finish off we’ll take a quick look at the Releases tab where you can view and monitor data updates from all the sources. Selecting a particular release gives you access to a variety of information and the main indicators included in that release. Filters are also available in this activity, to help you refine the results. For more see Releases activity tab – future updates
